|
-- Weekly Market Update for the Week Commencing 16th August 2010
Big Picture
View
Here is a summary of our big picture
view of the markets. Note that our short-term views may differ from our
big picture view.
In nominal dollar terms, the BULL market in US Treasury Bonds
that began in the early 1980s will end by mid-2010. In real (gold)
terms, bonds commenced a secular BEAR market in 2001 that will continue
until 2014-2020. (Last
update: 09 February 2009)
The stock market, as represented by the S&P500 Index, commenced
a secular BEAR market during the first quarter of 2000, where "secular
bear market" is defined as a long-term downward trend in valuations
(P/E ratios, etc.) and gold-denominated prices. This secular trend will bottom sometime between 2014 and 2020. (Last update: 22 October 2007)
A secular BEAR market in the Dollar
began during the final quarter of 2000 and ended in July of 2008. This
secular bear market will be followed by a multi-year period of range
trading. (Last
update: 09 February 2009)
Gold commenced a
secular bull market relative to all fiat currencies, the CRB Index,
bonds and most stock market indices during 1999-2001. This secular trend will peak sometime between 2014 and 2020. (Last update: 22 October 2007)
Commodities,
as represented by the Continuous Commodity Index (CCI), commenced a
secular BULL market in 2001 in nominal dollar terms. The first major
upward leg in this bull market ended during the first half of 2008, but
a long-term peak won't occur until 2014-2020. In real (gold) terms,
commodities commenced a secular BEAR market in 2001 that will continue
until 2014-2020. (Last
update: 09 February 2009)
Copyright
Reminder
The commentaries that appear at TSI
may not be distributed, in full or in part, without our written permission.
In particular, please note that the posting of extracts from TSI commentaries
at other web sites or providing links to TSI commentaries at other web
sites (for example, at discussion boards) without our written permission
is prohibited.
We reserve the right to immediately
terminate the subscription of any TSI subscriber who distributes the TSI
commentaries without our written permission.
Outlook Summary
Market
|
Short-Term
(0-3 month)
|
Intermediate-Term
(3-12 month)
|
Long-Term
(1-5 Year)
|
Gold
|
Neutral
(04-Jul-10)
|
Bullish
(12-May-08)
|
Bullish
|
US$ (Dollar Index)
|
Bullish
(14-Jul-10)
| Bullish
(02-Nov-09)
|
Neutral
(19-Sep-07)
|
Bonds (US T-Bond)
|
Neutral
(17-May-10)
|
Bearish
(14-Dec-09)
|
Bearish
|
Stock Market (S&P500)
|
Bearish
(16-Jun-10)
|
Bearish
(11-May-09)
|
Bearish
|
Gold Stocks (HUI)
|
Neutral
(07-Jun-10)
|
Bullish
(23-Jun-10)
|
Bullish
|
| Oil | Bearish
(19-Jul-10)
| Bearish
(01-Mar-10)
| Bullish
|
Industrial Metals (GYX)
| Bearish
(21-Sep-09)
| Bearish
(25-May-09)
| Neutral
(11-Jan-10)
|
Notes:
1. In those cases where we have been able to identify the commentary in
which the most recent outlook change occurred we've put the date of the
commentary below the current outlook.
2. "Neutral", in the above table, means that we either don't have a
firm opinion or that we think risk and reward are roughly in balance with respect to the timeframe in question.
3. Long-term views are determined almost completely by fundamentals,
intermediate-term views by giving an approximately equal weighting to
fundamental and technical factors, and short-term views almost
completely by technicals.
Gold as money
Money is the economic good
against which almost all other goods are traded, or, to put it more
simply, money is the general medium of exchange within an economy. The
corollary is that if something is the general medium of exchange within
an economy, then that 'thing' is money.
Sound money will retain its value over time (it will be a good store of
value), but something can be money and not be a good store of value*.
Also, there are many things that are good stores of value but are not
money. Again, the test of whether or not something is money involves
asking the question: Is it the general medium of exchange? If the
answer is yes, then it is money, if the answer is no, then it is not.
For example, the US dollar passes this test (and is therefore "money")
within the US and a few "dollarised" countries, but not elsewhere. For
another example, the euro passes the "money" test throughout much of
Europe, but not outside Europe. Where, then, does that leave gold, an
economic good that was money for thousands of years?
Unfortunately, gold no longer passes the "money" test in any of today's
major economies. We say "unfortunately" because if governments had not
forcibly removed gold from its monetary role, often using the excuse
that a more flexible type of money was needed to prevent financial
crises and economic downturns, debt levels could never have reached the
unmanageable proportions of today and the future would probably look
much brighter.
Strangely, stating the FACT that gold is no longer money is viewed as
heresy by some gold bulls. We aren't sure why, because recognising that
gold doesn't perform the monetary role at this time doesn't devalue the
metal in any way. As noted above, we wouldn't be in this economic mess
if the general medium of exchange were gold or gold-like. Perhaps these
gold bulls are confusing what should be with what is.
In an effort to explain how gold could still be money even though it is
no longer the general medium of exchange, some people have redefined
the terms "money" and "currency" in an imaginative way. Money, they
say, is an abstract concept, whereas currency is what generally gets
exchanged when things are bought and sold. Using these definitions it
can be argued that gold is still money even though it is no longer
widely used as a currency.
People are obviously free to use whatever definitions they believe make
the most sense, but in this case changes are being made to
well-established, precise and useful definitions solely for the purpose
of avoiding a distasteful conclusion. It is better, we think, to face
reality.
The reality is that nowadays gold is sometimes used as a currency,
meaning that there are certain situations where gold is used to
purchase things, but gold is not the currency in general use throughout
the economy. In other words, gold is not money, but it is occasionally
used as a currency.
Looking ahead, is it possible that gold will, again, be money?
The answer is yes. Gold is actually better suited to being money today
than it ever has been in the past, thanks to technology that allows
gold ownership to simply and instantly be transferred without the need
to physically move bullion. Almost all the monetary gold could remain
locked in vaults, with ownership to a quantity of gold -- anywhere from
a tiny fraction of a gram to many kilograms, depending on what is being
purchased -- being effected electronically.
As an aside, we are discussing the possibility of a return to using
gold as money as opposed to a return to some form of gold standard
where dollars, euros, etc. are money backed by gold. A gold standard or
any other monetary standard managed by government will always be far
from ideal because governments invariably find excuses to change the
rules (an official convertibility rate of X$ per ounce of gold could,
for instance, be changed to 2X$ per ounce of gold with the stroke of a
politician's pen).
But although technology available today paves the way for the more
efficient use of gold as money, it is extremely improbable that gold
will ever again be money unless there is first a total economic
collapse. This is because only a total economic collapse would be
capable of bringing about the sort of political change that would make
sound money feasible. The reality is that the current sizes of the
government and the government's future obligations (social security,
pensions, promised 'free' medical care, deposit insurance, the dole,
payments to bondholders, etc.) are completely and blatantly
incompatible with sound money. Implementing sound money and leaving
everything else the same would be like trying to keep a Ponzi scheme
going without sucking in new investment.
So, replacing money that the government can inflate at will with money
that has rigid limitations on its supply could only occur in parallel
with direct default on a massive scale and the shrinkage of the
government to a small fraction of its current self. It is not realistic
to expect that this will happen as long as it remains possible to 'kick
the can down the road' a little further.
*Money that is not
a good store of value will tend to have a relatively short lifespan,
but it will be money as long as it continues to be used in the vast
majority of economic transactions.
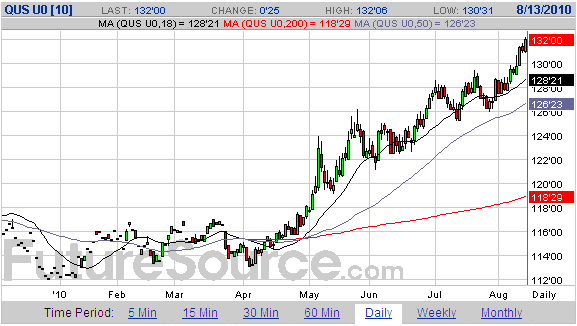
Treasury Bonds
The T-Bond market is the market that tends to give us the most trouble.
This is at least partly due to our inherent bias against T-Bonds, which
regularly causes us to under-estimate their upside potential. It could
also be because we regularly over-estimate the bond market's ability to
see the eventual inflationary consequences of monetary and fiscal
policies, although the bond market's apparent inability to appreciate
the eventual effects of today's policies could stem from the fact that
a lot of the demand for long-term bonds comes from short-term traders
and from price-insensitive buyers (other central banks). In other
words, it may be more appropriate to say that a lot of bond buyers
don't care about long-term effects rather than to say that they fail to
understand these effects.
There's a good chance that the bond market's upward trend will continue
into the final quarter of the year and culminate at, or shortly after,
the stock market reaches an important low. However, a significant
intervening downward correction is likely to begin in the near future.
This is because the sharp up-move of the past three weeks has the look
of a mini blow-off (refer to the following daily chart for details),
and because the structure of the T-Bond futures market is no longer
supportive (the "Commercials" have just become net-short T-Bond futures
for the first time since 2007).
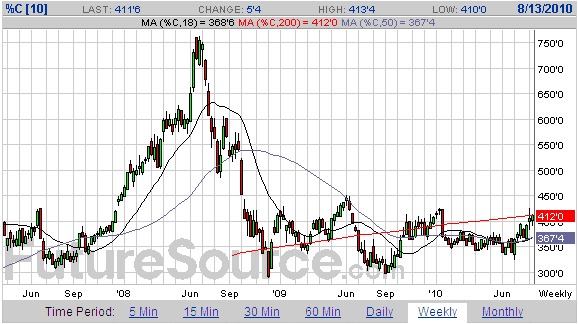
Corn
We don't pretend to be
experts on weather, but based on information from people who are expert
it seems that the weather patterns that produced the current drought in
the grain-producing regions of Russia and Central Asia are related to
natural long-term ocean cycles (e.g. the Pacific Decadal Oscillation,
which is the name given to the shift of warm water between the eastern
and the western sides of the Pacific every 30-40 years). As a result,
the unusually difficult conditions in Russia could extend well into
next year, and serious drought is more likely to repeat over the coming
decade.
The drought has caused the global supply of wheat to be much less than
the market was earlier expecting, so the wheat price has naturally
rocketed upward. However, increases in corn and soybean prices have
been relatively modest to date. For example, the following weekly chart
shows that while corn futures have bounced over the past few weeks,
they remain within the narrow price range of the past 12 months. This
is undoubtedly because 2010 is going to be a bumper year for US corn
production, but what about 2011's corn production? If it becomes
apparent that wheat prices are going to remain elevated due to
continuing sub-par growing conditions in Russia, then US farmland that
would otherwise have been allocated to corn will, instead, be allocated
to wheat, causing next year's corn production to be less than currently
expected.
The point is that if the wheat price stays high or moves higher then
other grain prices are likely to follow, leading to a new cyclical bull
market in the grains.
Interesting quote or fact of the week
From "The Roosevelt Myth" by John Flynn:
"If one political policy
failed he could cast it off and move over to another without meeting
resistance from any underlying philosophy to which he was attached.
This is the explanation of the ease with which he could announce a
whole collection of policies and plans in his first campaign for the
presidency and, immediately after inauguration, toss practically all of
it overboard and adopt another set of policies based upon a wholly
different theory of government. And when in turn by 1938 all of these
had been blown to bits by the inexorable logic of events, he could toss
them over and open his mind to that weird collection of theories which
the Tugwells and Hansens and Wallaces sold to him. Yet in making these
shifts he was doing no violence to any real conviction. He was not
being disloyal to any settled belief. He was in fact behaving with
complete logical conformance to the one political conviction he held. A
policy to [Franklin] Roosevelt was good or bad depending on whether or
not it commanded valuable political support among voters. If it brought
to his side any numerous group of voters it was a wise policy. If it
failed to do this he could reject it or throw it over without doing
violence to any controlling central political philosophy."
F. D. Roosevelt's all-encompassing political pragmatism (his belief
that the merits of a policy were solely determined by how many votes
would likely be gained or lost through its implementation) was novel at
the time, but has since become the norm.
The Stock
Market
Current Market Situation
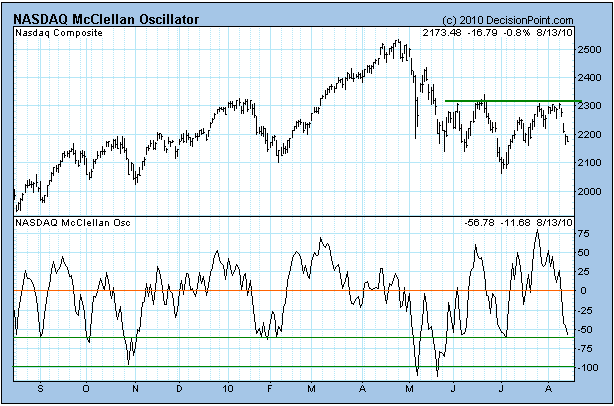
The top section of the following chart shows that resistance defined by
the June highs capped the July-August rebound in the NASDAQ Composite
Index. It also shows that over the past four trading days the NASDAQ
gave back more than half of the gains achieved in the multi-week
rebound from the early-July low.
The bottom section of the chart shows that even though the current
decline is only four days old, the NASDAQ's McClellan Oscillator (MO)
is already approaching an oversold extreme. Significant additional
weakness over the next 2-3 trading days would probably push the
NASDAQ's MO down to near -100, which is about as low as it ever gets.
Rather than reaching a decline-ending 'oversold' extreme in the
immediate future, it is more likely that the market will rebound over
the coming week.
A rebound this week
would be consistent with a literal interpretation of the "Presidential
Cycle Model" that we've been monitoring since the beginning of the
year. This Model suggests that an accelerated move to the downside
won't begin until late this month.
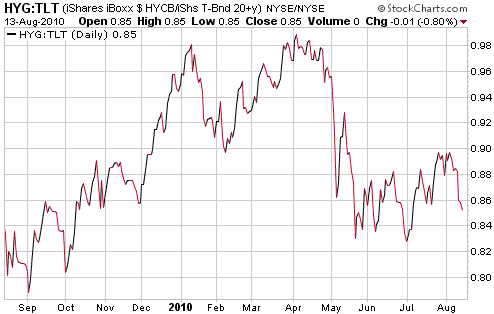
The next chart indicates that last week's downside in the stock market
was confirmed by a widening of credit spreads (the HYG/TLT ratio moves
lower when credit spreads widen). Credit spreads should continue to
widen (high-yield bonds should continue to under-perform) as the stock
market works its way down to an October low.
This week's
important US economic events
| Date |
Description |
Monday Aug 16
| Treasury International Capital
Housing Market Index
| | Tuesday Aug 17 | Housing Starts
PPI
Industrial Production
| | Wednesday Aug 18
| No important events scheduled
| | Thursday Aug 19
| Leading Economic Indicators
| | Friday Aug 20
| No important events scheduled
|
Gold and
the Dollar
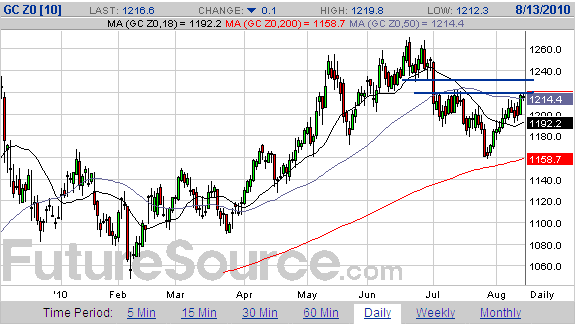
Gold
The daily chart displayed below shows that December gold has moved up
to the bottom of the $1220-$1230 resistance range. It also shows that
the rising 200-day moving average is now almost level with the July
pullback low of $1160. Our guess is that resistance at $1220-$1230 will
hold for now and that the gold price will drop back to test support at
$1160. If this support fails to hold then a further decline to the
mid-$1000s will probably ensue.
In our opinion, it is very unlikely that gold will drop lower than the mid-$1000s before resuming its long-term advance.
June-August is often
a slow period in both the stock and the gold markets, with the markets
coming back to life towards the end of August. In this regard, 2010 has
been a normal year. Thankfully, over the coming fortnight we will be
moving out of the seasonally slow period and into a 2-month period that
tends to be 'interesting'.
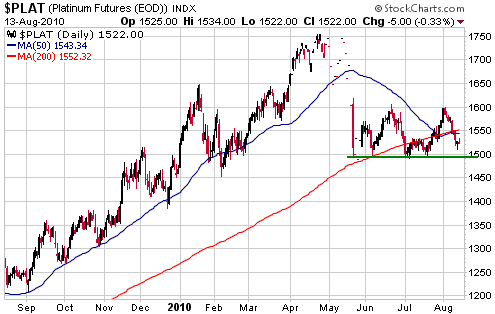
Platinum
At the moment, the more 'industrial' a precious metal the more bearish
its chart pattern (which makes sense considering that economic weakness
has only been temporarily masked by government "stimulus"). What we
mean is that silver's chart looks more bearish than that of gold and
platinum's chart pattern looks more bearish than that of silver.
A daily chart of platinum futures is included below. Notice the
similarities between this chart and the NASDAQ chart shown above. In
both cases, a steady rise to an April peak was followed by a plunge and
then a weak rebound. And in both cases the weak rebound has potentially
formed the "right shoulder" of a "head and shoulders" top.
Platinum has support at $1480-$1500. Breaching this support would create a measured objective of $1200-$1250.
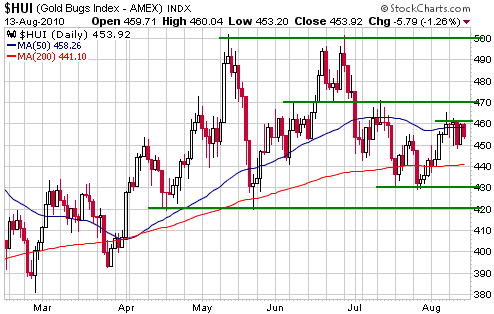
Gold Stocks
The HUI spent last week between 450 and 460, and failed to confirm
gold's rise to a new multi-week high. Taking into account the recent
price action, we won't be surprised if the HUI breaks through the top
of last week's narrow range and moves up to 470; however, we doubt that
it will do significantly better than that over the next couple of weeks.
Support lies at 420-430. Breaking through this support would probably
be followed by the test the February low (370) that we've been
anticipating for the past few months. And if this were to happen it
would create a terrific opportunity to buy gold stocks in preparation
for what should be a very strong gold market during 2011-2013.
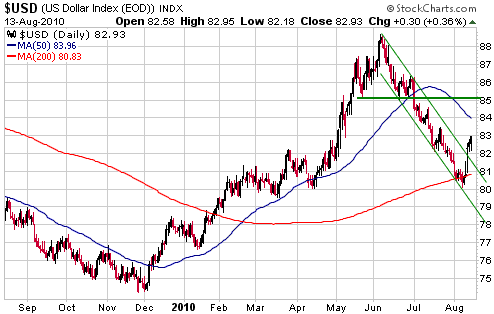
Currency Market Update
Last week's downward reversal in the stock market was associated with
an upward reversal in the Dollar Index. By breaking decisively above
its channel top (see chart below), the Dollar Index has provided
preliminary evidence that a correction low is in place.
The initial upside target is resistance at 85. It is possible that the
Dollar Index will move up to this target without much hesitation, but
if the stock market rebounds over the coming week then the US$ will
probably retrace part of last week's gain before making much additional
headway.
Update
on Stock Selections
(Notes: 1) To review the complete list of current TSI stock selections, logon at http://www.speculative-investor.com/new/market_logon.asp
and then click on "Stock Selections" in the menu. When at the Stock
Selections page, click on a stock's symbol to bring-up an archive of
our comments on the stock in question. 2) The Small Stock Watch List is
located at http://www.speculative-investor.com/new/smallstockwatch.html)
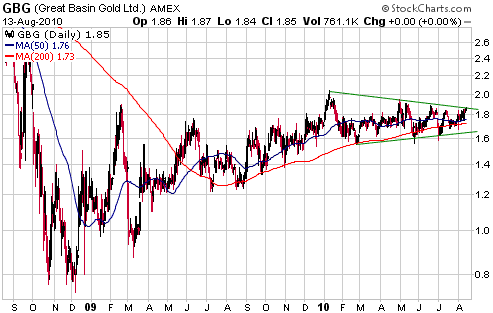
 Great Basin Gold (AMEX and TSX: GBG). Shares: 348M issued, 454M fully diluted. Recent price: US$1.85 Great Basin Gold (AMEX and TSX: GBG). Shares: 348M issued, 454M fully diluted. Recent price: US$1.85
This is an interesting and critical time for GBG, for two main reasons.
First, the company's two main projects (the Burnstone project in South
Africa and the Hollister project in Nevada) should reach commercial
production within the next two months. If all goes according to plan,
Burnstone will produce 150K ounces of gold next year, 250K ounces in
2012 and more thereafter, while Hollister will have steady production
of around 120K ounces per year. Second, 56M warrants with an exercise
price of C$1.60 are due to expire on 15th October 2010. This means that
if GBG's stock price remains comfortably above C$1.60 over the next two
months then about C$90M will flow into the company's coffers,
considerably strengthening its balance sheet. On the negative side, the
exercising of these warrants would result in a lot of new shares being
issued and would probably limit the stock's short-term upside potential
even while it strengthened the balance sheet.
GBG's chart (see below) shows that the stock has done very little over
the past 8 months. It has essentially traded sideways since late last
year within a narrow (and narrowing) range, and ended last week at the
top of its contracting range.
A decisive break above the top of this year's range would create a
chart-based target of around US$2.50. Taking into account GBG's
valuation, the remaining uncertainties and the potential effects of the
soon-to-expire warrants, we will probably exit if we are able to do so
at around US$2.50 within the next two months.
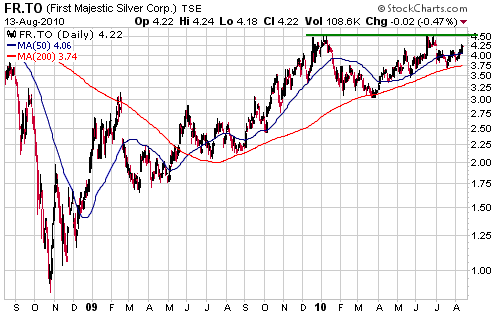
First Majestic Silver (TSX: FR). Shares: 93M issued, 108M fully diluted. Recent price: C$4.22
FR's latest quarterly results, which were released after the close of
trading on Friday, revealed that growth in its silver production is now
(finally) starting to pay off in terms of reduced operating costs and
increased profitability. FR had earnings of C$0.096/share during the
June quarter, which equates to C$0.38/share on an annualised basis.
The following chart shows that FR has well-defined resistance at
C$4.50. A break above this resistance would create a measured objective
of C$6.00, which, we think, would also reflect full value assuming a
silver price of $18-$20. Going the other way, there is very strong
support in the low-C$3 area.
FR is not likely to buck the sector-wide trend, so if the precious
metals sector trends downward to an October-November low then FR will
probably do the same. Under this scenario there could be an opportunity
to buy the stock near the aforementioned support within the next three
months. On the other hand, if the silver market proves to be more
resilient than we currently expect then FR could soon break out to the
upside and begin making its way towards C$6.
We'd be buyers at C$3.00-C$3.50 and holders at the current price.
Greenscape Capital (TSXV: GRN) is involved in a number of "green"
businesses and projects, most notably the development of a new parking
facility -- touted as being the world's greenest parking facility --
serving the Denver International Airport (DIA). The DIA parking
facility is under construction with an expected completion date of
November-2010 and an appraised value of around US$32M. This appraised
value equates to about C$0.77 per GRN share assuming a total share
count of 30M and accounting for about $10M of debt. GRN's stock price
ended last week at C$0.325.
GRN is too small and illiquid to be put into the TSI Stocks List, but
we previously wrote it up in the 22nd February 2010 Weekly Update as a
speculative idea that readers might want to investigate further. We are
mentioning it again because it is now cheaper and a lot closer to
having a business that generates significant positive cash flow. It is
still very risky, though, because it doesn't have much financial
flexibility and could therefore have a problem if the parking project
experiences cost over-runs and/or delays.
GRN's chart shows resistance at C$0.35-C$0.40. A daily close above C$0.40 would be a clear sign that a bottom was in place.
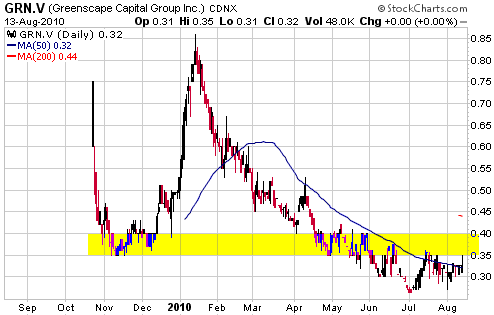
Chart Sources
Charts appearing in today's commentary
are courtesy of:
http://stockcharts.com/index.html
http://www.futuresource.com/
http://www.decisionpoint.com/

|