|
-- Weekly Market Update for the Week Commencing 16th September 2013
Big Picture
View
Here is a summary of our big picture
view of the markets. Note that our short-term views may differ from our
big picture view.
In nominal dollar terms, the BULL market in US Treasury Bonds
that began in the early 1980s will end by 2013. In real (gold)
terms, bonds commenced a secular BEAR market in 2001 that will continue
until 2014-2020. (Last
update: 23 January 2012)
The stock market, as represented by the S&P500 Index,
commenced
a secular BEAR market during the first quarter of 2000, where "secular
bear market" is defined as a long-term downward trend in valuations
(P/E ratios, etc.) and gold-denominated prices. This secular trend will bottom sometime between 2014 and 2020.
(Last update: 22 October 2007)
A secular BEAR market in the Dollar
began during the final quarter of 2000 and ended in July of 2008. This
secular bear market will be followed by a multi-year period of range
trading.
(Last
update: 09 February 2009)
Gold commenced a
secular bull market relative to all fiat currencies, the CRB Index,
bonds and most stock market indices during 1999-2001.
This secular trend will peak sometime between 2014 and 2020.
(Last update: 22 October 2007)
Commodities,
as represented by the Continuous Commodity Index (CCI), commenced a
secular BULL market in 2001 in nominal dollar terms. The first major
upward leg in this bull market ended during the first half of 2008, but
a long-term peak won't occur until 2014-2020. In real (gold) terms,
commodities commenced a secular BEAR market in 2001 that will continue
until 2014-2020.
(Last
update: 09 February 2009)
Copyright
Reminder
The commentaries that appear at TSI
may not be distributed, in full or in part, without our written permission.
In particular, please note that the posting of extracts from TSI commentaries
at other web sites or providing links to TSI commentaries at other web
sites (for example, at discussion boards) without our written permission
is prohibited.
We reserve the right to immediately
terminate the subscription of any TSI subscriber who distributes the TSI
commentaries without our written permission.
Outlook Summary
Market
|
Short-Term
(1-3 month)
|
Intermediate-Term
(6-12 month)
|
Long-Term
(2-5 Year)
|
|
Gold
|
Neutral
(10-Sep-13)
|
Bullish
(26-Mar-12)
|
Bullish
|
|
US$ (Dollar Index)
|
Neutral
(24-Dec-12)
|
Bullish
(01-May-13)
|
Neutral
(19-Sep-07)
|
|
Bonds (US T-Bond)
|
Bullish
(24-Jun-13)
|
Neutral
(18-Jan-12)
|
Bearish |
|
Stock Market
(DJW)
|
Bearish
(15-Jul-13)
|
Bearish
(28-Nov-11)
|
Bearish
|
|
Gold Stocks
(HUI)
|
Neutral
(10-Sep-13)
|
Bullish
(23-Jun-10)
|
Bullish
|
|
Oil |
Neutral
(30-Jul-12)
|
Neutral
(31-Jan-11)
|
Bullish
|
|
Industrial Metals
(GYX)
|
Neutral
(30-Jul-12)
|
Neutral
(29-Aug-11)
|
Neutral
(11-Jan-10)
|
Notes:
1. In those cases where we have been able to identify the commentary in
which the most recent outlook change occurred we've put the date of the
commentary below the current outlook.
2. "Neutral", in the above table, means that we either don't have a
firm opinion or that we think risk and reward are roughly in balance with respect to the timeframe in question.
3. Long-term views are determined almost completely by fundamentals,
intermediate-term views by
fundamentals, sentiment and technicals, and short-term views by sentiment and
technicals.
The start of the dreaded
"taper"
It is widely expected that the Fed will
announce the first step in the reduction of its monetary accommodation in the
policy statement issued at the completion of the FOMC Meeting on Wednesday 18th
September. As far as we can tell, most Fed watchers expect the pace of asset
monetisation to be scaled back from the current $85B/month to somewhere in the
$60B-$75B/month range.
It's noteworthy that the Fed began to tighten its monetary policy in 'baby
steps' starting about one year into the 2003-2007 monetary-inflation-fueled
boom, but here we are, four years into the next monetary-inflation-fueled boom,
and the Fed is a long way from embarking on any sort of genuine tightening.
Instead, the Fed is gingerly planning to reduce the extent of its monetary
easing in 'baby steps'. The obvious conclusion is that the US economy is
becoming increasingly dependent on money-pumping, with stimulus and
price-support programs first preventing existing mal-investments from being
liquidated and then adding new mal-investments into the mix.
To get an inkling of the absurdity of the current US monetary situation, assume
that the Fed does the maximum it is expected to do this week and reduces its
monthly asset monetisation from $85B to $60B. $60B/month of asset monetisation
would still constitute the most aggressive monetary easing in US history apart
from the past 8 months, the 7-month "QE2" period from late-2010 through to
mid-2011, and the period from late-2008 through to mid-2009 during which "QE1"
was in progress. In fact, a Federal Reserve program that involved the creation
of $60B of new money every month would have been unthinkable prior to late-2008.
But now, four years into a so-called economic recovery, many market participants
and commentators are worried that it won't be enough!
The "taper" has been so widely telegraphed that Wednesday's official
announcement shouldn't have a big effect on the financial markets. However, this
week is still likely to be more volatile than usual as short-term traders first
make their bets about what the Fed is going to say/do and how other traders are
going to react, and then reposition in the aftermath of the news.
Fed expansion plus
commercial bank contraction
Although the year-over-year rate of growth in US
True Money Supply (TMS) is still high by historical standards, the following
chart shows that it has just dropped to its lowest level since late-2008.
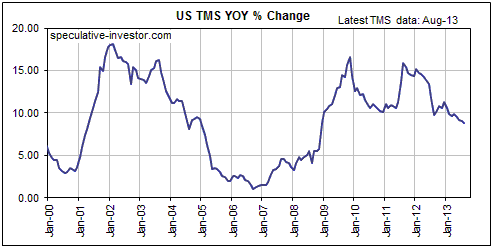
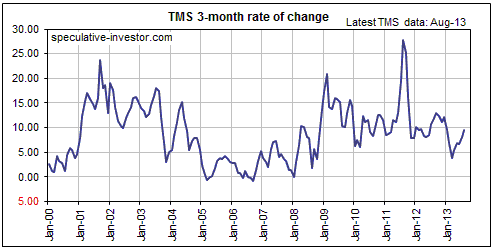
However, it is more likely to rise than fall over the next few months. The
reason is illustrated by the following chart of the annualised 3-month TMS
growth rate. The annualised 3-month rate of US monetary inflation bottomed at
just below 4% in March of this year and has since rebounded to 9.5%.
There are some interesting details behind this year's US TMS statistics. First,
since January of this year there has been almost no net change in US commercial
bank credit and yet the US money supply has risen by about $400B. This tells us
that the rise in the money supply since January of this year was driven almost
totally by the Fed. Second, since the end of April this year there has been a
net contraction of almost $100B in US commercial bank credit while the US money
supply has risen by about $250B. This tells us that the Fed has been responsible
for more than 100% of US money-supply growth over the past four months.
The Fed has directly injected enough new money into the US economy over the past
four months to cause the short-term rate of TMS growth to accelerate upward
despite a credit contraction in the private banking sector, which confirms some
things we already knew. Most notably, it confirms that a) the Fed's QE not only
boosts bank reserves, but also boosts the quantity of money circulating within
the economy (bank reserves are not included in TMS), and b) the Fed is capable
of expanding the US money supply without any help from the commercial banks.
We think there are two main reasons why US commercial banks, as a group, are not
expanding their balance sheets, the first being that the pool of willing and
qualified borrowers has shrunk due to the lacklustre economy and existing high
debt levels.
The second and probably the more important reason for the reticence of
commercial banks to expand credit is that the banks are now far more risk averse
due to having very weak balance sheets. The balance sheets that are made public
generally look fine, but this could be mainly because banks are no longer
required to mark their assets to market in the reports that are made public. We
suspect that a proper marking to market of all bank assets would in many cases
reveal a precarious financial position.
There's no way for us to know for sure, but
balance-sheet weakness would go a long way towards explaining the recent
behaviour of the commercial banking industry. It would explain why banks seem to
be wary about monetising assets such as T-Notes in addition to being wary about
making new loans.
The Stock
Market
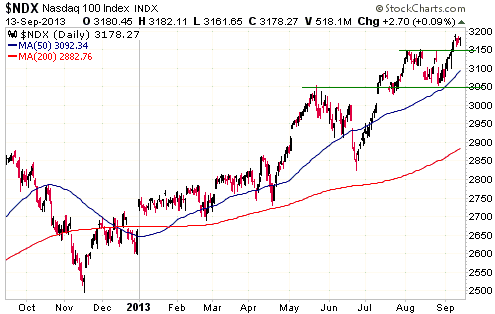
Our stock market outlook is global, not
US-centric. However, our short-term bearish outlook now hinges on the failure of
the US S&P500 Index to confirm the new high for the year recently achieved by
the US NASDAQ100 Index. The relevant charts are displayed below. Consequently,
if the S&P500 removes this non-confirmation by closing above its early-August
high, our short-term stock market outlook will automatically shift to "neutral".
Note that a break to a new high by the S&P500 wouldn't suggest that significant
additional upside was in store. It would just 'muddy the waters'.

This week's
important US economic events
| Date |
Description |
| Monday Sep 16 |
Empire State Mfg Survey
Industrial Production | | Tuesday
Sep 17 |
CPI
TIC Report | | Wednesday
Sep 18 |
FOMC Announcement and Bernanke Press
Conference
Housing Starts | | Thursday
Sep 19 |
Current Account Balance
Existing Home Sales
Philadelphia Fed Survey
Leading Economic Indicators
|
| Friday Sep 20 |
No important events scheduled |
Gold and
the Dollar
Gold
A good example of bad analysis
The article posted
HERE summarises the latest gold-related forecasts of Gold Fields Mineral
Services (GFMS) and contains good examples of what's wrong with the typical
gold-market analysis put out by GFMS and the World Gold Council (WGC). In brief,
here's why.
First, GFMS is forecasting a decline in gold demand and a rise in the gold price
(to the low-$1500/oz area) over the next several months. However, such an
outcome is impossible. As we've explained in the past, the change in the gold
price over a period is the ONLY reliable measure of the change in gold demand
over the same period, with a higher price necessarily implying increased demand
and a falling price necessarily implying reduced demand. In other words, in
order for the price to rise to the low-$1500s, demand will have to rise.
Alternatively, if demand falls then the price will fall. In the gold market it
is simply not possible to have a rising price in parallel with falling demand or
a falling price in parallel with rising demand.
Second, GFMS and many other gold-market analysts continue to begin their
analyses with the ridiculous premise that total gold supply is roughly equal to
annual mine supply plus scrap supply, despite the fact that the sum of annual
mine and scrap supply is no more than 2% of the existing aboveground gold
inventory. They then attempt to determine a demand number that is consistent
with this bogus supply number by adding up the amount of gold flowing to
different sectors of the overall market, as if: 1) volume is an indicator of
demand (it isn't; an increase in volume could be associated with a rise or a
fall in demand), 2) demand can be calculated independently of price (it can't
be), and 3) the 150,000 tonnes or so of aboveground gold can be safely ignored.
As a colleague of ours likes to put it, the analysis is so off-track it's
not even wrong.
Gold and the Fed's "tapering"
In previous commentaries we've covered our reasons for believing that not only
would a "tapering" of the Fed's current QE program not be bearish for the gold
market beyond short-lived psychological effects, but also that additional QE
will not be required for gold to embark on the next upward leg of its long-term
bull market. In summary, our reasoning is:
1) Gold is propelled upward by the negative effects of monetary inflation, not
the monetary inflation itself.
2) The superficial effects of monetary inflation will usually be positive for a
while. That's why the policy is popular. Gold will tend to go out of favour as
long as the superficial positive effects are dominant. There is no way of
knowing, ahead of time, how long this will be.
3) The negative effects of monetary inflation include "price inflation",
excessive risk-taking, reduced saving, and economic weakness stemming from
misdirected investment and reduced saving.
4) Almost regardless of what the Fed does from now on, there has already been
more than enough monetary inflation to ensure that there will be blatant
negative effects in the future. As far as the next year is concerned, negative
effects in the form of economic weakness are likely to become sufficiently
obvious to foster the general belief that the inflation policy has failed.
5) The loss of confidence in the Fed caused by the obvious failure of QE to
bring about genuine economic progress will, in our opinion, be one of the two
driving forces behind the next major advance in the US$ gold price. We expect
the other driving force to be the resumption of the euro-zone debt/banking
crisis.
Current Market Situation
Gold support at $1350 gave way late last week. This increases the probability
that the June low ($1150-$1200) will be tested before the long-term bull
market's next upward leg begins.
We do not think that there is a realistic chance of gold falling further than
the $1150-$1200 range. Sentiment is already 'in the toilet', having not
recovered by much during the July-August price rebound.
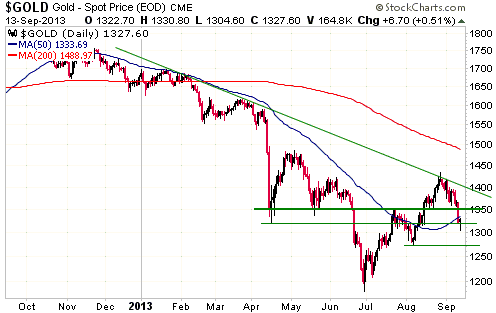
Former support in the $1350s will now act as resistance during rally attempts,
but the most important resistance is clearly the Syria-inspired late-August
price high. A daily close above this level would definitively signal that the
bull market's next upward leg had begun.
Silver
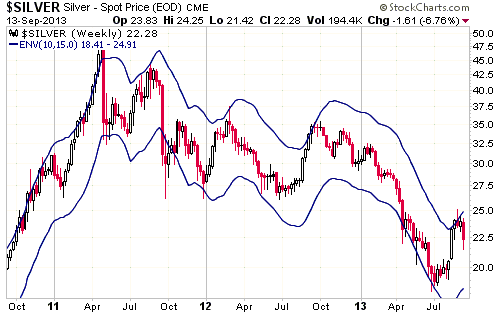
The following weekly silver chart shows the moving-average envelope that usually
limits rallies and declines in the silver market. The silver price only ever
makes a sustained break above this envelope when a major upside blow-off is in
progress, and the silver price only ever trades well below the bottom of this
envelope during a crash. It therefore isn't surprising that the silver price has
reversed lower after trading slightly above the top of its MA envelope during
the second half of August.
The silver/gold ratio moved sharply higher during July-August and had become
very 'overbought' by late-August. It is no longer 'overbought', but has not yet
'corrected' enough to suggest that a new low-risk silver buying opportunity is
at hand.
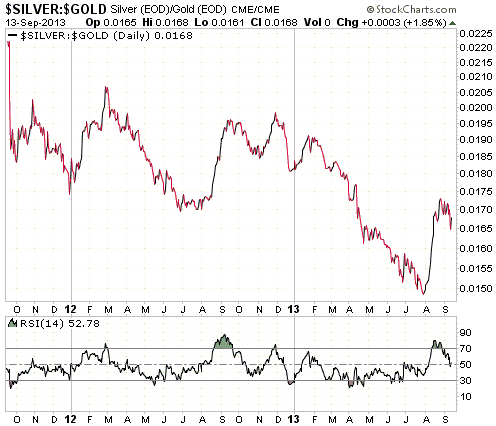
We will continually re-assess as new information becomes available, but we would
probably be buyers of silver at around $20.
Gold Stocks
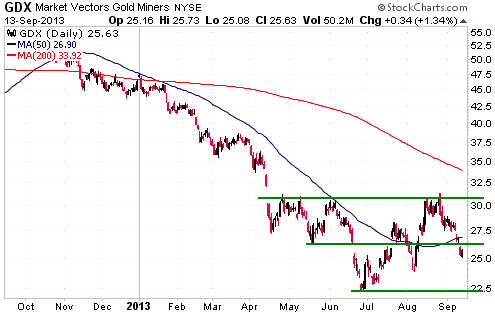
In the 11th September Interim Update we wrote:
"GDX, a proxy for the stocks of large and mid-size gold miners, has dropped
to its 50-day MA and lateral support. This is as low as it can go without
eliminating the second of our two short-term scenarios (a rally to new
multi-month highs in September followed by two months of choppy sideways
trading, as per the 1968-1970 Model). But although the second scenario can't yet
be ruled out, the first scenario (a downward trend to final low during October
or November) is now the favourite."
The following daily chart shows that GDX fell far enough over the final two days
of last week to clearly break below lateral support and its 50-day MA. The
second of our two short-term scenarios can therefore now be ruled out.
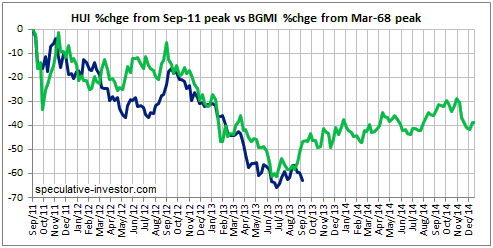
The scenario that has just been eliminated from contention involved the gold
sector continuing to follow the 1968-1970 Model. The next chart shows that until
two weeks ago the HUI appeared to be bottoming in a very similar fashion to the
way the Barrons Gold Mining Index (BGMI) bottomed at the end of the 1968-1970
major correction. The chart also illustrates the divergence that has since
occurred.
In any financial market there will always be a myriad of short-term
possibilities. This is true for the gold sector right now, but the clear-cut
favourite among these possibilities is a major low during October-November (most
likely October). The major October-November low could turn out to be a
successful test of the June low or a new low for the year.
Note that if the gold sector is headed for an October or November low, it is
almost certainly not going to get there in a straight line. Along the way there
will be rebounds lasting at least a few days, one of which is likely to begin
soon.
Unfortunately, of the two short-term scenarios we had identified, the one that
appears to be playing out is the more difficult to trade. It would have made
life easier if the market had given us a better short-term selling opportunity
before providing us with the next general short-term buying opportunity, but, to
use a well-worn analogy, we have to play the hands we are dealt.
We don't like to give pep talks or try to convince anyone to buy/hold any
particular investment. We simply present our analyses and opinions as
objectively as we can. However, if you have stuck with the gold sector through
the major correction of the past two years it seems to us that it would make
sense to stick with it a while longer, because there's a high probability that
this year's low will be followed by a very strong upward trend. If we are right
that gold is still in a bull market then the upward trend should last 3-5 years
(as per 1970-1974 or 1976-1980), but even if our long-term bullish view is wrong
(extremely unlikely, but not impossible) the upward trend should last 6-18
months (as per 1986-1987 or 1993-1994).
Currency Market Update
The two senior currencies still aren't doing much relative to each other. We
think that the US$ is more likely to fall than to rise against the euro over the
coming 1-2 months, but not by much.
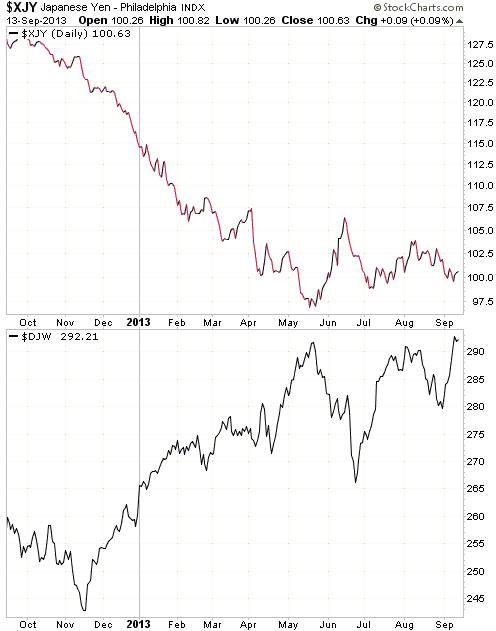
The following chart shows a strong inverse relationship over the past year
between the Yen and the Dow Jones World Stock Index (DJW). This means that
despite "Abenomics", the Yen is still behaving like a safe-haven currency. It
also means that the next significant Yen rally will likely coincide with the
next significant stock market decline. We expect that both will soon begin.
Update
on Stock Selections
Notes: 1) To review the complete list of current TSI stock selections, logon at
http://www.speculative-investor.com/new/market_logon.asp
and then click on "Stock Selections" in the menu. When at the Stock
Selections page, click on a stock's symbol to bring-up an archive of
our comments on the stock in question. 2) The Small Stock Watch List is
located at http://www.speculative-investor.com/new/smallstockwatch.html
 Company
news/developments for the week ended Friday 13th September 2013: Company
news/developments for the week ended Friday 13th September 2013:
[Note: FS = Feasibility Study, IRR = Internal Rate of Return, MD&A =
Management Discussion and Analysis, M&I = Measured and Indicated,
NAV = Net Asset Value, NPV(X%) = Net Present Value using a discount
rate of X%, P&P = Proven and Probable, PEA = Preliminary Economic
Assessment, PFS = Pre-Feasibility Study]
*Almaden Minerals (AAU) reported drilling results from its
Tuligtic gold-silver project in Mexico. The 2013 drill program is
focused on expanding the known resource (3.6M gold-equivalent
ounces) adjacent to the current resource shell and within what is
considered a potential pit shell.
The reported results were good and will almost certainly contribute
to a positive resource update in the future. The best result came
from Hole TU-13-295, which intersected 98 metres of 1.1 g/t
gold-equivalent and 33.78 metres of 4.4 g/t gold-equivalent.
*Pilot Gold (PLG.TO) reported another set of drilling results from
the KCD target at its TV Tower project in Turkey. The KCD target
contains a near-surface silver zone and a deeper/higher-grade gold
zone.
Of the latest batch of drilling results, the most significant was a
step-out hole that extended the silver zone. This hole intersected
90.2 g/t silver over 91.5 metres.
This year's drilling of the KCD target is almost complete, but there
will be plenty of news from PLG over the months ahead due to a) the
drilling of other targets at TV Tower, b) the new drilling program
underway at the Kinsley Mountain project in Nevada, and c) an
initial resource estimate for the KCD target.
*Pretium Resources (PVG) issued drilling results and an update on
the progress of its Bulk Sample Program (BSP). As usual for this
company, some spectacular gold intercepts were announced. For
example, results from recent underground drilling associated with
the BSP included 1,622 grams of gold over 6.25 metres and 9,900
grams of gold over 0.50 metres.
The excavation of material for the 10,000-tonne bulk sample is
complete and drilling related to the BSP (a total of 202 holes for
16,500m) will be complete by mid-September. The bulk sample material
will be transported to Montana for milling over the next two months,
after which Strathcona (PVG's consultant) will analyse all the
results and compile its report. Strathcona's report on the BSP is
now expected early next year, or 1-2 months later than previously
envisaged. Between now and when Strathcona's BSP report is
published, we think that PVG will trade like a leveraged play on the
overall gold sector.
*Ramelius Resources (RMS.AX) had three pieces of significant news.
First, the company updated the market on its progress. In
particular, it announced that a) gold production at its Mt Magnet
mine is expected to be 18,000 ounces during the current (September)
quarter and 21,000-23,000 ounces during the December quarter, and b)
initial gold production from the new Coogee mine is expected to be
5,000 ounces during the December quarter. RMS is therefore
forecasting gold production of around 45K ounces during the second
half of this year. If this forecast is achieved it will be a good
result.
Second, RMS advised that it was raising up to A$16M via a pro-rata
(1-for-4) rights issue. Shareholders with registered addresses in
Australia or New Zealand will be eligible to purchase one new share
at A$0.18 for every four existing shares.
It will probably make sense for RMS shareholders with Australia/NZ
addresses to take advantage of this rights issue IF the stock price
is at or above A$0.18 near the scheduled closing date of the issue,
but since the scheduled closing date is about 5 weeks away (21st
October) there is no need to make an immediate decision. Looking at
the situation from a different angle, if you are an eligible
shareholder with a desire to add to your exposure then you now know
that you will be able to do so at no higher than A$0.18/share up
until 21st October. Therefore, you could reasonably decide to hold
off on any new buying unless the shares become available on the
market at well below A$0.18.
Note: A pro-rata below-the-market rights issue is the fairest way
for a company such as RMS to raise money, because it enables
existing shareholders to avoid having their stakes diluted.
Third, RMS issued its annual Resources and Reserves Statement. The
company's total gold resource is now 2.55M ounces (1.65M ounces M&I
plus 0.9M ounces Inferred), which represents a small decline over
the past 12 months.
 Candidates
for new buying Candidates
for new buying
As a result of last week's price action many TSI gold stocks are now at levels
at which some buying could make sense. However, due to increased probability
that the gold sector is headed for an October low, we have narrowed-down our
list of the best candidates for new buying to only three stocks.
From within the ranks of TSI stock selections, the best candidates for new
buying at this time are:
1) EDV.TO at around C$0.70 (last Friday's closing price: C$0.73)
2) PVG below US$7.50 (last Friday's closing price: US$7.45)
3) RIO.TO/RIOM (last Friday's closing price: C$2.16/US$2.07)
 TSI
stocks affected by upcoming changes to indexes and ETF holdings TSI
stocks affected by upcoming changes to indexes and ETF holdings
A quarterly index and ETF re-balancing is scheduled to take effect after the
close of trading on Friday 20th September. As far as we can tell, this will
affect TSI stock selections as follows:
1) Almaden (AMM.TO) and Golden Star (GSC.TO) will be deleted from the S&P/TSX
Small Cap Index. This will result in some additional selling pressure in these
stocks on 20th September.
2) Rio Alto (RIO.TO) will be added to the S&P/TSX Small Cap Index. This will
result in some additional buying pressure in this stock on 20th September.
3) We haven't been able to confirm that this change will definitely happen, but
new rules put in place by the index that the Gold Miners ETF (GDX) attempts to
track could result in Golden Star (GSS/GSC) being fully or partially removed
from GDX at the end of this week. If this change does happen it will result in
significant additional selling pressure in Golden Star shares.
The above-mentioned changes could lead to good buying opportunities in AAU/AMM.TO
and GSS/GSC.TO near the end of trading on Friday 20th September.
Chart Sources
Charts appearing in today's commentary
are courtesy of:
http://stockcharts.com/index.html

|

