![]()
![]()
![]()
![]()
-- Weekly Market Update for the Week Commencing 16th October 2017
Big Picture
View
Here is a summary of our big picture
view of the markets. Note that our short-term views may differ from our
big picture view.
The BULL market in US Treasury Bonds that began in the early 1980s ended in mid-2016, but there will be many years of topping action in bond prices and bottoming action in bond yields before major new trends get underway. A major decline in government bond prices will unfold during the 2020s. (Last update: 11 September 2017)
The stock market, as represented by the S&P500 Index, commenced a secular BEAR market during the first quarter of 2000, where "secular bear market" is defined as a long-term downward trend in valuations (P/E ratios, etc.), gold-denominated prices and inflation-adjusted prices. This secular trend will bottom in 2020 or later. (Last update: 11 September 2017)
A cyclical BEAR market in the US Dollar began in 2016-2017. (Last update: 11 September 2017)
Gold commenced a secular bull market relative to all fiat currencies, the CRB Index, bonds and most stock market indices during 1999-2001. This secular trend will peak in 2020 or later. (Last update: 11 September 2017)
Commodities,
as represented by the CRB Index, commenced a
secular BULL market in 2001 in nominal dollar terms. The first major
upward leg in this bull market ended during the first half of 2008, but
a long-term peak won't occur until 2020 or later.
(Last
update: 11 September 2017)
Copyright
Reminder
The commentaries that appear at TSI
may not be distributed, in full or in part, without our written permission.
In particular, please note that the posting of extracts from TSI commentaries
at other web sites or providing links to TSI commentaries at other web
sites (for example, at discussion boards) without our written permission
is prohibited.
We reserve the right to immediately
terminate the subscription of any TSI subscriber who distributes the TSI
commentaries without our written permission.
True
Fundamentals Summary
[Notes:
1) The date shown next to the current True Fundamentals Model (TFM) signal is
when the most recent change occurred. 2) Charts of the Gold and Equity
TFMs are included in the "Charts and Indicators" section of the TSI web
site]
| Market | True Fundamentals Model (TFM) |
| Gold (US$ Price) | Bullish (13 Oct 2017) |
| US Equity (SPX) | Bullish (25 Sep 2017) |
| Currency (Dollar Index) | Bearish (19 May 2017) |
| Commodities (GNX) | Bullish (05 May 2017) |
Last week's posts at the TSI Blog
Blatant statistical bias: Gun ownership vs. gun deaths
Updating gold's true fundamentals
Summary of current
thinking/positioning
1) Neutral while awaiting
clearer signals on the short-term prospects for gold and the associated
mining indices.
2) With the stock market having got through the
bulk of a risky seasonal period with minimal volatility, no longer
anticipating a tradable short-term decline.
3) Looking for
opportunities to increase exposure to industrial-commodity (base metals,
O&G) stocks.
4) Expecting the Dollar Index to resume its rebound
following a brief consolidation.
5) Anticipating significant
additional short-term weakness in the commodity currencies (the C$ and the
A$).
6) Thinking that the T-Bond has commenced an intermediate-term
decline and that rebounds should be viewed as opportunities to expand a
bearish position.
7) Maintaining a cash reserve of about 35%.
The US monetary
inflation rate continues to plunge
The Fed's monetary data for
September indicate that the year-over-year rate of growth in US True Money
Supply (TMS) has dropped to only 3.3%. This is the lowest since
April-2007, meaning that it's a 10-year low. As recently as last November
it was in double digits, so the decline has been steep. Here's the
relevant chart:
According to our theory, the plunge in the US monetary inflation rate
to a low level won't pose a major threat to asset prices or the global
economic boom as long as it is offset by rapid monetary inflation in the
euro-zone. Up until now it has been, but only just.
The ECB's
monetary data for September won't be available until late October, at
which time we'll find out if euro-zone monetary inflation is still
sufficient to offset the decline in US monetary inflation.
The T-Bond has
rebounded. What now?
The iShares 20+ Year Treasury
ETF (TLT), our favourite proxy for long-dated US Treasury securities, has
rebounded from an early-October low near its 200-day MA to slightly below
its 50-day MA. This could mean that the expected counter-trend rally is
complete and that a decline to a new multi-month low is about to begin,
but it's also possible that the rebound is only about half complete and
that some consolidation within the coming week or two will be followed by
an extension to the vicinity of the early-September high. Each of these
possibilities would be consistent with our intermediate-term bearish
outlook for this market.
We can't possibly know whether TLT's rebound is complete, but we do
know that last week's price action has created a better opportunity to buy
TBT (a leveraged fund that moves in the opposite direction to TLT) than
existed a week earlier. We suggest averaging into TBT during periods of
short-term T-Bond strength over the remainder of this year in preparation
for a large T-Bond decline during the first half of next year.
As
well as being a reasonable speculation in its own right, anyone with
significant exposure to gold could view a bet against the T-Bond as a
hedge against gold-price weakness. The reason is that at a time when US
inflation expectations are stable the US$ gold price will tend to move in
the same direction as the T-Bond price (in the opposite direction to
long-term interest rates). This relationship is evidenced by the following
chart comparison of the US$ gold price and TLT.
Commodities
Cost of the futures roll
Here's a chart of the natural gas (NG) continuous futures price
covering the past 8 years and 2 months. This time span was chosen because
it is a long period during which the NG price essentially went nowhere (8
years and 2 months ago the NG price was roughly the same as it is today).
Now, here's a chart of
UNG (the United States Natural Gas Fund) covering the same period. UNG
is an ETF that invests in NG futures.
The eagled-eyed will spot a difference between the above charts. The
difference, in a nutshell, is that a fund that invests in NG futures lost
about 93% of its value over a period in which the NG futures price was
unchanged.
Here's a chart that illustrates the extent to which UNG
has underperformed the commodity it is supposed to be tracking.
Part of UNG's relatively poor performance can be explained by the
fund's expenses, but the total expense ratio is only 1.27% and a 93% loss
over slightly more than 8 years equates to a compounded loss of about 30%
per year. The cost of managing the fund therefore explains almost nothing.
Almost all of the underperformance is due to the futures roll. In
other words, the price of UNG has been in a relentless downward trend
relative to the price of the underlying commodity due to the ETF's regular
requirement to roll from an expiring futures contract into the next
available contract. In the US natural-gas futures market it is normal for
the next contract to be priced at a premium to the expiring contract, so
UNG is having to consistently sell low and buy high.
UNG's
performance is an extreme example of what will happen to any ETF that
holds futures contracts* in a market that is usually in short-term
contango (nearer contracts cheaper than more distant contracts). An even
more extreme example is VIXY, a fund that holds Volatility Index futures
contracts. It is still possible to make money by going long such funds,
but the timing of both entry and exit has to be very accurate.
If
you own a commodity futures ETF at a time when the underlying market is in
short-term backwardation (nearer contracts priced higher than more distant
contracts) then the futures roll will work in your favour, because when
the ETF does 'the roll' it will be selling at a higher price than it is
buying. However, most commodity futures markets are in contango most of
the time.
*This issue does not apply to
commodity ETFs that hold the physical commodity.
Natural Gas
The NG price has done worse than we thought it
would during this year to date. Instead of adding to the gains achieved
during March-December of last year it has oscillated within a contracting
range.
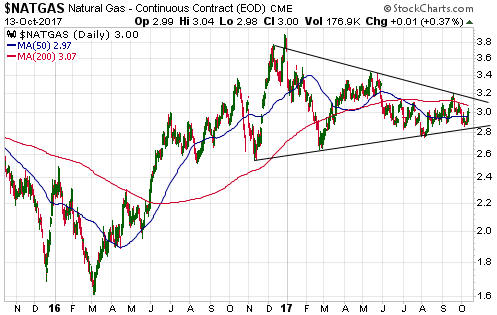
We don't have a strong opinion on what will happen to the NG price
over the months ahead. The price pattern is neutral and the amount of NG
in storage (see chart below) is close to its 5-year average for this time
of the year, so the supply situation is also neutral. All we can say is
that a daily close above $3.20 would suggest that an intermediate-term
rally had begun and that a daily close below $2.75 would warn of
significant downside potential.
At this time our only exposure to natural gas is via a long-term
position in Petrus Resources (PRQ.TO), a junior Canadian NG producer.
Although PRQ's stock price has performed similarly to the NG price during
this year to date and although the company would benefit from a higher NG
price, we don't expect the stock price to consistently track short-term
moves in the commodity price.
The Grains
In 2016 the prices of soybeans,
corn and wheat made 5-year lows. They rallied from those lows and then
gave back the bulk of their gains. In each case, the decline to a higher
low could be part of a long-term basing process. After the long-term base
comes the new multi-year upward trend.
Here are the relevant
charts:
Exposure to "the grains" can be obtained via JJG or GRU -- ETNs that
track indices comprising soybean, corn, wheat and soybean-oil futures. The
tracked indices are adversely affected by the "futures roll", which is why
the ETNs recently made new bear-market lows. However, the effect of the
"futures roll" is not as pronounced with JJG and GRU as it is with UNG.
Here's a chart of GRU:
The Stock Market
Nothing matters except
the story
This year has been difficult for anyone
employing a value-oriented approach to selecting stocks and other assets,
because it seems that nothing has mattered except the story. In general,
investors (using the word as loosely as possible) have flocked to assets
with interesting stories regardless of valuation and have ignored assets
that by traditional measures offer good value.
Examples are easy to
find within all sectors of the stock market. They include:
1)
Shopify (SHOP), a loss-making e-commerce company that trades at 18-times
revenue and 450-times next year's imagined profit. E-commerce is great for
consumers and makes for an enticing story due to the potential growth, but
it tends to be either a low-margin or a no-margin business. Just look at
Amazon.com (AMZN). Rarely has any company dominated an industry the way
that AMZN dominates on-line shopping, and yet its on-line shopping
business has never been consistently profitable. But who cares about
profits when the story is exciting!
2) Tesla (TSLA), the manufacturer of electric cars and batteries.
Great product, great story, terrible business. It's likely that within
five years TSLA will declare bankruptcy or get bought at a low price by
another car manufacturer, but that hasn't prevented 'investors' from
valuing the company at about 12 times book value.
TSLA's price
chart is beginning to look bearish, so perhaps in this case reality is
about to strike.
3) Novo Resources (NVO.V), an early-stage gold miner exploring a large
land package in the northern part of Western Australia. This company is
yet to discover anything substantial, but it is being valued by the stock
market at C$1.1 billion due to an appealing story (the story that it
might, just might, discover something big).
4) Garibaldi Resources (GGI.V), an early-stage minerals explorer that
was trading below C$0.20/share three months ago and on Friday 13th October
traded as high as C$4.20. The reason for the 2500% price increase? A good
story! The company is yet to report its first drill result, but there's
the possibility that it might, just might, have discovered something
valuable.
However, the best examples of nothing mattering except the story are
to be found outside the stock market. We are referring to Bitcoin and the
hundreds of other cryptocurrencies that have been assigned high
valuations.
Assigning high valuations to good stories regardless of
valuation is evidence of a mania. The vast majority of these stories will
end up worthless, but speculators should keep in mind that in the
short-term there is more money to be made by going long the good stories
than accumulating assets that offer good value.
Current
Market Situation
There is often a volatility spike during
the September-October period. This year, however, not only has there been
no volatility spike to speak of during this period to date, there has been
an uncommon lack of volatility. This is evidenced by the VIX having just
spent 5 weeks oscillating between 9.0 and 10.5.
Most stock indices
are now short-term 'overbought', not just in the US but throughout the
world. However, the warning signs that were apparent during August and the
first half of September have since disappeared.
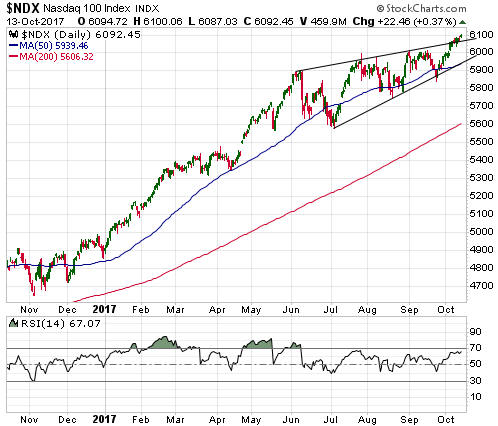
At the start of
last week one of the remaining reasons to anticipate a significant
short-term decline was the precarious position of the NASDAQ100 Index
(NDX). We are referring to the fact that a week ago this influential index
was poised at the top of its 'rising wedge'. That's no longer an issue,
though, because the NDX broke through the top of its 'wedge' last week
(see chart below). There could be a breakout failure this week, but as
things stand today there is nothing in the price action to suggest that
anything more bearish than a routine pullback is about to happen.
A 1-2 week pullback to address the 'overbought' condition could begin
at any time, but a larger decline does not appear to be in the offing.
This week's
significant US economic events
[Notes:
1) The most important events
(to the markets) are shown
in bold. 2) A list of global economic events can be found
HERE]
| Date | Description |
| Monday Oct-16 | Treasury Budget |
| Tuesday Oct-17 |
Import and Export Prices Housing Market Index Industrial Production TIC Report |
| Wednesday Oct-18 |
Housing Starts Beige Book |
| Thursday Oct-19 | Philadelphia Fed Business Outlook Survey |
| Friday Oct-20 | Existing Home Sales |
Gold and the Dollar