|
-- Weekly Market Update for the Week Commencing 16th December 2013
Big Picture
View
Here is a summary of our big picture
view of the markets. Note that our short-term views may differ from our
big picture view.
In nominal dollar terms, the BULL market in US Treasury Bonds
that began in the early 1980s will end by 2013. In real (gold)
terms, bonds commenced a secular BEAR market in 2001 that will continue
until 2014-2020. (Last
update: 23 January 2012)
The stock market, as represented by the S&P500 Index,
commenced
a secular BEAR market during the first quarter of 2000, where "secular
bear market" is defined as a long-term downward trend in valuations
(P/E ratios, etc.) and gold-denominated prices. This secular trend will bottom sometime between 2014 and 2020.
(Last update: 22 October 2007)
A secular BEAR market in the Dollar
began during the final quarter of 2000 and ended in July of 2008. This
secular bear market will be followed by a multi-year period of range
trading.
(Last
update: 09 February 2009)
Gold commenced a
secular bull market relative to all fiat currencies, the CRB Index,
bonds and most stock market indices during 1999-2001.
This secular trend will peak sometime between 2014 and 2020.
(Last update: 22 October 2007)
Commodities,
as represented by the Continuous Commodity Index (CCI), commenced a
secular BULL market in 2001 in nominal dollar terms. The first major
upward leg in this bull market ended during the first half of 2008, but
a long-term peak won't occur until 2014-2020. In real (gold) terms,
commodities commenced a secular BEAR market in 2001 that will continue
until 2014-2020.
(Last
update: 09 February 2009)
Copyright
Reminder
The commentaries that appear at TSI
may not be distributed, in full or in part, without our written permission.
In particular, please note that the posting of extracts from TSI commentaries
at other web sites or providing links to TSI commentaries at other web
sites (for example, at discussion boards) without our written permission
is prohibited.
We reserve the right to immediately
terminate the subscription of any TSI subscriber who distributes the TSI
commentaries without our written permission.
Outlook Summary
Market
|
Short-Term
(1-3 month)
|
Intermediate-Term
(6-12 month)
|
Long-Term
(2-5 Year)
|
|
Gold
|
Neutral
(04-Nov-13) |
Bullish
(26-Mar-12) |
Bullish
|
|
US$ (Dollar Index)
|
Bullish
(11-Dec-13) |
Neutral
(18-Sep-13) |
Neutral
(19-Sep-07) |
|
Bonds (US T-Bond)
|
Bullish
(11-Dec-13)
|
Neutral
(18-Jan-12)
|
Bearish |
|
Stock Market
(DJW)
|
Bearish
(11-Dec-13)
|
Bearish
(28-Nov-11) |
Bearish
|
|
Gold Stocks
(HUI)
|
Neutral
(04-Nov-13) |
Bullish
(23-Jun-10) |
Bullish
|
|
Oil |
Neutral
(30-Jul-12) |
Neutral
(31-Jan-11) |
Bullish
|
|
Industrial Metals
(GYX)
|
Bearish
(06-Nov-13) |
Bearish
(13-Nov-13) |
Neutral
(11-Jan-10) |
Notes:
1. In those cases where we have been able to identify the commentary in
which the most recent outlook change occurred we've put the date of the
commentary below the current outlook.
2. "Neutral", in the above table, means that we either don't have a
firm opinion or that we think risk and reward are roughly in balance with respect to the timeframe in question.
3. Long-term views are determined almost completely by fundamentals,
intermediate-term views by
fundamentals, sentiment and technicals, and short-term views by sentiment and
technicals.
Monetary Inflation Update
The US
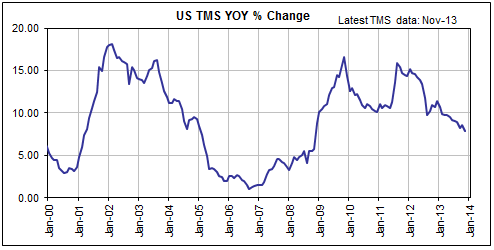
Despite the Fed's efforts, the year-over-year (YOY) rate of growth in US True
Money Supply (TMS) has just dipped below 8% for the first time since
November-2008. The situation is illustrated below.
Why is the Fed's creation of around $85B of new money every month being
accompanied by a decline in the US monetary inflation rate?
Although we can't be certain of the reason, we can come up with a plausible
answer to the above question. The answer begins with the recognition that the
growth in the US money supply over any period will roughly equal the net
quantity of dollars added by the Fed plus the net quantity of dollars added by
the private banks minus the net quantity of dollars flowing out of the US.
Over the past 12 months, the Fed has added about $1T of new money via its debt
monetisation and the US True Money Supply has increased by about $700B. As per
the formula mentioned in the above paragraph, this means that about $300B must
have been subtracted from the US money supply by the combination of
deposit-reduction on the part of US-based private banks and money flowing out of
the US.
The private banking industry has done very little deposit-creation over the past
12 months, but we doubt that it has taken steps to reduce its collective deposit
base. Therefore, the most likely reason for the TMS increase of the past 12
months being about $300B less than the amount of new money created by the Fed is
the transfer of a few hundred billion dollars from the US to other countries.
Considering the performances of stocks, bonds and currencies around the world,
most of the money probably ended up in Europe (the euro-zone, the UK and
Switzerland).
The approximately 8% rate of US monetary inflation of the past 12 months is
still on a high side by long-term historical standards, but the US bubble
economy of the present day probably can't tolerate a more normal rate of
money-supply growth. As a consequence, some sort of economic unravelling is a
distinct possibility for 2014. Also as a consequence, the Fed's next move might
be to ramp up, rather than to "taper", its 'monetary accommodation'.
Japan
As explained in previous TSI commentaries, the 'great Yen inflation' instigated
by the Bank of Japan (BOJ) earlier this year has actually been far from great
and hasn't, up until now, altered the strong seasonal tendencies of Japan's
money supply.
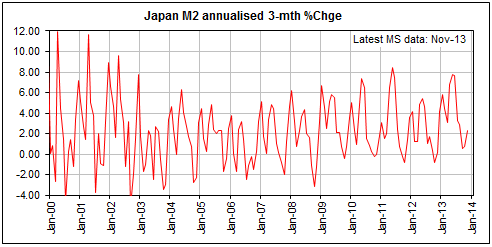
As illustrated by the first of the following charts, the annualised 3-month rate
of change in Japan's M2 money supply rose to a May peak and then fell to a
September-October trough, as it almost always does. This year's main differences
in the behaviour of the annualised 3-month M2 growth rate are that the May peak
was a little higher than average and the September-October trough was just above
zero rather than just below zero.
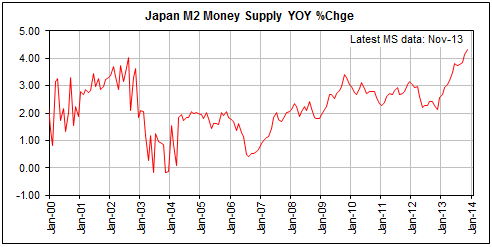
As illustrated by the second of the following charts, the aforementioned
differences have resulted in the 12-month rate of change in Japan's M2 money
supply reaching its highest level in at least 14 years. Note, though, that what
constitutes a 14-year high for Japan's monetary inflation rate would be in the
bottom quartile of the US monetary inflation rate's 14-year range.
The gap is narrowing, but the monetary inflation differential, the most
important long-term exchange-rate influence, remains decisively bullish for the
Yen relative to the US$.
Various
Here's what's happening on the monetary inflation front in some other countries:
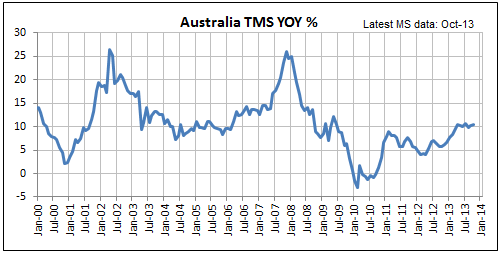
1) Australia's YOY TMS growth rate has flatlined at around 10% over the past 7
months, which is close to the mid-point of the 14-year range and about 2% above
the current US monetary inflation rate.
The fact that Australia's monetary inflation rate has oscillated around an
average of 10% over the past 14 years explains why Australia has an obvious
inflation problem, with prices having risen rapidly throughout the economy for
many years. The fact that the monetary inflation rate remains near 10% tells us
that the inflation problem is going to get worse, and the fact that the A$'s
rapid loss of domestic purchasing power has not yet been reflected in the
foreign exchange rate suggests that the decline in the A$/US$ rate has a long
way to go.
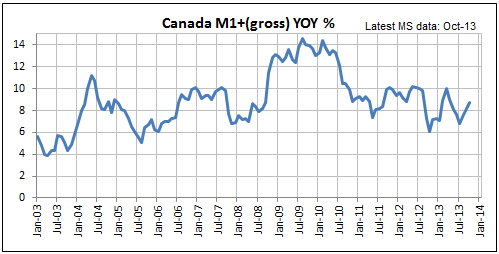
2) The YOY growth rate of Canada's M1+ money supply (the M1+ aggregate reported
by the Bank of Canada is a reasonable proxy for TMS) peaked at just above 14% in
early 2010. Over the past three years it has oscillated within the 6%-10% range
and was 8.7% at the end of October-2013 (the latest month for which data are
available).
As is the case with Australia and many other countries, Canada's money supply
has grown fast enough over many years to create an inflation problem (most
obvious in the real estate market). Considering the recent money-supply data,
the problem looks set to get worse.
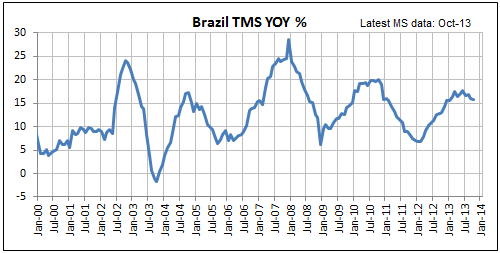
3) Brazil's central bank has been hiking interest rates over the past two years
in an effort to reduce the country's inflation problem. The interest rate hikes
have put irresistible downward pressure on Brazil's stock market, but with the
following chart showing that Brazil's TMS grew by more than 15% over the past 12
months they clearly haven't been effective in dealing with the root cause of the
inflation problem. The problem is therefore destined to get worse, leading to
additional currency and economic weakness.
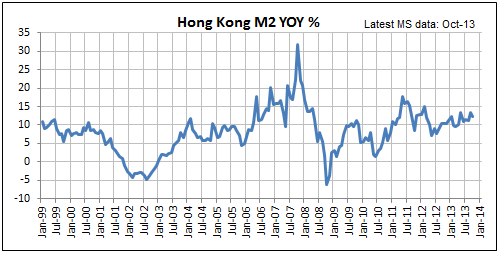
4) Hong Kong probably has the most blatant inflation problem in the developed
world, but the Hong Kong monetary authority continues to add fuel to the
inflation fire by maintaining a near-zero official interest rate and
double-digit money-supply growth. This policy-stupidity is necessitated by the
desire to maintain the HK dollar's totally inappropriate peg to the US$.
We are amazed by how long it is taking for Hong Kong's policy-makers to come to
their senses. The US$ peg must either go or be changed in a way that results in
a large increase in the HK dollar's exchange rate.
Copper Update
The copper price broke out to the downside in
November, but there was very little follow-through and the price has since moved
back up to near the top of its 6-month range. Copper's resilience is surprising.
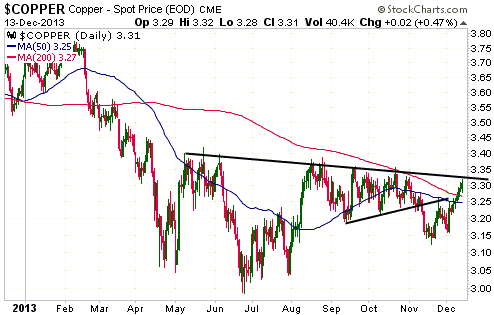
There's a good chance that prior to the completion of its cyclical bear market
the copper price will break below long-term support at $3.00 and drop to the
mid-$2 area or lower. However, one realistic possibility, given the recent price
action, is that there will be a rally to as high as $3.80 prior to the start of
the market's final downward leg. A solid break above $3.35 would suggest that
such a rally was underway.
Our short-term outlook for industrial metals will shift from "bearish" to
"neutral" if copper achieves a daily close above $3.35.
The Stock
Market
The US Market
The S&P500 Index (SPX)
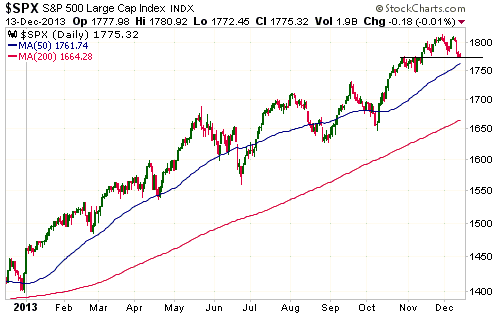
By the thinnest of margins, the SPX managed to hold support at 1775 last week.
It therefore hasn't yet signaled that a short-term top is in place.
Due to sentiment (the Investors Intelligence Bull/Bear ratio made a new 25-year
high last week) and the cyclical bull market's advanced age (the bull is now
three months shy of its 5th birthday), there's a high risk that a short-term top
will evolve into a long-term top. However, before we start getting enthused
about the possibility that a long-term top is in place, we need to get evidence
that a short-term top is in place. A daily close below 1775 would be the first
sign, while a weekly close below 1775 would be a more definitive sign.
As discussed in last week's Interim Update, the level at which the SPX ends this
month could be telling. The reason is that it is rare for the US stock market to
not achieve a net gain during the month of December, especially when the market
has been strong over the course of the year.
We point out that over the past 10 years the only 'down' December occurred in
2007. It was only a small decline, but it was a warning of the much greater
decline to come. We also point out that seasonal forces are decisively bullish
over the next 2-3 weeks, which is another reason that even a small amount of
weakness at this time could be significant.
A failure by the SPX to end this year at 1806 (its November close) or higher
could therefore be ominous, whereas closing out the month of December below 1775
would almost certainly be ominous.
Sector ETFs that are in interesting positions
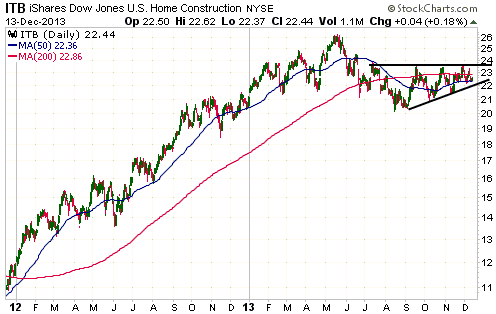
ITB, the iShares Home Construction ETF, made an intermediate-term top in May and
has consolidated since making a short-term bottom in August. As illustrated
below, the consolidation range is narrowing. We are therefore likely to get a
breakout, one way or the other, within the next three weeks.
A break above $24 would indicate that the May-December price action was a
routine intermediate-term correction for the US home construction sector, while
a break below $21.50 would suggest that a major decline began last May.
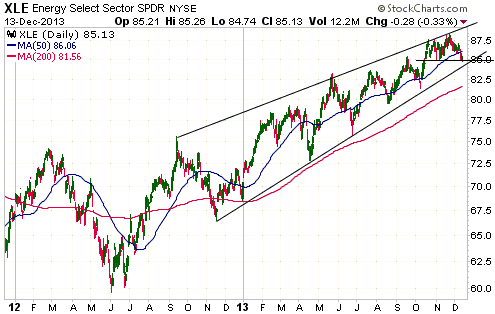
XLE, the Energy ETF, is a proxy for the only commodity-related stocks that had
satisfactory performance over the past two years (the oil and gas stocks).
A daily close below $84 would be an early warning that XLE's intermediate-term
upward trend had ended. Consecutive daily closes below the 200-day MA (currently
at $81.56) would be a more conclusive warning of an intermediate-term trend
reversal.
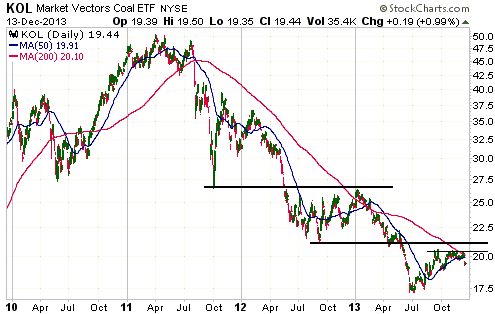
A few months ago we mentioned that the coal sector of the stock market, as
represented by KOL, would be a reasonable long-side speculation due to how
depressed this sector had become in dollar terms and relative to the oil-and-gas
sector. KOL subsequently gained about 10%, but didn't show enough strength to
suggest that its major trend had reversed upward and now appears to be resuming
its long-term decline.
A daily close above the high of the past two months would be an early warning of
an important trend reversal (from down to up), while a solid break above
intermediate-term resistance at $21.50 would be a more definitive reversal
signal.
Bear Funds
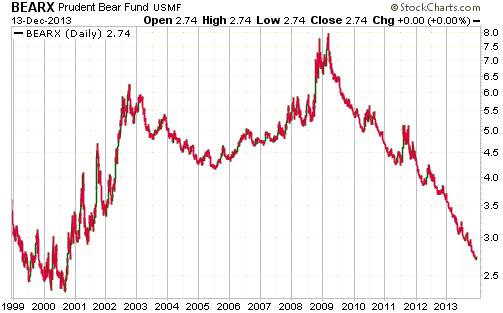
The Prudent Bear Fund (BEARX) is a conservative way to bet against the US stock
market. This actively-managed bear fund tends not to move by much from day to
day, but based on its long-term history (see chart below) is likely to rise by
at least 100% from its bull-market low point to its bear-market high point.
BEARX was recently added to the TSI Stocks List and will remain there as long as
the SPX ends the year below 1806.
This week's
important US economic events
| Date |
Description |
| Monday Dec 16 |
Empire State Mfg Survey
Q3 Productivity and Costs (revised)
TIC Report
Industrial Production | | Tuesday
Dec 17 |
CPI
Q3 Current Account
Housing Market Index | | Wednesday
Dec 18 |
FOMC Meeting Announcement, FOMC Forecasts,
Bernanke press conference
Housing Starts | | Thursday
Dec 19 |
Philadelphia Fed Survey
Existing Home Sales
Leading Economic Indicators
|
| Friday Dec 20 |
Expiry of December futures and options |
Gold and
the Dollar
Gold
Nothing has changed in the gold market since we wrote the following in last
week's Interim Update:
"Getting above resistance in the $1320s would provide conclusive evidence of
a trend reversal, but considering the extent to which the gold market is
'oversold', the extremely depressed sentiment, the length of the preceding
decline and the time of the year, we would interpret consecutive daily closes
above $1280 as confirmation that a sustainable upward reversal had occurred.
Our short-term gold market outlook will automatically shift to "bullish"
following consecutive daily closes above $1280 or following a shift to "bullish"
in our short-term gold-stock outlook (as discussed below)."
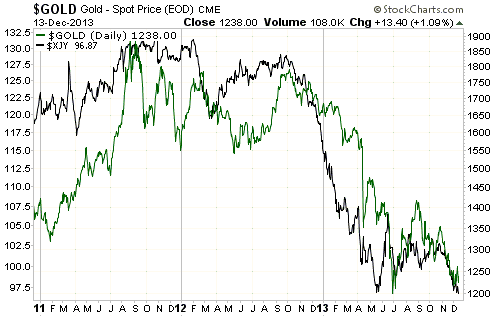
The daily chart displayed below shows the positive correlation between gold and
the Yen over the past three years. We don't think that there has been a direct
causal relationship between these two markets, meaning it's unlikely that gold
has driven the Yen or that the Yen has driven gold. Instead, we think that both
the Yen and gold have reacted in the same way to changes in the common belief
regarding the benefits of monetary inflation. In particular, both gold and the
Yen began their respective large declines during the final quarter of 2012 when
the belief began to take hold that monetary inflation would generate
real/sustainable economic progress in both the US and Japan. Although the belief
is false, it has undoubtedly played a big role in the financial markets over the
past 14 months.
Chances are that gold and the Yen will reach major lows at around the same time,
with this month being the most likely time for such lows. That being said, our
confidence that gold is very close to a major low is greater than our confidence
that the Yen is very close to a major low. The reason is that gold's supply is
essentially fixed, whereas it is technically possible for the Bank of Japan to
substantially increase the Yen supply.
Gold Stocks
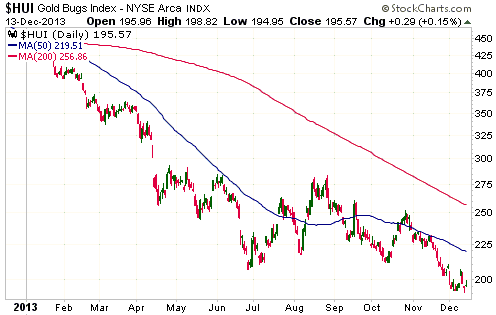
On a daily closing basis both the HUI and the XAU held above their 6th December
lows last week, keeping alive the possibility that the bear-market bottom
coincided with the 3-year anniversary of the XAU's bull-market top. However,
there is no evidence in the price action that a reversal has occurred. This
means that although a major low is probably very close in terms of both price
and time, it is probably not in place yet.
The following excerpt from last week's Interim Update remains applicable:
"Considering the price action, the time of the year and our belief that the
ultimate low is close at hand if not already in place, our short-term gold-stock
outlook will automatically shift to "bullish" if both the HUI and the XAU
achieve daily closes above their 11th December intra-day highs (207 and 86.6).
This would constitute enough additional strength to suggest that an important
upward reversal had, indeed, coincided with the 3-year anniversary of the XAU's
major high."
Currency Market Update
The Australian Dollar (A$) is testing intermediate-term support defined by its
August low. There is a risk that a near-term break below this support will
generate another wave of speculative selling, quickly resulting in a few points
of additional downside. However, it's more likely that the support will hold for
now.
Our expectation is that the A$ will work its way down to the 70s in fits and
starts over the coming two years.
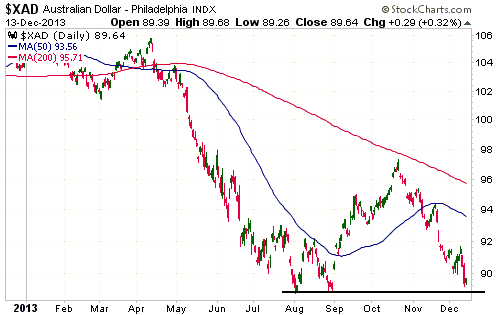
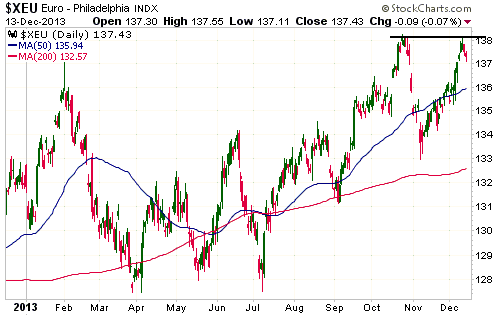
The A$ is testing its low for the year at the same time as the euro is testing
its high for the year.
The euro has been boosted since mid-2013 by the increasing popularity within the
financial world of all things European. We don't know if the shift towards
Europe has run its course, but with European equities having recently begun to
trend downward relative to US equities and with the euro having just turned
lower from near its 52-week high after becoming slightly overbought and
moderately over-valued, it may well have done so.
Update
on Stock Selections
Notes: 1) To review the complete list of current TSI stock selections, logon at
http://www.speculative-investor.com/new/market_logon.asp
and then click on "Stock Selections" in the menu. When at the Stock
Selections page, click on a stock's symbol to bring-up an archive of
our comments on the stock in question. 2) The Small Stock Watch List is
located at http://www.speculative-investor.com/new/smallstockwatch.html
 Company
news/developments for the week ended Friday 13th December 2013: Company
news/developments for the week ended Friday 13th December 2013:
[Note: AISC = All-In Sustaining Cost, FS = Feasibility Study, IRR =
Internal Rate of Return, MD&A = Management Discussion and Analysis,
M&I = Measured and Indicated, NAV = Net Asset Value, NPV(X%) = Net
Present Value using a discount rate of X%, P&P = Proven and
Probable, PEA = Preliminary Economic Assessment, PFS =
Pre-Feasibility Study]
*Dragon Mining (DRA.AX) advised that it is reviewing its
operations with the aim of bringing about further reductions in
costs and that the Environmental Impact Assessment Report for its
exploration-stage Kuusamo gold project (Finland) has been released
for public comment.
The company also advised that Eurogold, the owner of 24% of DRA, has
requested a shareholders meeting to consider the removal of DRA's
chairman, managing director and two other directors. It therefore
seems that a top-level shakeup is in the works at DRA, which, given
the company's performance, would be appropriate.
*In a press release last Friday, Pretium Resources (PVG) reported
additional results from the milling of its 10,000-tonne
(10,302-tonne, actually) bulk sample. The as-good-as-final result
was gold production of 5,865 ounces, versus the 4,000 ounces that
were predicted by the Snowden resource model. This is an excellent
result, but the information included in last Friday's press release
doesn't address the issues raised by Strathcona. For example, it
doesn't indicate how well the production from each section of the
bulk sample matched up with the resource model. That is, it doesn't
answer the first question mentioned in the following excerpt from
our 9th December commentary:
"The final bulk-sample milling results are going to show that a
lot more gold was recovered than originally expected, meaning that
the average grade of the 10,000-tonne sample is a lot higher than
the average grade predicted by the Snowden resource model. This is
obviously a plus, but the issues raised by Strathcona will not be
resolved by the total gold recovery from the bulk sample regardless
of how high it ends up being. The salient questions revolve around
whether the gold was dispersed within the 10,000-tonne sample in
accordance with the resource model, and whether the sample itself
was representative (the 10,000-tonne sample is about 0.06% of the
currently-defined deposit). The second of these questions won't be
answered in the near future, but if the first question is answered
in the affirmative it will be a big step in the right direction."
According to last Friday's press release, the answer to first
question will be available within the next few weeks. Specifically,
it was stated in the press release that the total number of ounces
processed on an individual cross-cut basis will be reconciled
against the local resource model and documented as part of an
updated NI 43-101-compliant Valley of the Kings Mineral Resource
estimate to be completed by Snowden. The updated Mineral Resource
estimate for the Valley of the Kings is expected later this month,
with the NI 43-101-compliant Technical Report to follow.
Although last Friday's news didn't provide much in the way of
relevant new information, it wouldn't have surprised us if the stock
price had risen by more in reaction to the news. The reason the
stock price didn't rise by much on Friday can probably be explained
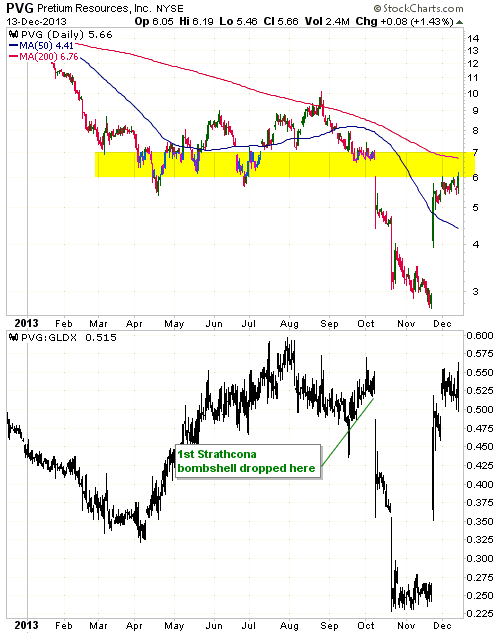
by the following chart. The top half of the chart shows that
substantial resistance exists in the US$6-US$7 range. It will be
difficult for PVG to overcome this resistance in the absence of
sector-wide strength, especially given the message of the bottom
half of the chart. The bottom half of the chart shows that relative
to its peer group (represented here by GLDX) PVG had already
recouped all of its Strathcona-related losses prior to last Friday's
news. On a side note, the July-2013 high for the PVG/GLDX ratio was
an all-time high.
We remain bullish on PVG's intermediate-term prospects. At the same
time we are concerned about a) the uncertainty that persists
regarding the most appropriate mining method for the Valley of the
Kings deposit, b) PVG's high valuation relative to many other
beaten-down gold-mining stocks, and c) the likelihood that PVG's
management will take advantage of the stock's recent strong rebound
by arranging another equity financing. Our conclusion is that at
current prices there are better candidates for new buying within the
gold sector.
*Ramelius Resources (RMS.AX) was halted over the final two days of
the week before last, pending an announcement from the company
regarding a pit-wall failure at its Western Queen South mine. The
announcement came on Monday 9th December.
The effect of the pit-wall failure is not as bad as feared. In fact,
it isn't significant. The company expects that it will only take
about 14 days to repair the damage and that due to having 4 months
of stockpiled ore there will be no effect on gold production.
The same announcement contained updated production guidance
resulting from the ball-mill motor failure that happened in
November. In this case the effect was significant, with this
quarter's production forecast falling from 27K ounces to 21K ounces.
This bad news had previously been discounted by the stock market and
therefore didn't cause additional price weakness.
However, the stock price fell sharply the day after the bad news
regarding the reduced production guidance. This could have been
because some traders were aware of the news that would arrive later
in the week. We are referring to Friday's announcement of details
regarding the "Gold Pre-Pay Finance Facility" arranged early last
month.
What was previously known was that RMS had effectively forward-sold
A$16M of gold, in that it would receive a $16M cash advance to be
repaid via the delivery of gold from January through to August of
2014. What wasn't known was the price of the forward gold sale.
As a result of last Friday's announcement we now know that RMS has,
for all intents and purposes, agreed to sell 1492 ounces of gold per
month over the first 8 months of next year at a price of A$1340/oz
(about US$1200/oz at the current exchange rate). This is obviously a
bad deal, because a) gold for delivery during January-August of next
year could be sold in the futures market right now for around
US$1235/oz, and b) the gold price is probably near a major low.
Fortunately, during the period covered by the credit facility RMS
should still be able to sell about 6000 ounces of gold per month at
the spot price.
 List
of candidates for new buying List
of candidates for new buying
From within the ranks of TSI stock selections, below is a list of the best
candidates for new buying at this time.
1) AAU (last Friday's closing price: US$1.07)
2) EDV.TO/EVR.AX (last Friday's closing price: C$0.56)
3) PG.TO (last Friday's closing price: C$1.46)
4) PLG.TO (last Friday's closing price: C$0.86)
5) RIO.TO/RIOM (last Friday's closing price: C$1.47/US$1.38). Last week's price
action suggests that RIO has finally bottomed. We expect that it will rebound
quickly to $2.00 after the overall sector reverses upward.
 Potential
future TSI stock selections Potential
future TSI stock selections
Here are some of the stocks on our radar screen with the potential to be future
additions to the TSI Stocks List, including brief notes on why the stock has
speculative merit and our main reason(s) for not 'pulling the trigger' at this
time.
1) Golden Queen Mining (GQM.TO)
GQM has 111M shares (fully diluted) and ended last week at C$0.63. It is
developing the Soledad gold-silver project in California.
The reason to like GQM is that at last Friday's closing price it offers huge
upside leverage to gold. Specifically, using figures from the September-2012 FS
we estimate that GQM would be worth about C$3.50/share (almost 6-times the
current price) at a gold price of $1415/oz.
Our main concern is that the company is entering the construction phase with
very little cash in the bank, meaning that a substantial financing will soon
have to be done to enable progress to continue. GQM will need to raise at least
$120M to build the proposed Soledad mine, which is a lot for a company with a
market cap of around $70M.
2) Minera IRL (IRL.TO)
IRL has 182M shares outstanding and ended last week at C$0.17. Its two most
important assets are the Don Nicolas gold project in Argentina and the Ollachea
gold project in Peru. Both projects are fully permitted and ready to enter the
mine construction phase. Also, in both cases the planned mine would likely be
profitable at $1250/oz for gold.
IRL's market cap is very low relative to the value of its mining assets.
Financing is the problem. Financing is in place for the Don Nicolas mine
construction, but the company has negative working capital and therefore
urgently needs to raise more money to continue progressing its Ollachea project
and just stay in business.
Despite the fact that IRL is very much on sale, it will probably make sense to
steer clear for now and revisit the stock after the required financing is in
place. Also, at this time the stock is not liquid enough for our liking.
3) Midway Gold (MDW)
MDW has 128M shares outstanding and ended last week at US$0.84. It is in the
process of building an 80K-oz/year gold mine at the Pan project in Nevada and
has two other interesting assets at earlier stages of development. It is well
financed, with about $50M of working capital, but will need to raise an
additional $50M or more within the next several months in order to complete the
mine construction at the Pan project.
MDW's current enterprise value is about $130M, which we consider to be a bit
high in the context of today's depressed market for gold mining shares. Also of
concern is the uncertainty regarding how the company will raise the additional
$50M it needs to complete the Pan construction.
4) Papillon Resources (PIR.AX)
PIR has 340M shares outstanding and ended last week at A$1.00. It owns the 5M-oz
Fekolo gold project in Mali and is well funded with about $45M of cash.
Using the figures in the June-2013 PFS and assuming a 25% tax rate, we calculate
Fekolo's post-tax NPV(5%) and IRR to be $717M and 47%, resp., at a gold price of
$1300/oz. This suggests that Fekolo is an exploration-stage project that would
'work' and be attractive to larger mining companies near the current gold price.
PIR offers good value near its current price, but due to the country risk it
would have to become significantly cheaper before we would buy it.
5) Roxgold (ROG.V)
ROG has 184M shares outstanding and ended last week at C$0.44. It owns the very
high-grade (17-g/t average) 1M-oz Yaramoko gold project in Burkina Faso and has
been written-up in previous TSI commentaries.
Our only concerns with ROG are that its price isn't quite low enough (the stock
would be very interesting near C$0.35) and it is too thinly traded.
Chart Sources
Charts appearing in today's commentary
are courtesy of:
http://stockcharts.com/index.html

|

