|
-- Weekly Market Update for the Week Commencing 17th January 2011
Big Picture
View
Here is a summary of our big picture
view of the markets. Note that our short-term views may differ from our
big picture view.
In nominal dollar terms, the BULL market in US Treasury Bonds
that began in the early 1980s will end by mid-2010. In real (gold)
terms, bonds commenced a secular BEAR market in 2001 that will continue
until 2014-2020. (Last
update: 09 February 2009)
The stock market, as represented by the S&P500 Index, commenced
a secular BEAR market during the first quarter of 2000, where "secular
bear market" is defined as a long-term downward trend in valuations
(P/E ratios, etc.) and gold-denominated prices. This secular trend will bottom sometime between 2014 and 2020. (Last update: 22 October 2007)
A secular BEAR market in the Dollar
began during the final quarter of 2000 and ended in July of 2008. This
secular bear market will be followed by a multi-year period of range
trading. (Last
update: 09 February 2009)
Gold commenced a
secular bull market relative to all fiat currencies, the CRB Index,
bonds and most stock market indices during 1999-2001. This secular trend will peak sometime between 2014 and 2020. (Last update: 22 October 2007)
Commodities,
as represented by the Continuous Commodity Index (CCI), commenced a
secular BULL market in 2001 in nominal dollar terms. The first major
upward leg in this bull market ended during the first half of 2008, but
a long-term peak won't occur until 2014-2020. In real (gold) terms,
commodities commenced a secular BEAR market in 2001 that will continue
until 2014-2020. (Last
update: 09 February 2009)
Copyright
Reminder
The commentaries that appear at TSI
may not be distributed, in full or in part, without our written permission.
In particular, please note that the posting of extracts from TSI commentaries
at other web sites or providing links to TSI commentaries at other web
sites (for example, at discussion boards) without our written permission
is prohibited.
We reserve the right to immediately
terminate the subscription of any TSI subscriber who distributes the TSI
commentaries without our written permission.
Outlook Summary
Market
|
Short-Term
(0-3 month)
|
Intermediate-Term
(3-12 month)
|
Long-Term
(1-5 Year)
|
Gold
|
Bullish
(27-Oct-10)
|
Bullish
(12-May-08)
|
Bullish
|
US$ (Dollar Index)
|
Neutral
(01-Sep-10)
| Bullish
(03-Jan-11)
|
Neutral
(19-Sep-07)
|
Bonds (US T-Bond)
|
Neutral
(20-Sep-10)
|
Neutral
(03-Jan-11)
|
Bearish
|
Stock Market (S&P500)
|
Bearish
(22-Dec-10)
|
Bearish
(11-Oct-10)
|
Bearish
|
Gold Stocks (HUI)
|
Bullish
(01-Sep-10)
|
Bullish
(23-Jun-10)
|
Bullish
|
| Oil | Bearish
(03-Jan-11)
| Bearish
(01-Mar-10)
| Bullish
|
Industrial Metals (GYX)
| Bearish
(03-Jan-11)
| Bearish
(25-May-09)
| Neutral
(11-Jan-10)
|
Notes:
1. In those cases where we have been able to identify the commentary in
which the most recent outlook change occurred we've put the date of the
commentary below the current outlook.
2. "Neutral", in the above table, means that we either don't have a
firm opinion or that we think risk and reward are roughly in balance with respect to the timeframe in question.
3. Long-term views are determined almost completely by fundamentals,
intermediate-term views by giving an approximately equal weighting to
fundamental and technical factors, and short-term views almost
completely by technicals.
Long-term price targets are meaningless
Many commentators like to
speculate on where the dollar-denominated gold price is ultimately
headed. Some claim that it is destined to reach $3,000/oz, others claim
that it won't top until it hits at least $5,000/oz, and some even
forecast an eventual rise to as high as $50,000/oz. All of these
forecasts are meaningless.
Long-term dollar-denominated price targets are meaningless because they
fail to account for the change in the dollar's purchasing power, and
the only reason a rational person invests is to preserve or increase
purchasing power. To further explain by way of a hypothetical example,
assume that five years from now a US dollar buys only 20% of the
everyday goods and services that it buys today. In this case, the US$
gold price will have to be around $7,000/oz just to maintain its
current value in purchasing power terms. To put it another way, in our
example a person who buys gold at around $1360/oz today and holds it
will suffer a LOSS, in real terms (the only terms that matter), unless
the gold price is above $7,000/oz in January-2016. Considering a
non-hypothetical example to make the same point, a resident of Zimbabwe
who owned a small amount of gold and not much else would have become a
trillionaire a few years ago, and would also have become broke.
The purchasing power issue is why the only long-term forecasts of
gold's value that we ever make are expressed in non-monetary terms. For
example, throughout the past 10 years we've maintained that gold's
long-term bull market would very likely continue until the Dow/gold
ratio had fallen to at least 5, and would potentially continue until
Dow/gold reached 1.
If we were forced to state a very long-term target for the US$ gold
price then it would be: infinity. The US$ will eventually become
worthless, at which point gold will have infinite value in US$ terms.
But then, so will everything else that people want to own.
Natural Gas Update
The price of natural gas remains at a very low level in absolute terms
and especially relative to the price of oil (the natgas/oil ratio is
currently not far from the 20-year low it reached in late-2009). This
probably means that natgas is due for a period of strength, if not in
dollar terms then at least relative to oil. However, the fact that
natgas (the commodity) may well be in bargain-basement territory
doesn't mean that the same applies to the stocks of natgas
producers/explorers.
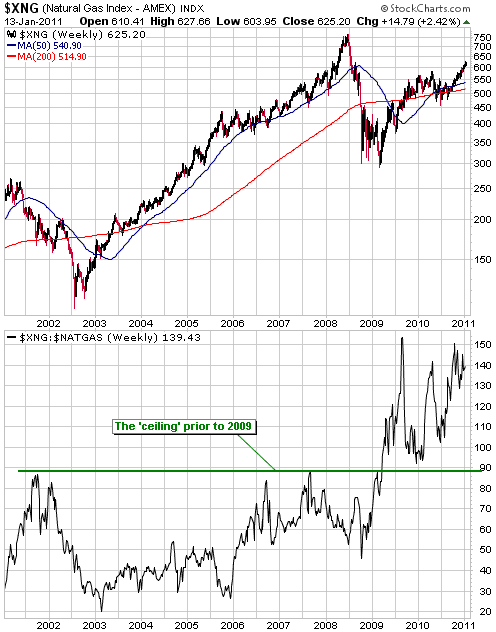
A strange situation has developed over the past couple of years in that
natgas-related equities have generally performed well even as the price
of the commodity has languished at a very low level. The situation is
illustrated by the following chart, the top section of which shows the
AMEX Natural Gas Index (XNG), a proxy for natgas equities, and the
bottom section of which shows the XNG/natgas ratio (natgas equities
relative to the underlying commodity).
Note that prior to 2009 the XNG/natgas ratio had never made a sustained
move above 90, but during the first half of 2009 it surged well above
90 and has remained there. This has come about because the natgas price
has recovered almost none of the loss incurred during the 2008 crash,
whereas the XNG has recouped the bulk of its 2008 loss.
The upshot is that natgas looks cheap while natgas-related equities look dangerously extended to the upside. Strange, indeed.
1. Most natgas producers also produce oil, and the oil price has trended upward
2. The stock market's post-crash rebound has been strong enough to lift almost all equities
3. New drilling technology makes it possible for natgas producers to be profitable at a lower commodity price
4. Most natgas producers hedge part of their production
But even taking these reasons into account, the extent of the out-performance is extraordinary.
Interesting quote or fact of the week
Here are quotes from an article written by Frank Chodorov in 1962:
"The only limit to the
inclination of every politician to spend money, in order to acquire
power, is the refusal of the public to lend its money to the
government. Of course, the government can then resort to printing
money, to make money out of nothing, but at least the people will not
be compounding the swindle. Therefore, I offer the following gratuitous
advice: Don't buy bonds."
And:
"Internal debts...are
never liquidated. When the burden of meeting the service charges
becomes economically unbearable, and the State's credit is gone,
repudiation or inflation is resorted to.
Of these two methods,
repudiation is by far the more honest. It is a straightforward
statement of fact: the State declares its inability to pay. The wiping
out of the debt, furthermore, can have a salutary effect on the economy
of the country, since the lessening of the tax burden leaves the
citizenry more to do with. The market place becomes to that extent
healthier and more vigorous. The losers in this operation are the few
who hold the bonds, but since they too are members of society they must
in the long run benefit by the improvement of the general economy; they
lose as tax collectors, they gain as producers."
The article puts forward the arguments that it is unethical to invest
in government bonds and that direct default on government debt is
vastly preferable to default via inflation. We couldn't agree more.
The Stock
Market
The US stock market continues
to make slow and steady upward progress, thus maintaining its
'overbought' status and leaving bullish sentiment at a dangerously
elevated level. In particular, as at the end of last week the
S&P500 Index had risen for seven weeks in succession, more than 94%
of S&P500 stocks were above their 200-day moving averages, and the
US stock market's put/call situation was as bearish as it gets (the
10-day moving average of the equity put/call ratio was near a 10-year
low and the 10-day moving average of the OEX put/call ratio was near a
10-year high).
We suspect that all the gains made over the past seven weeks, along
with any additional gains made over the days ahead, will be given back
in quick time.
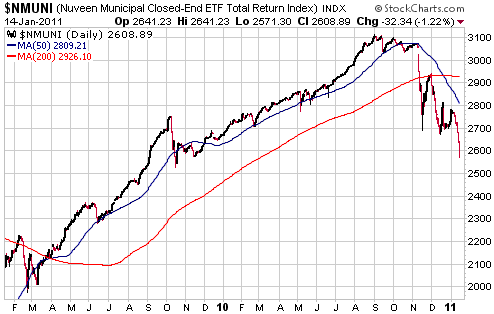
One of the most interesting aspects of the recent market action is the
way the stock market has 'turned a blind eye' to the goings on in the
municipal bond market. As illustrated by the following daily chart, the
US municipal bond market continues to plunge. But according to the
stock market, it doesn't matter.
This week's
important US economic events
| Date |
Description |
Monday Jan 17
| US markets closed for MLK Day
| | Tuesday Jan 18 | Empire State Manufacturing Index
Housing Market Index
TIC Report
| | Wednesday Jan 19
| Housing Starts
| | Thursday Jan 20
| Existing Home Sales
Leading Economic Indicators
Philadelphia Fed Survey
| | Friday Jan 21
| No important events scheduled
|
Gold and
the Dollar
Gold
Current Market Situation
Gold futures broke below short-term support in the $1360s last Friday.
For the February contract, the next levels of meaningful chart-related
support lie in the $1320s and the $1270s.
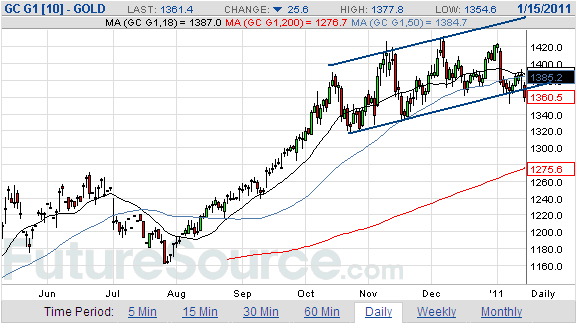
We don't perceive a
lot of downside risk in gold on either a short- or an intermediate-term
basis. Despite the many assertions that gold is in a bubble and
sentiment is too bullish, objective evidence indicates otherwise. For
example:
1. The US$ gold price has essentially traded sideways over the past
three months and at no stage over the past several months has it come
close to the top of the moving-average envelope that has limited
intermediate-term advances over the past decade.
2. Market Vane's bullish consensus for gold never exceeded 85% over the
past few months and dropped below 70% last week. It could do what it
did last July and fall as far as 60% before a correction low is in
place, but the Market Vane survey suggests that the sentiment situation
is now constructive.
3. Other sentiment indicators are consistent with the Market Vane
survey. We note, for instance, that there has been a large decline in
the speculative net-long position in COMEX gold futures and that the
gold-stock indices are at low levels relative to gold bullion.
The sentiment picture suggests that a correction low will be put in
place within the next three weeks and that support in the $1270s
defines the maximum downside risk. Support in the $1320s is a more
likely short-term price floor.
Gold relative to other metals
Our main concern is that while gold's price action and sentiment
situation is not consistent with anything more serious than a routine
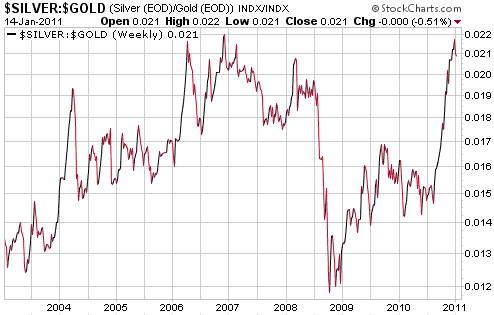
short-term correction, silver and the silver/gold ratio became
sufficiently 'overbought' during the past few months to create major
peaks (peaks that hold for more than a year).
After rising in near-vertical fashion during August-December of last
year, the silver/gold ratio has pulled back a little over the past
fortnight (refer to the following weekly chart for details). Its
reversal isn't yet definitive, but significant additional weakness from
here would suggest that peaks of at least an intermediate-term nature
are in place for both silver and gold. This wouldn't negate the idea
that gold was within three weeks of reaching a short-term low, but it
would imply that the rally that follows the upcoming short-term low
will end below the December high.
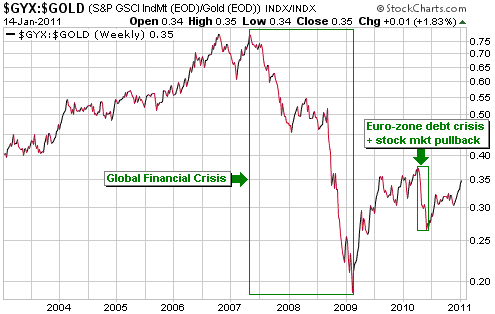
Next up is a weekly chart of the GYX/gold ratio (the Industrial Metals Index relative to gold).
One of the biggest problems with the theory that direct manipulation of
the gold price is a major force in the gold market is the fact that
GYX/gold's performance over the past decade is consistent with what was
happening at the time to the financial/economic landscape. Of
particular note is that industrial metals, as a group, weakened
relative to gold during the 2000-2002 economic downturn, trended higher
relative to gold during the 2003-2006 boom, plunged relative to gold
during the global financial crisis of 2007-2009, and then rebounded
relative to gold during the post-crash recovery period that began in
February-March of 2009. This is exactly as should be expected.
As at the end of last week the post-crash recovery was still in
progress. Once it ends, the industrial metals complex should begin to
weaken relative to gold.
Gold Stocks
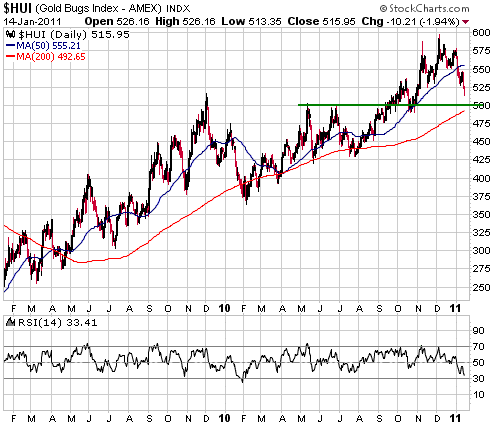
In last week's Interim Update we wrote:
"If we interpret the
HUI's early-December peak as a test of the early-November peak then the
HUI's current position looks similar to its position during the second
half of July, in which case support in the low-500s defines the maximum
downside risk and a new multi-month advance should begin within the
next three weeks.
A more bearish
interpretation is also plausible, but even if an intermediate-term
decline has begun we will likely get an initial low within the next
three weeks and then a multi-week rally."
The following daily chart shows that the HUI ended last week within
'spitting distance' of the aforementioned support and that the HUI's
daily RSI is approaching its lows of the past two years. In other
words, the HUI is now 'oversold' on a short-term basis and is not far
from an area that should offer good support. A sector-wide short-term
buying opportunity is therefore emerging.
A point we regularly
try to make is that taking advantage of short-term swings in the
markets does not require forecasting accuracy. In fact, you never even
need to have an opinion on the likely direction of prices over the
weeks immediately ahead. The idea is simply to methodically and
gradually scale into positions on short-term weakness and scale out of
positions in the same way on short-term strength, all the while
maintaining core exposure in line with the long-term trend.
Resistance/support levels and momentum indicators can be useful in
figuring where and when to place orders.
Currency Market Update
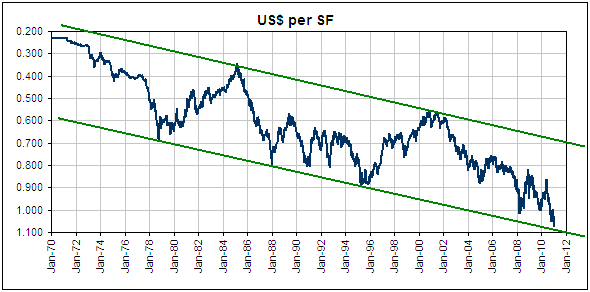
The following chart shows how the US$ has performed relative to the
Swiss Franc since 1970. It is evident that the US$ has been in an
ultra-long-term downward trend against the SF. It is also evident that
the US$ has experienced cyclical bull and bear markets within the
context of this ultra-long-term trend. Furthermore, these cyclical
bulls/bears have traced out a pattern that can be described as: 8-10
years down followed by 6 years up.
If the pattern continues then the US$ has already commenced a cyclical bull market or will do so within the next 12 months.
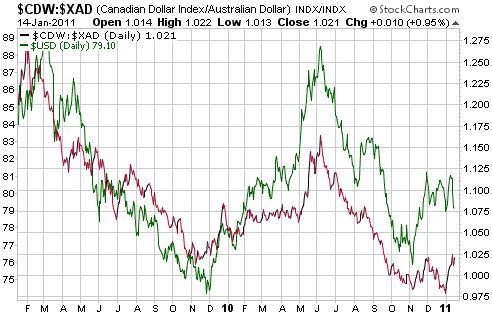
By comparing the
C$/A$ exchange rate with the Dollar Index, the following chart makes
the point that the C$ tends to strengthen relative to the A$ when the
US$ is in a rising trend and to weaken relative to the A$ when the US$
is in a falling trend. This relationship probably stems from the close
economic ties between Canada and the US. The implication is that if the
Dollar Index has turned upward on an intermediate-term basis (we think
it has) then we have entered a period of at least 6 months when the C$
should generally be stronger than the A$.
The Baltic Dry Index
(BDI), an index of ocean freight rates, hit a new 52-week low last
week. In fact, with the exception of the 5-month crisis period of
October-2008 through to February-2009 the BDI is now at its lowest
level of the past eight years.
For whatever reason, intermediate-term turning points in the BDI tend
to coincide with intermediate-term turning points in the currency
market, with US$ highs coinciding with BDI lows and US$ lows coinciding
with BDI highs. The three most recent BDI turning points of importance
are good examples. These occurred in May-2008 (BDI high, dollar low),
November-2008 (BDI low, dollar high), and November-2009 (BDI high,
dollar low).
The next important BDI turning point should be a reversal from down to
up and is likely to coincide with a US$ high. Based on our current US$
outlook, it would make sense if this turning point waited until at
least the second half of this year.
Update
on Stock Selections
(Notes: 1) To review the complete list of current TSI stock selections, logon at http://www.speculative-investor.com/new/market_logon.asp
and then click on "Stock Selections" in the menu. When at the Stock
Selections page, click on a stock's symbol to bring-up an archive of
our comments on the stock in question. 2) The Small Stock Watch List is
located at http://www.speculative-investor.com/new/smallstockwatch.html)
 Potential agriculture exposure Potential agriculture exposure
Agricultural commodities and agriculture-related equities have recently
been very strong. Although there's a good chance that they will soon
begin short-term 'corrections', there is also a good chance that they
will continue to be relatively good performers over the coming 12
months.
Sprott Resource Corp. (TSX: SCP), a former and potential future TSI
stock selection, offers reasonable exposure to agriculture via its
basket of investments. Specifically, included in its numerous
investments are 70M shares of Stonegate Agricom (TSX: ST), an
exploration-stage potash miner with projects in Peru and the US
(Idaho), and 80% ownership of One Earth Farms Corp., a private company
that is set to become Canada's largest crop and cattle farming
operation this year.
SCP is far from being a pure agriculture play in that ag-related
investments currently constitute less than half its net asset value. Of
the non-ag-related investments in its stable, the most significant are
229M shares of Orion Oil and Gas (TSX: OIP) and 74,000 ounces of gold
bullion.
Due to the way the company does its accounting, the net asset value
(NAV) that it states in its quarterly financial reports is a lot less
than the NAV that would be arrived at by summing the current market
values of its investments. Assuming a total share count of 113M, our
assessment is that SCP's NAV is presently between C$5.60/share and
C$6.00/share. This implies that SCP ended Friday's trading session at a
discount of at least 18% to its NAV.
Although the above-mentioned discount is meaningful, we don't think it
is sufficient to make SCP shares a strong buy in light of the current
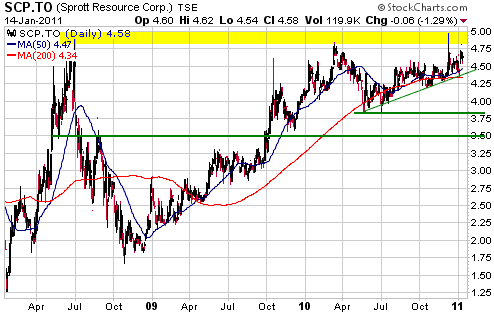
market situation and other risks. In our opinion, the stock will have
to drop below C$4 over the weeks ahead to become a strong buy. We are
therefore not going to add SCP to the TSI List at this time, but are
hoping for an opportunity to do so in the future at a lower price.
The following chart shows that the stock has important support at
around C$3.80 and C$3.50. The lower of these support levels probably
defines the maximum downside potential.
 New gold stock selection: Carpathian Gold (TSX: CPN). Shares: 385M issued, 428M fully diluted. Recent price: C$0.59 New gold stock selection: Carpathian Gold (TSX: CPN). Shares: 385M issued, 428M fully diluted. Recent price: C$0.59
CPN is developing the Rovina Valley gold/copper project in Romania and the Riacho do Machados (RDM) gold project in Brazil.
Rovina Valley has a porphyry-style deposit comprising 3.1M ounces of
gold and 759M pounds of copper in the M&I category plus 3.9M ounces
of gold and 663M pounds of copper in the Inferred category. A
Preliminary Economic Assessment (PEA) completed in March-2010 estimated
that with initial capital expenditure of $509M, the project could be
developed into a mine that produced an average of 200K ounces of gold
and 50M pounds of copper per year for 19 years at a cash cost of
$379/ounce (taking copper as a byproduct). Assuming a gold price of
$1000/oz, a copper price of $3.00/pound and a conservative discount
rate of 10%, the project's net present value (NPV) was estimated to be
US$544M.
The Rovina Valley project is a long way from production and will be the subject of further exploration during 2011.
The RDM project in Brazil is smaller, but is a lot closer to
production. In fact, CPN's current plan is to develop RDM into an
open-pit 102K-oz/yr gold mine by the end of 2012.
The project's total resource is presently estimated to be around 1.5M
ounces (0.8M ounces M&I + 0.7M ounces Inferred), 1.1M ounces of
which are in the open-pit-able portion of the deposit. A PEA came up
with estimates of $113M for the initial capex and $143M for the net
present value (assuming a gold price of $1000/oz and a discount rate of
7.5%).
For all intents and purposes, the RDM project is fully funded through
to production in that CPN has about $50M of cash in the bank and is
close to finalising a $75M debt facility.
The sum of the NPVs of the above projects is $687M, or $1.60 per share
(using the fully diluted share count). Due to country risk (Romania)
and execution risk (construction of the RDM mine), we think it is
prudent to apply a sizable discount to this figure and assume that CPN
would be fully valued at $1.00-$1.20/share. However, even with our
risk-related discount there appears to be substantial upside potential
in CPN's stock price, especially considering that the NPV figures are
based on a gold price of $1000/oz.
Here are some other noteworthy points:
First, on the plus side, management/insiders own 35% of the company.
Also on the plus side, news-flow is likely to be good over the next few
months. For example, an updated resource estimate and Feasibility Study
for the RDM project are expected during the first quarter, and regular
drilling updates are expected for both the Rovina and RDM projects.
On the negative/risk side of the equation, CPN has forward-sold 12.5%
of the annual production from its RDM mine at $400/oz in exchange for
up-front payments totaling $30M. Consequently, RDM will effectively be
a 90K oz/yr, rather than a 102K oz/yr, operation. Also, there is a risk
that the company will be unable to convert the Rovina Valley
exploration licence into a mining licence.
The optimum place for new buying of CPN shares would be just above the
support level indicated on the following chart. That is, around C$0.50.
However, at Friday's closing price of C$0.59 the risk/reward is good
enough to warrant some buying and to warrant CPN's inclusion in the TSI
List.
In our opinion, a reasonable approach would be to take an initial
position near the current price with the aim of scaling up to a full
position on weakness.
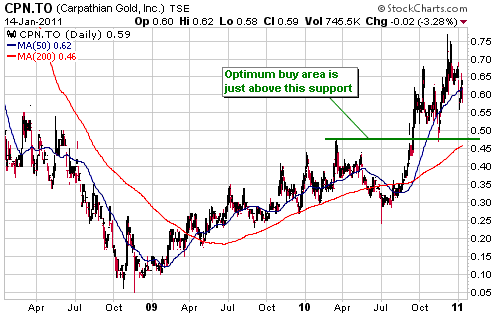
Chart Sources
Charts appearing in today's commentary
are courtesy of:
http://stockcharts.com/index.html
http://www.futuresource.com/

|

