|
-- Weekly Market Update for the Week Commencing 17th June 2013
Big Picture
View
Here is a summary of our big picture
view of the markets. Note that our short-term views may differ from our
big picture view.
In nominal dollar terms, the BULL market in US Treasury Bonds
that began in the early 1980s will end by 2013. In real (gold)
terms, bonds commenced a secular BEAR market in 2001 that will continue
until 2014-2020. (Last
update: 23 January 2012)
The stock market, as represented by the S&P500 Index,
commenced
a secular BEAR market during the first quarter of 2000, where "secular
bear market" is defined as a long-term downward trend in valuations
(P/E ratios, etc.) and gold-denominated prices. This secular trend will bottom sometime between 2014 and 2020.
(Last update: 22 October 2007)
A secular BEAR market in the Dollar
began during the final quarter of 2000 and ended in July of 2008. This
secular bear market will be followed by a multi-year period of range
trading.
(Last
update: 09 February 2009)
Gold commenced a
secular bull market relative to all fiat currencies, the CRB Index,
bonds and most stock market indices during 1999-2001.
This secular trend will peak sometime between 2014 and 2020.
(Last update: 22 October 2007)
Commodities,
as represented by the Continuous Commodity Index (CCI), commenced a
secular BULL market in 2001 in nominal dollar terms. The first major
upward leg in this bull market ended during the first half of 2008, but
a long-term peak won't occur until 2014-2020. In real (gold) terms,
commodities commenced a secular BEAR market in 2001 that will continue
until 2014-2020.
(Last
update: 09 February 2009)
Copyright
Reminder
The commentaries that appear at TSI
may not be distributed, in full or in part, without our written permission.
In particular, please note that the posting of extracts from TSI commentaries
at other web sites or providing links to TSI commentaries at other web
sites (for example, at discussion boards) without our written permission
is prohibited.
We reserve the right to immediately
terminate the subscription of any TSI subscriber who distributes the TSI
commentaries without our written permission.
Outlook Summary
Market
|
Short-Term
(1-3 month)
|
Intermediate-Term
(6-12 month)
|
Long-Term
(2-5 Year)
|
|
Gold
|
Bullish
(17-Oct-12)
|
Bullish
(26-Mar-12)
|
Bullish
|
|
US$ (Dollar Index)
|
Neutral
(24-Dec-12)
|
Bullish
(01-May-13)
|
Neutral
(19-Sep-07)
|
|
Bonds (US T-Bond)
|
Neutral
(12-Nov-12)
|
Neutral
(18-Jan-12)
|
Bearish |
|
Stock Market
(DJW)
|
Neutral
(06-May-13)
|
Bearish
(28-Nov-11)
|
Bearish
|
|
Gold Stocks
(HUI)
|
Bullish
(24-Dec-12)
|
Bullish
(23-Jun-10)
|
Bullish
|
|
Oil |
Neutral
(30-Jul-12)
|
Neutral
(31-Jan-11)
|
Bullish
|
|
Industrial Metals
(GYX)
|
Neutral
(30-Jul-12)
|
Neutral
(29-Aug-11)
|
Neutral
(11-Jan-10)
|
Notes:
1. In those cases where we have been able to identify the commentary in
which the most recent outlook change occurred we've put the date of the
commentary below the current outlook.
2. "Neutral", in the above table, means that we either don't have a
firm opinion or that we think risk and reward are roughly in balance with respect to the timeframe in question.
3. Long-term views are determined almost completely by fundamentals,
intermediate-term views by
fundamentals, sentiment and technicals, and short-term views by sentiment and
technicals.
Protecting yourself
against government confiscation
Government confiscation of wealth can take
many forms. Here are some examples:
1) Taxes, duties and royalties
2) Nationalisation of assets
3) The forced exchange of one asset for another of lesser value, such as the
compulsory exchange of gold for dollars in the US in 1933 and pension funds in
some countries being forced to invest in government debt.
4) The arbitrary impositions of laws and regulations that reduce the values of
investments
5) Capital controls that prevent money from being transferred to a more
desirable location, thus ensuring that the money remains available to the
government for future harvesting via taxation or forced investment in government
debt.
6) Licenses and fines
7) Price controls
8) Inflation
Specific and detailed tactics for protecting yourself against government
confiscation are outside the scope of the TSI newsletter and largely outside our
expertise (our specific tactical knowledge is mostly limited to our personal
experience and would not be relevant to the majority of our readers), but in
general terms it boils down to internationalising yourself and your assets.
Internationalising your assets involves spreading your wealth over multiple
political regions, such that no single government can take an action that
jeopardises your financial well-being. To be a little more specific, it makes
sense to spread assets/investments between North America (the US and Canada),
Asia (mainly Singapore and Hong Kong), the Asia-Pacific region (Australia and
New Zealand), and parts of non-euro Europe (e.g., Switzerland and the UK). Some
countries in Central and South America (Mexico, Panama and Chile being three
examples) could also make suitable homes for a portion of your capital. The
extent to which you spread your wealth geographically will, of course, depend on
how much wealth you have. The more wealth you have, the greater your need for
international diversification.
Internationalising yourself involves having at least two official travel
documents and is of greatest importance if you are a US citizen, the reason
being that if you only have a US passport then internationalising your assets
will be far more difficult than it should be. This is because the actions of the
US government have transformed US passport-holders into pariahs from the
perspective of most financial institutions outside the US.
Confiscation via inflation is the one form of government theft that you can't
effectively protect yourself against by internationalising your assets, because
all major currencies are being inflated aggressively. With there being
widespread commitment to the wrongheaded belief that a strong currency is a
liability, this is unlikely to change in the foreseeable future.
That being said, some diversification between currencies still makes sense.
Currency diversification can't protect you against purchasing-power loss because
they are all sliding downhill together, but some are more risky than others.
At this time about two-thirds of our cash is denominated in US dollars and Hong
Kong dollars (the HK$ is really just the US$ with the potential for a sudden
upward re-rating due to a change in the 'peg'), with the remainder spread
between the A$, the C$, the Yen and the Malaysian Ringgit (note that if we
didn't live in Malaysia we wouldn't hold any Ringgit). The reason that most of
our cash is US$-denominated is that the US$ has less event-risk than any other
currency. The US$ is guaranteed to lose purchasing power, but it is not going to
completely collapse. We can't say the same about the euro.
As mentioned above, we aren't going to get into specific internationalisation
tactics such as how to go about opening bank/brokerage accounts and starting
businesses in different countries, how to transfer money and other financial
assets (e.g. gold) out-of and into different countries, and how to obtain
residency visas and various passports. There are, however, some good web-based
services that deal in the specifics, including
The Dollar Vigilante and
Sovereign Man.
Bond Market Update
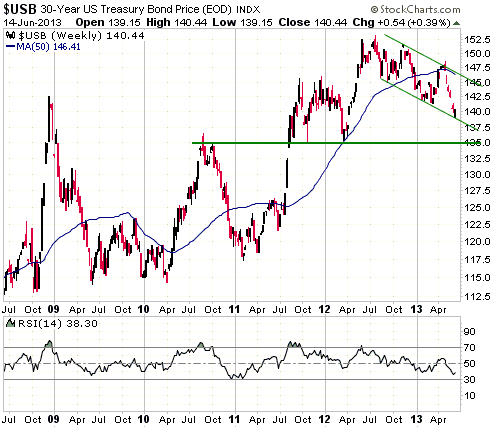
The following weekly chart shows that the T-Bond
has spent the past 12 months oscillating within a narrow downward-sloping
channel. At this stage the downturn looks more like an intermediate-term
bull-market correction than the first leg of a new bear market, but looks can be
deceptive.
The T-Bond is short-term 'oversold' and is almost 'oversold' on an
intermediate-term basis, creating the potential for a rebound even if the
overall downward trend is intact. A counter-trend rebound shouldn't go any
further than the channel top and the 50-week moving average, both of which are
presently around 146. This suggests to us that the T-Bond has about 6 points of
short-term upside potential.
As far as downside risk is concerned, there is strong support at 135 that is
likely to hold if tested within the next few weeks. This suggests to us that
there is about 5 points of additional short-term downside risk.
The current risk/reward does not point to a trading opportunity.
The most interesting aspect of the T-Bond decline of the past several weeks is
that it has happened in parallel with a decline in inflation expectations as
measured by the "Expected CPI" (the yield difference between the 10-year T-Note
and the 10-year TIPS). Actually, this is more than interesting; it is downright
weird. A chart of the Expected CPI is displayed below.
The unprecedented concurrent downward trends in US Treasury Bonds and inflation
expectations could be related to Japan. First, the rise in JGB yields has almost
certainly put upward pressure on yields in the US. Second, Japanese private
investors have generally been net-sellers of foreign bonds over the past few
months. Third, with speculators doing such a good job of reducing the value of
the Yen against the US$, there has been no need for Japan's Ministry of Finance
to buy US Treasuries.
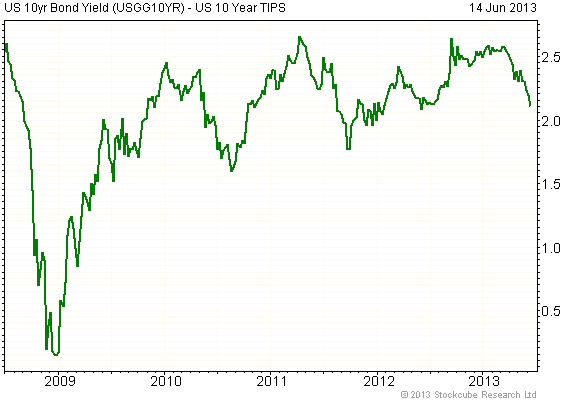
Chart Source: www.fullermoney.com
The UN concludes Fukushima
health impact negligible
From Toll Cross Securities:
"A draft report from UN Scientific Committee on the Effects of Atomic
Radiation (80 scientists from 18 countries) concluded; "Radiation exposure
following the nuclear accident at Fukushima-Daiichi did not cause any immediate
health effects. It is unlikely to be able to attribute any health effects in the
future among the general public and the vast majority of workers." The report
also noted that not one case of radiation sickness was reported among the 20,000
workers involved at the accident site. In fact radiation dosage for most
Japanese was below natural background radiation and even CT scan levels of
10mSv."
We take most UN-sourced information with a grain of salt. In this case, however,
the information is likely to be accurate, the reason being that the UN would be
more likely to put a negative spin than put a positive spin on the health
effects of the Fukushima nuclear 'disaster'.
Fukushima is widely considered to be the second-worst nuclear accident of the
past 4 decades and the worst nuclear accident outside the dystopia formerly
known as the Soviet Union, and yet the evidence suggests that it had NO
significant adverse health effects. It's actually likely that the decision by
the Japanese government to shut down the country's entire nuclear industry in
response to Fukushima had a far greater negative impact on public health -- due
to the much higher cost of electricity and the vastly increased consumption of
fossil fuels to which it led -- than the nuclear-reactor problems that prompted
the decision.
The Stock
Market
Japan
Japan's Nikkei225 Index began the year at 10400. It trended relentlessly upward
over the first 4.5 months of the year, hitting a high of 16000 on 22nd May for a
cumulative 2013 gain at that moment of 5600 points. It has since given back 3600
(about 64%) of those points.

We are no longer short-term bearish on the Japanese stock market. All the froth
has now been removed and the Nikkei's next 10% move is just as likely to be to
the upside as the downside.
Europe
Like many of the world's most important stock indices, the STOXX50, Europe's
equivalent of the Dow Jones Industrials Index, reached its peak for the year
during the third week of May and has since been in a declining trend. The
STOXX50 has important support at 2550 (about 4% below last Friday's close).
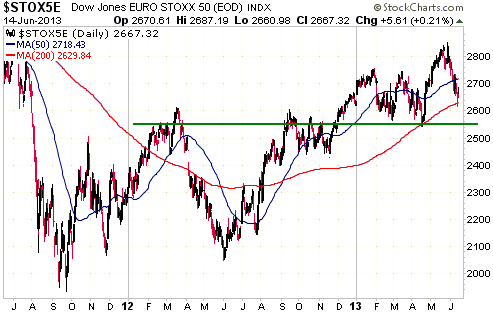
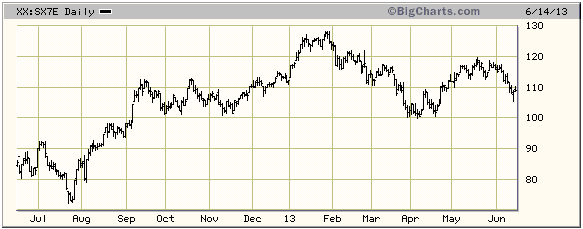
One of the most useful stock indices to track at this time is the EURO STOXX
Banks Index (SX7E). If the SX7E breaks below 100 it would be a sign that
Europe's banking industry was heading back into crisis and that a large decline
in the euro was in the offing.
Mining Stocks
All of our readers would be aware of the weakness in the gold-mining sector, but
it isn't just the gold section of the mining universe that has been down in the
dumps; mining stocks of all types have been poor performers since 2011 and
terrible performers since the beginning of 2013.
When it comes to weakness, coal miners have recently been leading the way.
Whereas the gold-stock indices and ETFs have so far held above their mid-May
lows, the top half of the following chart shows that the Market Vectors Coal ETF
(KOL) made a new 4-year low last week. KOL has lost about 60% of its value over
the past two years.
The bottom half of the following chart shows that the KOL/XLE ratio (coal stocks
versus oil-and-gas stocks) has just broken below its November-2008
financial-crisis low to a new all-time low. This means that the stock market is
shunning energy resources that have to be mined in favour of energy resources
that have to be drilled/pumped.
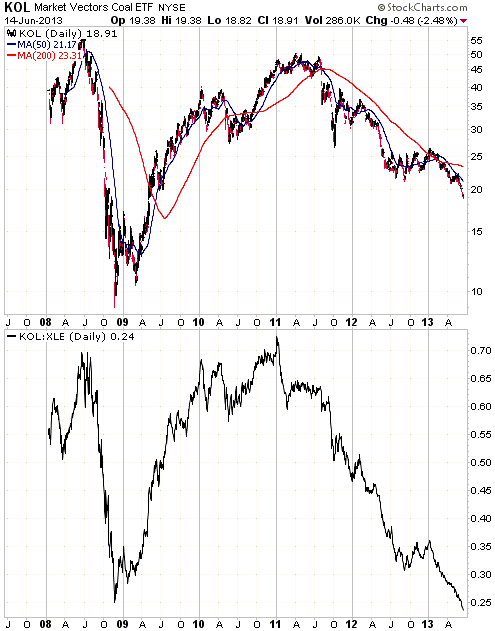
Global economic weakness and the potential for general stock market weakness
pose a threat to energy stocks, including the beaten-down coal-mining stocks.
That's why we prefer gold miners to coal miners, even though the latter are on
average now more 'oversold' than the former. However, it makes sense for
long-term speculators to be scaling into coal mining stocks -- via KOL -- at
this time.
This week's
important US economic events
| Date |
Description |
| Monday Jun 17 |
Empire State Mfg Survey
Housing Market Index | | Tuesday
Jun 18 |
CPI
Housing Starts | | Wednesday
Jun 19 |
FOMC Announcement, Forecasts and Press
Conference | | Thursday
Jun 20 |
Existing Home Sales
Philadelphia Fed Survey
Leading Economic Indicators
|
| Friday Jun 21 |
Quadruple Witching |
Gold and
the Dollar
Gold
The Dreaded "Tapering"
It seems that every year a new word or term or acronym becomes a prominent part
of the financial world's lexicon. Examples from previous years are "irrational
exuberance", "Asian tiger", "productivity miracle", "Greenspan put", "goldilocks
economy", "commodity supercycle", "savings glut", "Fiscal Cliff", "BRIC", "PIIGS"
and "QE". Right now, the term of the day is "tapering", as related to the Fed's
plans to scale back the magnitude of its "QE".
There is no doubt that the Fed will eventually have to not only "taper" QE, but
also stop it completely and go into reverse. The alternative would be to destroy
the currency and the economy via hyperinflation. However, it's not reasonable to
refer to the inevitability of reduced monetary accommodation as a plan. We
aren't dealing with master strategists; we are dealing with bungling bureaucrats
who are constantly reacting in knee-jerk fashion to financial-market and
economic events that they never see coming. Something happens and the Fed
reacts. The reaction distorts prices and leads to unintended consequences,
prompting another Fed reaction, and so on. In other words, although the Fed may
well talk about an "exit plan", it actually has no clue what it will do in the
future. What it does will be dictated by events it can't predict.
As an aside, it should be understood that over the long-term it wouldn't matter
if the top echelon of the Fed was populated by master strategists, the Fed would
still end up making a mess if it attempted to improve the economy by
manipulating interest rates and money supply. It should also be understood that
the Fed doesn't exist to improve the economy; it exists to remove financial
obstacles from the growth of the government and the banking industry.
We now turn to the relationship between the gold market and "QE tapering".
Although talk of the Fed's QE tapering has caused significant short-term
fluctuations in the gold price and will no doubt continue to do so, the gold
price is likely to embark on a major advance from this year's low almost
regardless of what the Fed does from here on. The reason is that the damage (the
basis for the next major gold advance) is already in place thanks to the QE that
has happened up until now. What we've seen, to date, are the positive effects
that almost always appear during the initial phase of a monetary expansion.
These initial positive effects are why monetary inflation remains popular with
the masses despite its debilitating long-term consequences. Unfortunately, it is
never possible to know ahead of time how long the positive initial phase will
last. What we do know is that just as surely as night follows day, the negative
consequences will eventually rise to the surface. Gold benefits from these
negative consequences of monetary inflation rather than the monetary inflation
itself.
Now, the most widely known negative consequence of monetary inflation is "price
inflation" (a reduction in the purchasing power of the money). However, "price
inflation" is not the most important negative consequence. Of far greater
importance is the distortion of RELATIVE prices caused by the monetary
inflation, because it results in widespread mal-investment and an economy that
experiences slower real progress on average and larger long-term growth
oscillations. Regardless of when problematic "price inflation" is destined to
emerge in response to the Fed's aggressive monetary accommodation, the US
economy has already been seriously weakened by the price distortions stemming
from past QE and at least some of these weaknesses are likely to become apparent
before the end of this year.
From our perspective some of the weaknesses are already obvious. For example,
rather than invest in new manufacturing plant and business expansion, the flood
of new money has prompted many listed US corporations to pay high prices for
their own shares. This has helped to push stock prices upward despite minimal
earnings growth, no revenue growth and a persistently high level of unemployment
(about 15% if measured correctly). It seems, though, that the weaknesses will
have to become clearer before they are seen/appreciated by the average investor.
When that starts to happen the next major advance in the gold price will get
underway, even if the Fed happens to be "tapering" at the time.
Current Market Situation
Every price forecast is nothing more than an opinion. Nobody KNOWS what any
market price is going to be in the future. Moreover, no sensible speculator or
investor or analyst will predict future price levels with confidence.
Fortunately, successful speculating and investing have nothing to do with being
able to accurately and reliably guess future price levels.
Successful speculating and investing involve putting a much greater emphasis on
fact than opinion. For example, it's a fact that major price advances begin when
sentiment is depressed and major price declines begin when sentiment is
exuberant. You should therefore be more focused on downside risk when sentiment
is exuberant and more focused on upside potential when sentiment is depressed.
It is also a fact that sentiment in the gold and silver markets is now extremely
depressed. Actually, according to objective measures such as survey results,
momentum indicators, positions within moving-average envelopes and COT data,
sentiment is presently more depressed than it has been at any time over the past
10 years. Does this mean that you should now be focused more on upside potential
or the risk of prices breaking to new lows?
We aren't saying you should ignore downside risk. When it comes to sentiment
there are no absolutes, so ultra-depressed sentiment could become even more
depressed in the short-term. However, provided you don't put yourself in the
position whereby additional short-term price weakness will cause you to become a
forced seller or lead to a personal financial crisis, a mountain of evidence
indicates that it is a good idea to fade a widely and strongly held bearish
view.
Turning to the facts, the following weekly chart shows that the silver price is
near the bottom of its 10wk/15% MA envelope (a 15% envelope around the 10-week
MA) and that silver's weekly RSI is at a 10-year low. This doesn't guarantee
that the silver price has bottomed, but it does mean that silver's next big move
is far more likely to be to the upside than the downside.
August-2008 was the only time over the past 10 years when silver dropped to the
bottom of its 10wk/15% MA envelope and was not close to an intermediate-term
price low. However, even though buyers of silver in the immediate aftermath of
the August-2008 decline to the bottom of the MA envelope suffered large
draw-downs over the ensuing three months, they were in a profit situation within
12 months and had huge profits within three years.
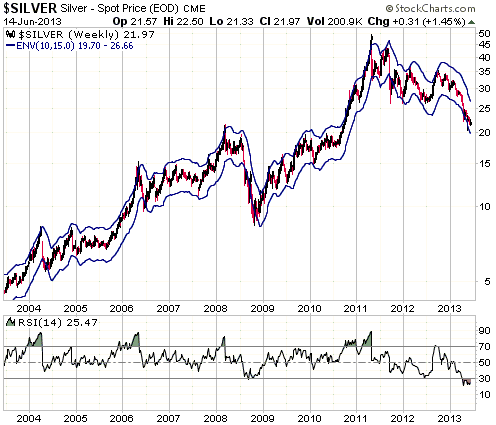
Silver is extremely 'oversold', but hasn't yet begun to show any signs of
strength. Gold, however, has demonstrated tentative strength by virtue of its
May low being slightly higher than its April low and its low during the first
half of June being slightly higher than its May low.
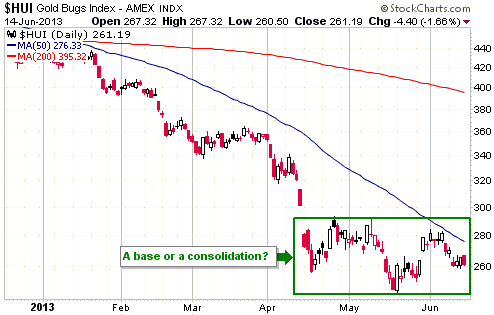
Gold Stocks
The HUI's base-building or consolidation continues. Our view is that the odds
still favour the former (basing), but the longer the price remains range-bound
the more likely it will be that we are witnessing a consolidation (continuation)
rather than a basing (reversal) pattern.
Currency Market Update
The Dollar Index broke-out to a new multi-year high last month. Considering the
extent to which it was 'overbought' at the time of the upside breakout, we
weren't surprised that the breakout didn't hold. As explained in the 27th May
Weekly Update:
"Even if the US$ is destined to move much higher over the coming year, the
Commitments of Traders (COT) data and other sentiment indicators are saying that
a multi-month US$ correction/consolidation could soon begin. Of particular note,
there are now large speculative net-short positions in euro futures, Yen
futures, A$ futures, C$ futures and British Pound futures. To put it another
way, speculators are now betting heavily that the US$ will rise against all
other major currencies over the next few months. Such unanimity of opinion
within the speculating community paves the way for something different to
happen."
Something different to what most speculators were betting on has indeed
happened. As shown below, the Dollar Index has pulled back sharply over the past
few weeks.
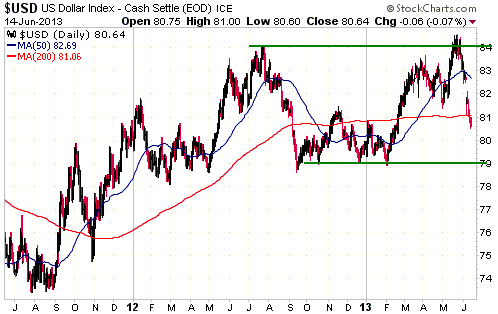
The Dollar Index is now short-term 'oversold' and probably won't fall much
further before commencing a 2-point (or thereabouts) rebound. However, the
overall US$ consolidation/correction probably isn't complete.
In order for the Dollar's decline to remain a correction within a continuing
intermediate-term upward trend as opposed to the first leg of a new
intermediate-term downward trend, support at 79 must not be breached.
Update
on Stock Selections
Notes: 1) To review the complete list of current TSI stock selections, logon at
http://www.speculative-investor.com/new/market_logon.asp
and then click on "Stock Selections" in the menu. When at the Stock
Selections page, click on a stock's symbol to bring-up an archive of
our comments on the stock in question. 2) The Small Stock Watch List is
located at http://www.speculative-investor.com/new/smallstockwatch.html
 Company
news/developments for the week ended Friday 14th June 2013: Company
news/developments for the week ended Friday 14th June 2013:
[Note: FS = Feasibility Study, IRR = Internal Rate of Return, MD&A =
Management Discussion and Analysis, M&I = Measured and Indicated,
NAV = Net Asset Value, NPV(X%) = Net Present Value using a discount
rate of X%, P&P = Proven and Probable, PEA = Preliminary Economic
Assessment, PFS = Pre-Feasibility Study]
*Endeavour Mining (EDV.TO) provided an update on the progress of
its construction-stage Agbaou gold mine in Cote d'Ivoire. The bottom
line is that the project remains on track to commence production in
early-2014. The Agbaou mine has been designed and built to have
annual production of 100K ounces.
*Energy Fuels (EFR.TO), a junior uranium producer and the owner of
the only uranium mill in the US, advised that it had closed the
equity financing announced at the end of May. The new shares were
issued at a price of C$0.14.
The company ended up increasing the size of the financing from $5M
to $6.6M due to "strong investor interest". If an equity financing
is priced at a very low level -- as was the case here -- there will
naturally be "strong investor interest".
EFR also advised that it had entered into a definitive arrangement
with regard to the previously-announced merger with Strathmore
Minerals. Completion of the merger requires shareholder approval and
is expected to happen in August.
*Golden Star Resources (GSS) reported the results of the FS for
its Prestea underground mining project. If the Prestea mine were
built, its output would be processed at the existing Bogoso oxide
plant located 16km away.
The FS indicates that it would not make economic sense to develop
Prestea at the current time, especially given GSS's need to protect
its balance sheet. Of particular relevance, at a gold price of
$1400/oz the project's NPV(5%) is less than the estimated initial
capex ($87M NPV versus $91M capex).
Our view is that Prestea will become a valuable asset after gold
makes a sustained move above $1800/oz, but near the current gold
price it has option value only.
*Jaguar Mining (JAG) has been de-listed from the NYSE, but still
trades on the TSX. The NYSE de-listing was due to the stock having
traded below US$1.00 for more than 30 consecutive trading days.
JAG's management could have avoided the de-listing by doing a
reverse stock split, but decided not to. This was a reasonable
decision. The company's management should focus on real long-term
financial solutions, not short-term cosmetic solutions.
*Pinetree Capital (PNP.TO) announced that its per-share Net Asset
Value (NAV) was C$0.95 as at 31st May. Based on the change in the
CDNX since then, PNP's current per-share NAV is probably about
C$0.91. This compares to the stock's 14th June closing price of
C$0.44.
*Sabina Gold and Silver (SBB.TO) advised that it had closed the
equity financing announced in late May. The company raised $20.6M by
issuing 14.7M new shares at C$1.40/share. 5.7M of the new shares
were purchased by Dundee Corporation.
We suspect that SBB's latest equity financing was done at the
suggestion of, and primarily for the benefit of, Dundee Corporation.
Considering that SBB was already one of the best-financed junior
gold miners prior to this financing, most other shareholders
certainly didn't benefit from having new shares issued at such a low
per-share valuation.
TSI
stocks affected by upcoming index changes
The following TSI stocks will be affected by changes to S&P/TSX and Market
Vectors indices that are slated to occur after the close of trading on Friday
21st June:
1. Asanko Gold (AKG) will be deleted from the S&P/TSX Global Gold and Global
Mining indices
2. Endeavour Mining (EDV.TO) will be deleted from the S&P/TSX Equal Weight
Global Gold Index
3. Ramelius Resources (RMS.AX) will be deleted from GDXJ
4. Pretium Resources (PVG) will be added to the S&P/TSX Composite High Beta
Index
The deletions will result in some index-related selling of the three affected
stocks late this week, but the consequences for the stock prices will largely
depend on the overall market at the time. Also, these stocks (AKG, EDV.TO and
RMS.AX) are already so under-valued that buying-on-dips by value investors could
offset any additional downward pressure exerted by index-related selling. In any
case, if you were planning to buy AKG and/or EDV.TO and/or RMS.AX it could make
sense to place under-the-market bids prior to the start of trading on Friday
21st June with the aim of catching a downward spike.
PVG's addition to the S&P/TSX Composite High Beta Index is unlikely to have a
significant effect on the stock price, but PVG is a good candidate for new
buying near its current price (US$7.94) for other reasons.
Chart Sources
Charts appearing in today's commentary
are courtesy of:
http://stockcharts.com/index.html
http://bigcharts.marketwatch.com/
http://www.fullermoney.com/

|
