|
-- Weekly Market Update for the Week Commencing 17th August 2009
Big Picture
View
Here is a summary of our big picture
view of the markets. Note that our short-term views may differ from our
big picture view.
In nominal dollar terms, the BULL market in US Treasury Bonds
that began in the early 1980s will end by mid-2010. In real (gold)
terms, bonds commenced a secular BEAR market in 2001 that will continue
until 2014-2020. (Last
update: 09 February 2009)
The stock market, as represented by the S&P500 Index, commenced
a secular BEAR market during the first quarter of 2000, where "secular
bear market" is defined as a long-term downward trend in valuations
(P/E ratios, etc.) and gold-denominated prices. This secular trend will bottom sometime between 2014 and 2020. (Last update: 22 October 2007)
A secular BEAR market in the Dollar
began during the final quarter of 2000 and ended in July of 2008. This
secular bear market will be followed by a multi-year period of range
trading. (Last
update: 09 February 2009)
Gold commenced a
secular bull market relative to all fiat currencies, the CRB Index,
bonds and most stock market indices during 1999-2001. This secular trend will peak sometime between 2014 and 2020. (Last update: 22 October 2007)
Commodities,
as represented by the Continuous Commodity Index (CCI), commenced a
secular BULL market in 2001 in nominal dollar terms. The first major
upward leg in this bull market ended during the first half of 2008, but
a long-term peak won't occur until 2014-2020. In real (gold) terms,
commodities commenced a secular BEAR market in 2001 that will continue
until 2014-2020. (Last
update: 09 February 2009)
Copyright
Reminder
The commentaries that appear at TSI
may not be distributed, in full or in part, without our written permission.
In particular, please note that the posting of extracts from TSI commentaries
at other web sites or providing links to TSI commentaries at other web
sites (for example, at discussion boards) without our written permission
is prohibited.
We reserve the right to immediately
terminate the subscription of any TSI subscriber who distributes the TSI
commentaries without our written permission.
Outlook Summary
Market
|
Short-Term
(0-3 month)
|
Intermediate-Term
(3-12 month)
|
Long-Term
(1-5 Year)
|
Gold
|
Neutral
(25-May-09)
|
Bullish
(12-May-08)
|
Bullish
|
US$ (Dollar Index)
|
Bullish
(10-Aug-09)
| Bullish
(25-May-09)
|
Neutral
(19-Sep-07)
|
Bonds (US T-Bond)
|
Bullish
(10-Aug-09)
|
Bullish
(08-Jun-09)
|
Bearish
|
Stock Market (S&P500)
|
Neutral
(27-Jul-09)
|
Bearish
(11-May-09)
|
Bearish
|
Gold Stocks (HUI)
|
Neutral
(20-May-09)
|
Bullish
(17-Jun-09)
|
Bullish
|
| Oil | Bearish
(17-Aug-09)
| Bearish
(25-May-09)
| Bullish
|
Industrial Metals (GYX)
| Bearish
(17-Aug-09)
| Bearish
(25-May-09)
| Bullish
|
Notes:
1. In those cases where we have been able to identify the commentary in
which the most recent outlook change occurred we've put the date of the
commentary below the current outlook.
2. "Neutral", in the above table, means that we either don't have a
firm opinion or that we think risk and reward are roughly in balance with respect to the timeframe in question.
3. Long-term views are determined almost completely by fundamentals,
intermediate-term views by giving an approximately equal weighting to
fundmental and technical factors, and short-term views almost
completely by technicals.
Consumer spending: the caboose, not the engine
A popular line of thinking is
that an economic recovery won't begin in earnest until consumers start
spending more money. For example, some commentators claim that a
genuine recovery won't begin anytime soon because consumer spending is
slated to remain depressed for a long time to come, whereas others
claim that the economy will soon begin to strengthen on the back of
increased consumer spending. Both sets of commentators agree that
consumer spending is the key. For its part, the government is
aggressively promoting more consumer spending on the basis that this is
the way to get the economy moving forward again.
It is obvious that economic growth goes hand-in-hand with increasing
consumer spending, but it is apparently not obvious to most people that
a greater amount of consumer spending is an EFFECT, not a cause, of
economic growth. It can never be a cause of sustained economic growth
because in order to consume more a person must first produce more. The
way it works is that people add to their savings, which leads to more
investment in the factors of production, which leads to greater
production, and, lastly, to increased consumption. That is, an increase
in consumer spending lies at the end of a process that begins with an
increase in saving. Or, to put it another way: consumer spending is the
caboose, not the engine.
It should be readily apparent to anyone who stops for a moment to think
things through that consumer spending involves taking something out of
the economy, and that if most people consistently take more out than
they put in then the economy will shrink over time. In other words,
government policies designed to boost spending and reduce saving must,
if they achieve their intended result, lead to a WEAKER economy over
the long-term. The fact that politicians go down such an illogical path
is understandable, if not excusable, given that most politicians are
only concerned with what happens to the economy between now and the
next election, but economists and newsletter writers should at least
get it right.
Commodities
Oil
Peak Oil
As we've noted in previous commentaries, Hubbert's "Peak Oil" theory
appears to be valid. It is certainly supported by observation in that
many cases can be cited where the production from an oil field or an
entire oil-producing region has gone into decline exactly as predicted
by this theory. However, we do not believe that geological limitations
to oil supply constitute a major economic issue. There are vast
untapped oil reserves in the world, and if the oil market were able to
operate freely then these reserves would probably satisfy demand for
generations to come. Furthermore, the free market would develop
economically viable alternatives well before we reached the point where
oil supply was limited by geology. In a nutshell, a sustained shortage
of a commodity as useful as energy would never occur in a free market.
Which brings us to the root of the problem: the oil market is not free.
This, and not any geological considerations, will potentially lead to
troublesome constraints on oil supply in the future. In other words, if
there is going to be an oil supply problem with grave economic
consequences then the origin of the problem will be political, not
geological.
The free market is very good at anticipating potential supply shortages
and addressing the unanticipated shortages that periodically crop up,
but governments around the world have their tentacles deeply immersed
in the oil business, from oil exploration all the way through to the
consumption of oil-based products. In particular, governments: a)
heavily regulate oil exploration and production, b) control or
influence the prices of oil and oil-based products, c) attempt to
influence energy consumption trends, d) reduce, eliminate, or
manipulate in some other way the economic incentives to expand supply,
and e) use oil as a means of gaining geopolitical advantage. Here are
some specific examples:
* The US government has a history of imposing or
threatening price controls and "windfall profit" taxes whenever there
is a large increase in the oil price, thus discouraging the oil
industry from responding in the appropriate way to price signals. The
US government also places severe restrictions on where oil drilling can
occur and is about to massively distort both the supply and the demand
for oil via its "Cap and Trade" program.
* The federal and provincial governments in Canada have a
history of changing the rules (royalties and taxes, for instance) on
the oil and gas industry, thus creating more uncertainty than there
should be.
* China consumes far more oil than it should because its
government ramps up the money supply at a rapid rate and simultaneously
caps the gasoline price at an artificially low level.
* Russia has used its control over European gas supply as a
geopolitical weapon in the past and will probably do the same in the
future.
* Some governments, the Venezuelan government being the
highest-profile example, have "nationalised" (read: stolen)
privately-owned oil production facilities and reserves, to the
detriment of oil supply.
The bottom line is that sustained shortages of useful commodities only
occur when the government inserts itself into the supply/demand
equation. The oil market is no exception, so if insufficient oil supply
becomes a serious long-term economic problem then the underlying cause
will be political, not geological.
Current Market Situation
A daily chart of September oil futures is displayed below.
As a result of Friday's $3 drop in the oil price it is beginning to
look like the oil market has just completed a successful test of its
June peak. If this is the case then the short-term downside risk is
much greater than the short-term upside potential. In our opinion, the
short-term downside risk is defined by the December and February lows
(we expect that these lows will be tested after the post-crash rebound
runs its course).
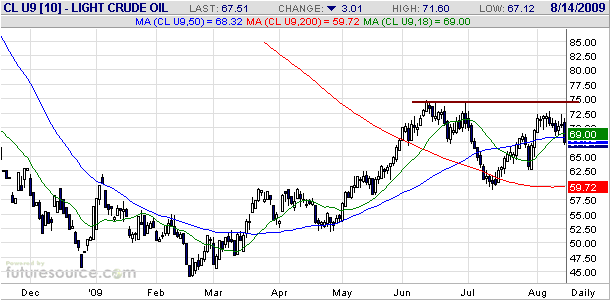
We have shifted our short-term oil outlook from "neutral" to "bearish"
on the basis that the rebound in the oil price from its early-July low
to its early-August high is looking more like a counter-trend move than
the next up-leg of an intermediate-term advance. If the nearest oil
futures contract closes above its June peak at some point over the next
few weeks then we are clearly wrong about this and will immediately
shift back to the sidelines.
Considering the economic backdrop, even if the oil price were to break
above its June peak ($75 in the September contract) we doubt that it
would make significant additional headway. However, we have learned not
to under-estimate the effects of trend-following speculation on this
market. After all, the oil price was able to rise from the $70s in
mid-2007 to the $140s in mid-2008 in parallel with deteriorating
fundamentals (rising physical supply and declining physical demand). In
that instance, speculation regarding US$ inflation was the primary
driver of the price trend.
If the oil price does break out to new highs for the year then the
catalyst will likely be a break to new lows by the Dollar Index
(improbable, but not out of the question) or rising geopolitical
tensions in the Middle East (impossible to handicap).
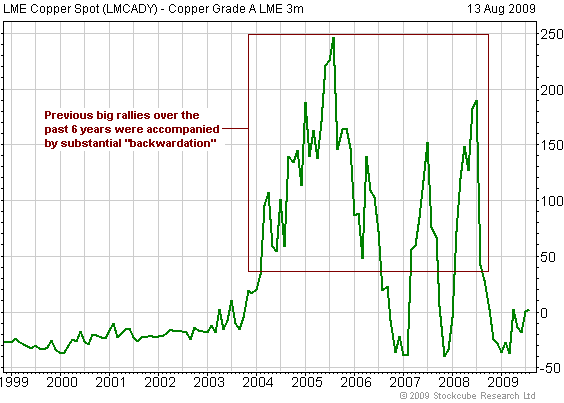
Copper
The rebound in the copper price from its December-2008 low to last
week's high was impressive, to say the least. It was all the more
impressive considering that there didn't appear to be a good
fundamental reason for it. A post-crash rebound was inevitable, and a
typical rebound following the sort of crash that occurred last year
would have taken the price back to the low-$2 area. However, the copper
price almost touched $3.00 last week.

There has been a substantial decline in the amount of copper stored in
LME warehouses, but that's only because hundreds of thousands of tonnes
of copper have been transferred from reported inventories in the West
to unreported inventories in China. It is also noteworthy that the
recent copper rally was the only copper rally of the past 6 years that
unfolded without the market moving well into "backwardation". As
evidenced by the following Fullermoney.com
chart, so far this year the copper market has only made a couple of
brief and shallow forays into "backwardation" (the chart shows the
extent of "backwardation" or "contango", with the market being in
"backwardation" when the line on the chart is above zero and in
"contango" when the line is below zero). This is a stark contrast with
other rallies of the past six years.
That copper has spent the bulk of this year in "contango" indicates
that the market has been well supplied throughout. The large run-up in
price (beyond what would have been expected for a post-crash rebound)
is therefore a puzzle.
Although the rebounds in copper and the other industrial metals should
continue until the stock market peaks, and although the odds favour the
stock market maintaining its upward bias for at least a few more weeks,
the short-term risk is now high by virtue of the speed with which
industrial metal prices have risen since early July. We have therefore
shifted our short-term outlook to "bearish".
The Stock
Market
The S&P500 Index edged
above 1000 on the 1st trading day of this month and has since traded
sideways within a narrow range. It is gradually working off its
'overbought' condition.
We think the downside risk is large enough to warrant considerable
caution, but we doubt that the market has reached anything more than an
interim peak. In our opinion, the most bullish thing it could do from
here is pull back by enough over the next 1-2 weeks to enable the
S&P500 Index to 'test' July's break above resistance (now support)
at 950, as this would most likely eliminate the 'overbought' condition
without doing any technical damage. The stage would then be set for
another -- and quite likely final -- multi-week advance.
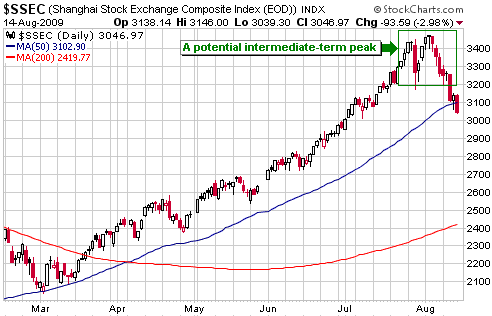
While the odds favour at least one more rise to new highs for the year,
a number of things are happening to suggest that the post-crash rebound
is nearing its conclusion. These things include the decline in the
Baltic Dry Index, the tentative signs of a US$ bottom, the relatively
high level of bullish sentiment, and the potential topping action of
the Shanghai Stock Exchange Composite Index (SSEC) as depicted below.
An intermediate-term peak for the SSEC would be confirmed by a rebound
to a lower high followed by a decline that takes out the August low.
Another development
with potentially bearish implications is the recent performance of
Wal-Mart's stock price. Wal-Mart is one of the few non-gold companies
that would likely grow its earnings, or at least maintain its earnings,
during a lengthy period of economic contraction. This probably explains
why it has moved counter to the broad stock market over much of the
past three years. For example, the following chart shows that WMT did
nothing during the final year of the global equity bull market
(Oct-2006 through to Oct-2007), trended upward during the first 11
months of the equity bear market, and went nowhere while the broad
stock market rallied between March and July of this year. On this
basis, last week's upside breakout by WMT should be construed as a
bearish omen for equities in general.
This week's
important US economic events
| Date |
Description |
Monday Aug 17
| Treasury International Capital (TIC)
Housing Market Index
| | Tuesday Aug 18 | Housing Starts
Producer Price Index
| | Wednesday Aug 19
| No important events scheduled
| | Thursday Aug 20
| Leading Economic Indicators
| | Friday Aug 21
| Existing Home Sales
Expiry of Equity Options
|
Gold and
the Dollar
Gold
Gold Seasonality
From the 20th May Interim Update: "Since
the beginning of its long-term bull market gold has tended to be flat
from late May through to mid August. In fact, during the 7-year period
from 2001 through to 2007 the average change in the gold price between
21st May and 15th August was only 3% and the maximum change was only
6%. Last year was an outlier in that it produced a 15.6% decline during
the aforementioned period."
Here are the details, updated to include this year's performance:
Year: Net Change in Spot Gold Price Between 21st May and 15th Aug:
2001 -2.8%
2002 -0.3%
2003 -2.4%
2004 +3.9%
2005 +6.0%
2006 -5.2%
2007 +0.9%
2008 -15.6%
2009 -1.0%
Clearly, gold followed its seasonal pattern over the past 12 weeks.
Let's now look at what we can expect if gold follows its seasonal
pattern over the remainder of the year.
Since the beginning of its long-term bull market gold has ALWAYS risen
between mid August and the final trading day of the year. The gain over
this period has ranged from 1.1% to 24.7%, with an average of 11.4%.
Moreover, even last year's September-November crash failed to prevent
gold from keeping this perfect record intact. Here are the details:
Year: Net Change in Spot Gold Price Between 15th Aug and 31st Dec:
2001 +1.1%
2002 +10.5%
2003 +14.4%
2004 +9.6%
2005 +17.0%
2006 +2.1%
2007 +24.7%
2008 +12.0%
In other words, the seasonal pattern represents a tailwind for gold over the remainder of the year.
Current Market Situation
The following daily chart of December gold futures shows the pattern of
falling highs and rising lows that has been forming since February. If
the pattern continues then the gold price will make its way down to the
$920s over the coming fortnight.
A daily close ABOVE the early-June high or BELOW the early-July low
would break the pattern and project significant additional movement in
the direction of the breakout.
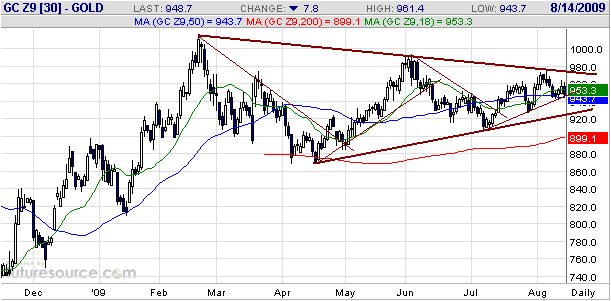
Based on the
assumption that the pattern will continue in the immediate-term and
ultimately conclude via an upside breakout, traders should consider
taking a long position IF the gold price drops to the $920s within the
next three weeks. Risk could then be managed by placing a sell stop
just below $900.
Silver versus Gold
As discussed many times in TSI commentaries over the years, the
silver/gold ratio tends to function as an indicator of financial and/or
economic confidence in that silver tends to out-perform gold when
confidence is rising and under-perform gold when confidence is falling.
As a result, we expect that silver will do well relative to gold until
the stock market reaches an intermediate-term peak, after which it will
become relatively weak. For this reason, SLV (the silver ETF) put
options would provide a means of hedging a portfolio heavily laden with
gold- and silver-related investments.
This is just something to bear in mind. The best way for most people to
hedge is by maintaining a large cash reserve, but it could also make
sense over the next couple of months to average into out-of-the-money
SLV puts, with expiry dates of January-2010 or later, during periods
when silver is firm.
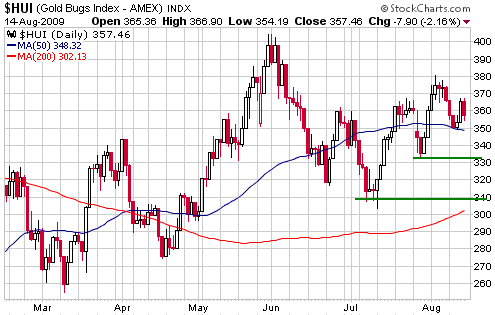
Gold Stocks
It's possible that a good short-term buying opportunity will evolve in
the gold sector over the coming 1-2 weeks. The opportunity would be
created by gold bullion dropping back to the $920s while the HUI
dropped back to near support in the 330s or the 310s. We suspect that
it would take simultaneous weakness in the broad stock market and the
bullion market to push the HUI down to lower of these support areas.
Although we don't
have a financial interest in the stock, we always keep a close eye on
Royal Gold (RGLD) because it tends to be a leading indicator for gold
stocks in general.
The following chart shows that RGLD peaked on the first trading day of
this year and has since established a sequence of declining tops. A
daily close above $48 would break this sequence and indicate that the
overall sector had commenced, or was about to commence, its next
intermediate-term upward trend.
On a very short-term basis, a quick decline to around $35 would create a buying opportunity for traders.

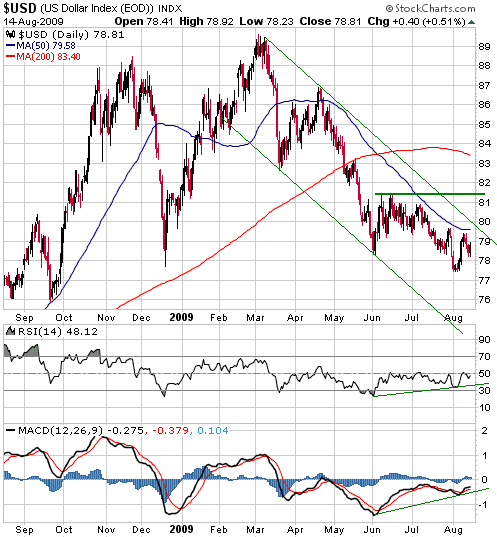
Currency Market Update
We think that the Dollar Index has been going through a bottoming
process over the past three months. The early-August low was slightly
below the early-June low, but the drop to new lows for the year near
the beginning of this month was not confirmed by the momentum
indicators displayed at the bottom of the following chart, or by the
Baltic Dry Index, or by the Swiss Franc, or by the gold market, or by
the oil market.
Preliminary price-related confirmation of a Dollar Index bottom would
be consecutive daily closes above 80, as this would break the Dollar
Index above its 50-day moving average and its downward-sloping channel.
More conclusive evidence of a bottom would be provided by a solid daily
close above resistance at 81.5.
Update
on Stock Selections
(Note: To review the complete list of current TSI stock selections, logon at http://www.speculative-investor.com/new/market_logon.asp
and then click on "Stock Selections" in the menu. When at the Stock
Selections page, click on a stock's symbol to bring-up an archive of our comments on the stock in question)
Chart Sources
Charts appearing in today's commentary
are courtesy of:
http://stockcharts.com/index.html
http://www.futuresource.com/
http://www.fullermoney.com/

|