![]()
![]()
![]()
![]()
-- Weekly Market Update for the Week Commencing 17th August 2015
Big Picture
View
Here is a summary of our big picture
view of the markets. Note that our short-term views may differ from our
big picture view.
The BULL market in US Treasury Bonds that began in the early 1980s ended in early-2015, but there will be many years of topping action in bond prices and bottoming action in bond yields before major new trends get underway. (Last update: 29 June 2015)
The stock market, as represented by the S&P500 Index, commenced a secular BEAR market during the first quarter of 2000, where "secular bear market" is defined as a long-term downward trend in valuations (P/E ratios, etc.) and gold-denominated prices. This secular trend will bottom sometime between 2018 and 2020. (Last update: 29 June 2015)
A secular BEAR market in the US Dollar began during the final quarter of 2000 and ended in July of 2008. This secular bear market will be followed by a multi-year period of range trading. (Last update: 09 February 2009)
Gold commenced a secular bull market relative to all fiat currencies, the CRB Index, bonds and most stock market indices during 1999-2001. This secular trend will peak sometime between 2018 and 2020. (Last update: 29 June 2015)
Commodities,
as represented by the CRB Index, commenced a
secular BULL market in 2001 in nominal dollar terms. The first major
upward leg in this bull market ended during the first half of 2008, but
a long-term peak won't occur until 2018-2020.
(Last
update: 29 June 2015)
Copyright
Reminder
The commentaries that appear at TSI
may not be distributed, in full or in part, without our written permission.
In particular, please note that the posting of extracts from TSI commentaries
at other web sites or providing links to TSI commentaries at other web
sites (for example, at discussion boards) without our written permission
is prohibited.
We reserve the right to immediately
terminate the subscription of any TSI subscriber who distributes the TSI
commentaries without our written permission.
Outlook Summary
|
Market |
Short-Term (1-3 month) |
Intermediate-Term (6-18 month) |
Long-Term (2-5 Year) |
| Gold | N/A |
Bullish (26-Mar-12) |
Bullish |
| US$ (Dollar Index) | N/A |
Neutral (22-Jun-15) |
Neutral (19-Sep-07) |
| US Treasury Bonds (TLT) | N/A |
Neutral (18-Jan-12) |
Bearish |
| Stock Market (DJW) | N/A |
Bearish (28-Nov-11) |
Bearish |
| Gold Stocks (HUI) | N/A |
Bullish (23-Jun-10) |
Bullish |
| Oil | N/A |
Bullish (17-Dec-14) |
Bullish |
| Industrial Metals (GYX) | N/A |
Bullish (22-Jun-15) |
Bullish (28-Apr-14) |
4. Long-term views are determined almost completely by fundamentals and intermediate-term views
are determined by a combination of fundamentals, sentiment and technicals.
Last week's posts at the TSI Blog
Bearish divergences at gold-mining bottoms
Facts,
Opinions, and Risk Management
Gold's safe-haven
status is not in doubt
Gold is very different from all
other commodities. This is due to physical characteristics that caused it to be
money for thousands of years and led to its aboveground supply becoming orders
of magnitude greater than its annual production*. However, despite the huge size
of its existing aboveground supply relative to the rate at which new supply is
created, that is, despite its massive stocks-to-flow ratio, gold is still a
commodity and its US$ price is still affected by the overall trend in commodity
prices. In particular, a major decline in commodity prices will naturally put
downward pressure on the gold price and a major advance in commodity prices will
naturally put upward pressure on the gold price. That's why gold's performance
can be most clearly 'seen' by comparing it to the performances of other
commodities, with the most appropriate comparison being with 'non-monetary'
metals**. Such a comparison reveals that gold has performed exactly as a safe
haven should have performed given the economic and financial-market backdrops.
In particular and with reference to the following chart, we point out that the
gold/GYX ratio (the gold price relative to the price of a basket of industrial
metals) rocketed upward from mid-2007 through to early-2009 in response to the
global financial crisis and severe economic recession of the period. The
early-2009 high was an all-time high, which was a reflection of an extremely low
level of general confidence in economic prospects and the abilities of central
banks. The gold/GYX ratio then pulled back sharply as the crisis abated and an
economic recovery got underway, but it stopped declining in the first half of
2010. Since then it has been making lower highs and higher lows, with a
euro-zone (EZ) crisis causing a rise to just below the all-time high in
2011-2012, the semblance of economic stability in both the EZ and the US causing
a steady slide from late-2012 through to late-2014, and the re-emergence of
fears regarding EZ stability causing a couple of bounces over the past 9 months.
At the end of last week the gold/GYX ratio was near a 2-year high and close to
the middle of the wide range that was established during 2009-2010. Note that by
historical standards this wide range is at an elevated level.
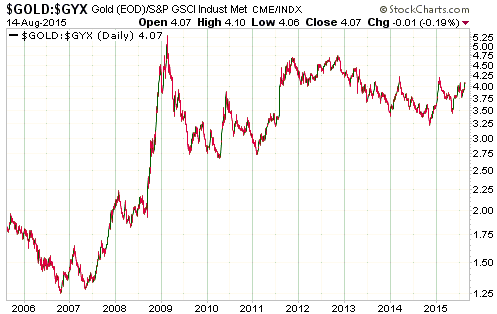
There is currently a higher-than-average amount of confidence in the Fed, the US
stock market and the US economy, which suggests to us that the gold/GYX ratio is
now as high as it should be. However, we strongly believe that this confidence
is misplaced and will erode over time, causing the gold/GYX ratio to break above
its 2009 peak.
Unfortunately, we can't predict when it will happen. We thought that it would
have happened by now, but, despite a lot of evidence to the contrary, a critical
mass of people remains convinced that better economic times lie around the next
corner.
*Gold's aboveground supply is so large relative to annual
mine production that changes in the latter can safely be ignored when looking
for price clues.
**Gold is no longer money in the true meaning of the word,
but it still trades as if it were.
The Stock Market
The US
It was more of the same in the US stock market last week. The price action has
been tedious for many months and last week continued the pattern.
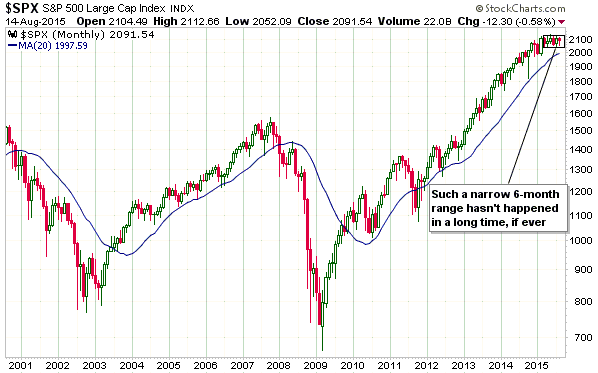
In one respect the lack of S&P500 (SPX) movement over many months is
interesting. We are referring to the fact that it is rare for the SPX to trade
sideways for so long and it is unprecedented with regard to the past 15 years.
The following monthly chart helps to illustrate what we mean.
Short-term indicators of market sentiment are presently as neutral as the
S&P500's price action. Some reveal optimism, but others reveal sufficient
fear/pessimism to suggest the potential for a significant multi-week rally.
The put/call situation is an example of the latter. The 10-day MA of the equity
put/call ratio (a short-term indicator of 'dumb money' sentiment) has just risen
to a 3-year high at the same time as the 10-day MA of the OEX put/call ratio (a
short-term indicator of 'smart money' sentiment) is not far from a 3-year low.
This is bullish because it suggests that the 'dumb money' has become very
concerned about short-term downside risk at the same time as the 'smart money'
is less concerned than usual. The 'dumb money' has undoubtedly been influenced
by the proliferation of crash forecasts over the past couple of months.
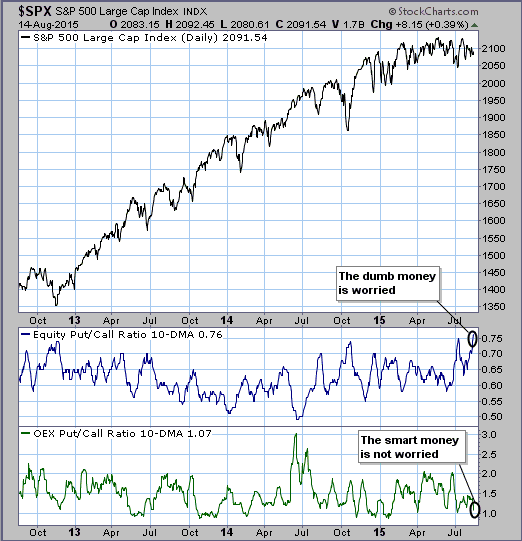
We currently put the probability of a crash during this year's September-October
'crash season' at only slightly more than zero, although there is still time for
a crash setup to develop.
Australia
Commodity production is a big part of the Australian economy, but while the
large across-the-board decline in commodity prices has been the catalyst for a
large decline in the Australian Dollar it hasn't yet had a big effect on the
Australian stock market. The Australian stock market, as represented by the All
Ordinaries Index (AORD), has declined over the past few months, but only by
enough to take AORD to the bottom of the narrow upward-sloped channel that has
defined its progress over the past 2.5 years.
As far as we can tell (we closely follow some Australian stocks, but not the
broad market), the rally of the past few years has been led by the financial
sector.
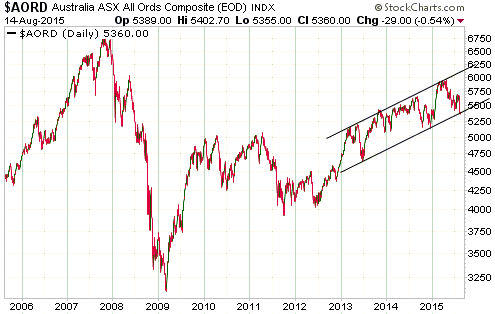
It would be normal for AORD to rebound from its channel bottom over the days
ahead, but as is the case with the US market the Australian market appears to
have short-term downside potential of at least 10%.
A recovery in the commodity world could end up supporting the Australian stock
market, but, as happened in 2011 when there was a shift in upside leadership
from commodity to non-commodity stocks, a return to upside leadership by
commodity-related equities would probably be associated with a substantial
correction in the broad market.
This week's
significant US economic events
[Notes:
1) The most important events
(to the markets) are shown
in bold. 2) A list of global economic events can be found
HERE]
| Date | Description |
| Monday Aug 17 |
Housing Market Index TIC Report Empire State Mfg Survey |
| Tuesday Aug 18 | Housing Starts |
| Wednesday Aug 19 |
CPI FOMC Minutes |
| Thursday Aug 20 |
Existing Home Sales Philadelphia Fed Business Outlook Survey Leading Economic Indicators |
| Friday Aug 21 | No important events scheduled |
Gold and the Dollar
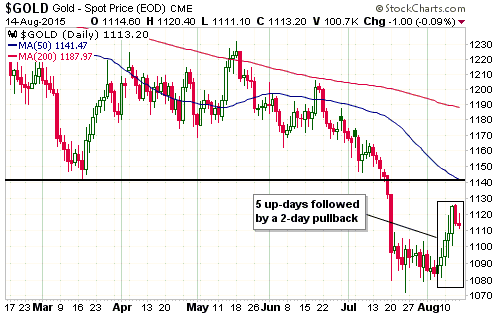
The Price Action
The US$ gold price rose for 5 trading days in a row ending last Wednesday and
then pulled back over the final 2 days of the week. The pullback was neither
surprising nor significant.
Gold's Commitments of Traders (COT) situation remains bullish and the upside
breakout during the first half of last week from a narrow 2-3 week sideways
trading range was confirmed by the gold-mining sector. This means that
additional gains are likely over the weeks ahead.
As previously advised, former support (now resistance) at $1135-$1140 is the
most realistic initial upside target. We will take the rally one step at a time
and consider higher upside targets if/when this resistance is tested.
Gold Stocks
Strong and sudden multi-day price rebounds can mark the beginnings of new bull
markets, but they can also occur within powerful downward trends. For example,
there were a few short and sharp rebounds during the 2008 stock-market collapse.
At this early stage we therefore can't rule out the possibility that the
gold-mining sector's sharp rebound during the first three days of last week is
just a counter-trend bounce. However, due to the magnitude and duration of the
preceding decline it makes sense to give the benefit of the doubt to the
possibility that an intermediate-term reversal has just happened.
Following the 3-day surge during Monday-Wednesday of last week there could have
been an extension of the rally, but a pullback was equally likely. A pullback
occurred over the final two days of the week.
The most likely near-term outcome is that the rally resumes during the first
half of this week. As mentioned in last week's Interim Update, the initial
upside target for the HUI is former support (now resistance) at 145.
The junior end of the gold-mining sector, which is represented on the following
daily chart by GDXJ, has been relatively strong. For example, whereas the HUI
made a new low in early-August, GDXJ bottomed in July, and whereas last week's
HUI high was well below its 50-day MA, GDXJ reached its 50-day MA before pulling
back.
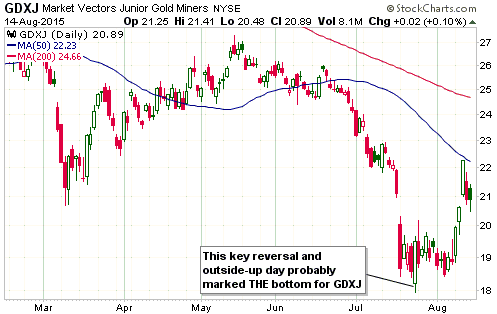
For both GDXJ and the HUI, closing above last Wednesday's high would be an
important additional piece of evidence that an intermediate-term bottom was in
place.
The Currency Market
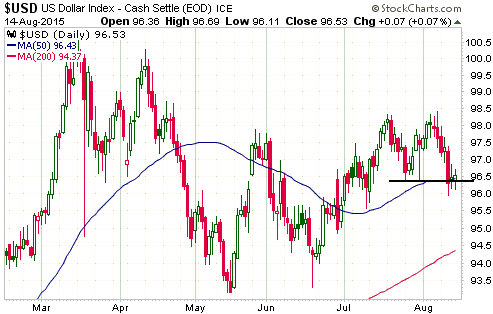
The Dollar Index wasn't able to sustain last Wednesday's marginal breach of
support at 96.3, but the short-term bias still appears to be to the downside.
There was certainly nothing bullish about last week's performance.
We suspect that the Dollar Index is on its way back to the low-90s.
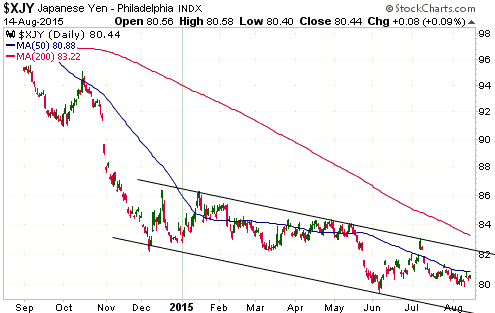
The Yen's performance over the past several months has been almost as dull as
the S&P500's. The only significant difference is that whereas the S&P500 has
traded sideways, the Yen has had a slight downward bias.
If the Yen can close a week above its early-July rebound peak (around 83) it
would not only confirm that a short-term bottom was in place, it would also be a
clear sign that this currency's multi-year decline was over. That, of course, is
a big 'if'. Getting above 83 would require a gain of only 3.5% from here, but
over the past three weeks the Yen has been unable to move by more than 1% in
either direction.
Last week, the change in the China government's exchange-rate policy garnered a
massive amount of media attention and roiled the financial world for 1-2 days.
The policy change is significant, but nowhere near as significant as it was made
out to be. Like many events in the financial markets, it was overhyped in order
to attract readers/viewers and sell subscriptions.
Contrary to popular opinion, the 2% Yuan devaluation implemented by China's
government probably had nothing to do with trying to stimulate exports. This is
because even a 10% devaluation would have minimal effect on export volume and
because senior Chinese policymakers would not want to encourage additional
capital outflows (a likely consequence of expected devaluation). As explained in
last week's Interim Update, it was probably about trying to avoid the tightening
of monetary conditions that would be required to keep the Yuan at an
artificially high level.
Lost in much of the hyperbolic commentary provoked by last week's policy change
was the fact that, due to the actions taken in China to create the impression of
stability, the Yuan had held its ground against the US$ since the middle of last
year while almost every other currency in the world tanked. This left the Yuan
at an unrealistically-high level, especially relative to the currencies of other
"emerging-market" economies. For example, here are charts showing the large
reductions in the values of the Brazilian Real and the Malaysian Ringgit
relative to the US$ (a rising line on these charts indicates devaluation). Since
the middle of last year the Real has lost 37% of its value relative to the US$
and the Ringgit has lost 23% of its value relative to the US$.
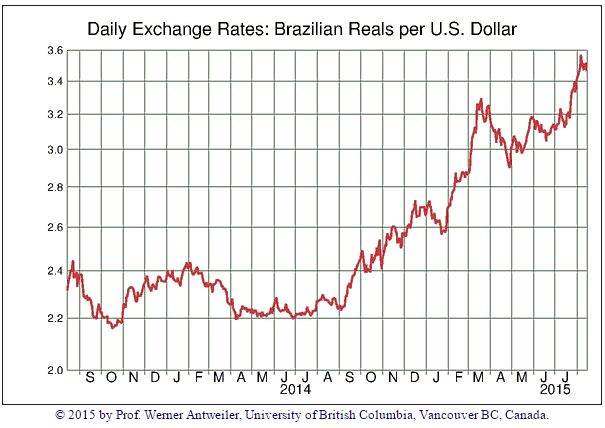
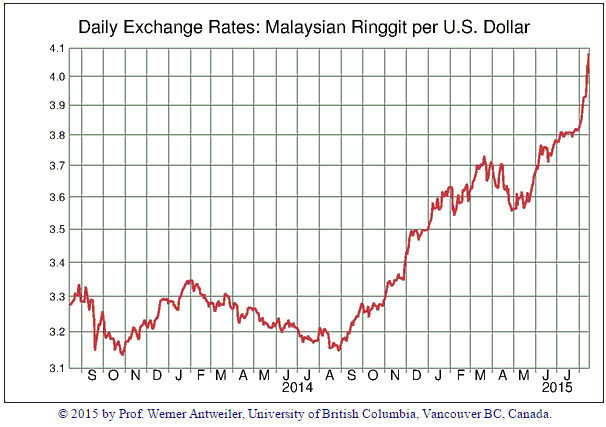
As a result of last week's 'dramatic' devaluation and market reaction the Yuan
is now down by about 3% relative to the US$ since the middle of last year.
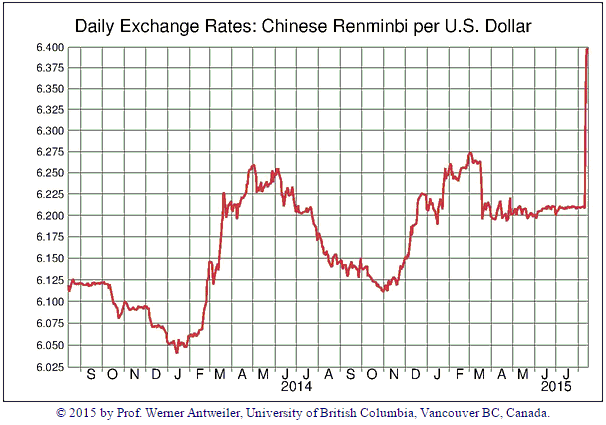
The Yuan is very over-valued and has a long way to fall, but the fall will
probably happen in slow motion.
Updates
on Stock Selections
Notes: 1) To review the complete list of current TSI stock selections, logon at
http://www.speculative-investor.com/new/market_logon.asp
and then click on "Stock Selections" in the menu. When at the Stock
Selections page, click on a stock's symbol to bring-up an archive of
our comments on the stock in question. 2) The Small Stock Watch List is
located at http://www.speculative-investor.com/new/smallstockwatch.html
![]() Company
news/developments for the week ended Friday 14th August 2015:
Company
news/developments for the week ended Friday 14th August 2015:
[Note: AISC = All-In Sustaining Cost, FS = Feasibility Study, IRR = Internal
Rate of Return, MD&A = Management Discussion and Analysis, M&I = Measured and
Indicated, NAV = Net Asset Value, NPV(X%) = Net Present Value using a discount
rate of X%, P&P = Proven and Probable, PEA = Preliminary Economic Assessment,
PFS = Pre-Feasibility Study]
*Almaden Minerals (AAU) published its financial statements for the
June quarter. The Almadex spinout happened subsequent to the quarter-end, so the
current balance sheet will be materially different from the published balance
sheet.
Taking into account the effects of the spinout, we estimate that AAU presently
has a bit less than C$6M of working capital. This is probably only enough to
fund the company for another 6-9 months, so it is reasonable to expect that AAU
will raise additional money before year-end. We suspect that it will do a
$3M-$5M equity financing, but there are other possibilities.
*Almadex Minerals (AMZ.V), the recent spinout from AAU, began
trading on the TSXV on Friday 14th August.
AMZ currently holds the following assets:
- A 100-per-cent interest in the El Cobre project in Mexico.
- A portfolio of 21 other exploration projects.
- A 2-per-cent net-smelter-return (NSR) royalty on the Tuligtic property in
Mexico.
- A portfolio of 21 additional NSR royalties on exploration projects in Mexico,
Canada and United States, identified through Almaden's past prospect generator
activities.
- Equity holdings in several publicly listed companies.
- 1,597 ounces of gold bullion.
- C$3-million in cash.
What's all this worth?
Valuation of the cash plus bullion is straightforward. At the current gold price
it is about C$5.3M. With 44M shares on issue, this amounts to about
C$0.12/share.
The 2% NSR royalty on the Tuligtic project is the asset with the highest
potential value. For example, if Tuligtic were put into production at the
planned 260K-oz/year rate then at a gold price of $1300/oz the 2% NSR would
generate about US$6.8M/year of cash. A cash-flow-producing royalty such as this
on a mine with a life of at least 12 years would probably be worth about US$50M,
or C$1.47 per share. However, in the current market with the project still at
least a few years from production and taking into account the risk that the
project will never go into production, the royalty is worth very little. We
assign a nominal value of C$2M.
In the current market all of the remaining assets combined would be worth no
more than the C$2M nominal value assigned to the Tuligtic royalty.
We therefore come up with a very rough estimate of C$9.3M for AMZ's current
value. This equates to C$0.20/share. Note that if we use the accounting values
in AAU's financial statements rather than our own assumptions, AMZ's estimated
value comes to C$10.9M. This equates to about C$0.25/share.
There was almost no trading in AMZ shares on Friday, but the small amount of
trading that happened was at C$0.19-C$0.20 and the stock closed at C$0.20. The
current market price is therefore at what we perceive to be fair value. At this
price AMZ is neither a sell nor a buy.
We think that AMZ would be a reasonable -- albeit very speculative -- buy near
the value of its cash-plus-bullion, which is currently C$0.12. And although it
has huge long-term upside potential linked to the possibility that the Tuligtic
project will be put into production, at this time we would view it as a
short-term sell above C$0.30.
For TSI record purposes we are going to consider the Almadex spinout as a
capital return for Almaden shareholders. At Friday's closing price of
C$0.20/share for AMZ, the per-share return to AAU shareholders amounts to C$0.12
(US$0.09). Also, due to its huge long-term upside potential and well-regarded
management, we have put AMZ into the TSI Small Stocks Watch List.
*Asanko Gold (AKG) published its financial results for the June
quarter. According to these results the company had US$204M of working capital
and US$124M of long-term debt at 30th June. This compares with US$208M of
working capital and US$59M of long-term debt at 31st March, which indicates that
the company spent about US$69M during the latest quarter.
The rapid pace of spending is not a surprise, because AKG is rapidly advancing
Phase 1 of the Asanko Gold Mine (AGM) into production. Commercial production at
the design rate of 190K ounces/year is on track to be achieved early next year.
AKG remains fully-funded through to production.
We continue to like AKG because it offers substantial leverage to the gold price
(our estimate of fair value rises from US$1.50/share to US$3.00/share with an
increase in the gold price to $1300/oz) but doesn't need a higher gold price to
ensure its survival or justify its current stock price.
*Dalradian Resources (DNA.TO) issued its financial report for the
quarter ending 30th June 2015. The report showed that the company had C$33.5M of
working capital at 30th June, which is down from C$44M at 31st March. This is
enough to fully fund the company's aggressive work program for at least the next
12 months.
The next important milestone for DNA is the completion of a PFS at its
Curraghinalt gold project in Northern Ireland. The PFS milestone is expected to
be achieved late this year.
*Endeavour Mining (EDV.TO, EVR.AX) reported drilling results from
its Agbaou gold project in Ivory Coast, West Africa. Numerous significant
intercepts were reported, including 16.47 g/t over 8.3 metres and 12.15 g/t over
9.4 metres.
The results suggest that the project's reserves are going to expand and that the
mine-life is going to be extended. This is very good news, because Agbaou is
EDV's highest-margin operation.
*Premier Gold (PG.TO) published its financial results for the June
quarter. According to these results the company had about C$90M of working
capital and no long-term debt at 30th June. Obviously, a very strong financial
position.
PG had previously advised that it expected to end this year with C$75M of
working capital and to end next year with about C$100M of working capital
assuming an average gold price of US$1200/oz in 2016. Next year's expected
working-capital increase is due to PG becoming a gold producer courtesy of its
40% stake in the South Arturo project.
*Pilot Gold (PLG.TO) published its financial statements for the
June quarter. The most important number for an exploration-stage mining company
is the working capital, which in PLG's case was about US$12.7M at 30th June. At
the current rate of spending this would be enough to fund the company for about
12 months, although we suspect that PLG's management will look for an
opportunity to top-up the treasury before year-end.
*Pretium Resources (PVG) has optioned some properties from Teuton
Resources. The properties adjoin PVG's Brucejack project.
At $1.8M to be paid over four years, the cost of optioning these properties is
financially insignificant to PVG. However, the deal could have significant
long-term value in that exploration work carried out to date suggests geological
similarities between these properties and the Brucejack project.
*Sabina Gold and Silver (SBB.TO) published its financial
statements for the June quarter. Based on these statements and taking into
account the spending that would have happened since the end of June, the company
probably now has about C$21M of working capital. This should be enough to fully
fund the business for at least one more year or until a decision is made to
commence mine construction.
The next important milestone for SBB is the completion of a Feasibility Study
for a smaller-scale mining operation at the Back River project, which is
targeted for next month.
![]() List
of candidates for new buying
List
of candidates for new buying
From within the ranks of TSI stock selections the best candidates for new buying
at this time, listed in alphabetical order, are:
1) EDV.TO in the mid-C$0.50s (last Friday's closing price: C$0.59)
2) EVN.AX (last Friday's closing price: A$1.00)
3) PLG.TO (last Friday's closing price: C$0.40)
4) SBB.TO (last Friday's closing price: C$0.38)
5) TGD (last Friday's closing price: US$0.27)
Note that the above list is limited to five stocks. It will sometimes contain
less than five, but it will never contain more than five regardless of how many
stocks are attractively priced for new buying.
Chart Sources
Charts appearing in today's commentary
are courtesy of:
http://stockcharts.com/index.html
Pacific Exchange Rate Service
http://research.stlouisfed.org/