|
-- Weekly Market Update for the Week Commencing 17th September 2012
Big Picture
View
Here is a summary of our big picture
view of the markets. Note that our short-term views may differ from our
big picture view.
In nominal dollar terms, the BULL market in US Treasury Bonds
that began in the early 1980s will end by 2013. In real (gold)
terms, bonds commenced a secular BEAR market in 2001 that will continue
until 2014-2020. (Last
update: 23 January 2012)
The stock market, as represented by the S&P500 Index,
commenced
a secular BEAR market during the first quarter of 2000, where "secular
bear market" is defined as a long-term downward trend in valuations
(P/E ratios, etc.) and gold-denominated prices. This secular trend will bottom sometime between 2014 and 2020.
(Last update: 22 October 2007)
A secular BEAR market in the Dollar
began during the final quarter of 2000 and ended in July of 2008. This
secular bear market will be followed by a multi-year period of range
trading.
(Last
update: 09 February 2009)
Gold commenced a
secular bull market relative to all fiat currencies, the CRB Index,
bonds and most stock market indices during 1999-2001.
This secular trend will peak sometime between 2014 and 2020.
(Last update: 22 October 2007)
Commodities,
as represented by the Continuous Commodity Index (CCI), commenced a
secular BULL market in 2001 in nominal dollar terms. The first major
upward leg in this bull market ended during the first half of 2008, but
a long-term peak won't occur until 2014-2020. In real (gold) terms,
commodities commenced a secular BEAR market in 2001 that will continue
until 2014-2020.
(Last
update: 09 February 2009)
Copyright
Reminder
The commentaries that appear at TSI
may not be distributed, in full or in part, without our written permission.
In particular, please note that the posting of extracts from TSI commentaries
at other web sites or providing links to TSI commentaries at other web
sites (for example, at discussion boards) without our written permission
is prohibited.
We reserve the right to immediately
terminate the subscription of any TSI subscriber who distributes the TSI
commentaries without our written permission.
Outlook Summary
Market
|
Short-Term
(1-3 month)
|
Intermediate-Term
(6-12 month)
|
Long-Term
(2-5 Year)
|
|
Gold
|
Neutral
(10-Sep-12)
|
Bullish
(26-Mar-12)
|
Bullish
|
|
US$ (Dollar Index)
|
Neutral
(17-Sep-12)
|
Neutral
(09-Jan-12)
|
Neutral
(19-Sep-07)
|
|
Bonds (US T-Bond)
|
Bearish
(02-Jul-12)
|
Neutral
(18-Jan-12)
|
Bearish |
|
Stock Market
(DJW)
|
Bearish
(30-Jul-12)
|
Bearish
(28-Nov-11)
|
Bearish
|
|
Gold Stocks
(HUI)
|
Neutral
(17-Sep-12)
|
Bullish
(23-Jun-10)
|
Bullish
|
|
Oil |
Neutral
(30-Jul-12)
|
Neutral
(31-Jan-11)
|
Bullish
|
|
Industrial Metals
(GYX)
|
Neutral
(30-Jul-12)
|
Neutral
(29-Aug-11)
|
Neutral
(11-Jan-10)
|
Notes:
1. In those cases where we have been able to identify the commentary in
which the most recent outlook change occurred we've put the date of the
commentary below the current outlook.
2. "Neutral", in the above table, means that we either don't have a
firm opinion or that we think risk and reward are roughly in balance with respect to the timeframe in question.
3. Long-term views are determined almost completely by fundamentals,
intermediate-term views by
fundamentals, sentiment and technicals, and short-term views by sentiment and
technicals.
An Appropriate Quote
The great H.L. Mencken wrote:
"As democracy is perfected, the office of president represents, more and more
closely, the inner soul of the people. On some great and glorious day the plain
folks of the land will reach their heart's desire at last and the White House
will be adorned by a downright moron."
Democracy in the US clearly reached Mencken's "perfection" with George W Bush's
rise to the presidency and has since remained perfect. However, it occurred to
us late last week that with a few minor tweaks the above quote could apply just
as well to central banking. Specifically:
"As central banking is perfected, the office of Fed chairman represents, more
and more closely, the inner soul of the people. On some great and glorious day
the plain folks of the land will reach their heart's desire at last and the
Federal Reserve will be adorned by a downright moron."
There is no longer any doubt that central banking achieved Mencken's
"perfection" with the ascent of Ben Bernanke to the role of Fed chairman.
Fed Up
So, the Fed has done what we thought it would
have enough sense not to do at this time. The US now has "QE3". The Fed has said
it will purchase $40B per month of mortgage-backed securities, indefinitely.
This is being done to "put downward pressure on longer-term interest rates,
support mortgage markets, and help to make broader financial conditions more
accommodative." Interest rates are at generational lows, but the Fed believes
that what the US economy really needs right now are lower interest rates.
Suppressing interest rates to below their market level hurts savers and helps
debtors. At least, it helps the debtors that are able to borrow at the
artificially low rates. The federal government is by far the biggest debtor
capable of taking advantage of the artificially low rates, so the government is
clearly the biggest beneficiary of the policy. It is therefore fair to say that
the Fed's policy brings about a transfer of wealth from private savers to the
federal government. No good economist would view such a wealth transfer as a net
benefit to the economy. It is also unethical. Bad economics and bad ethics --
that's what the Fed is all about.
In the good old days (prior to this year, that is), the Fed would wait for a
deflation scare before opening the monetary spigots. This latest inflation
program therefore marks a huge change in strategy. This change in strategy, as
opposed to the dollar value of the new inflation program, is the most important
aspect of last week's decision by the Fed. More specifically, $40B per month of
debt monetisation is not a big deal in the grand scheme of things (as many
deflationists will probably point out), but it is a big deal that the Fed has
introduced a new inflation program at a time when there is no sign of any price
deflation and when the rate of monetary inflation is already high.
To help illustrate the difference between the latest "QE" and the earlier
programs, we present two charts. The first chart is from
Fullermoney.com and shows the spread
between the yields on standard 10-year T-Notes and "inflation-protected" 10-year
T-Notes (10-year TIPS). We call this yield spread the "Expected CPI" because it
reflects the market's expectations of how the CPI will change over the years
ahead. In a nutshell, it is an indicator of inflation expectations. Notice that
when the earlier QE programs were initiated the Expected CPI had either just
fallen to a 12-month low (in the case of QE2) or just plummeted to a multi-year
low (in the cases of QE1.1 and QE1.2), but that the latest program is kicking
off with the Expected CPI having just risen to near a multi-year high. The
second chart shows that when the earlier programs were initiated the S&P500
Index was 'oversold' and either near a 12-month low or long-term low.
This is so extraordinary that we have to ask, in all seriousness: what were they
smoking at last week's FOMC meeting?
They probably weren't smoking anything. It's clear that Ben Bernanke and most
other members of the FOMC truly believe that the economy can be strengthened,
and a sustainable improvement in the labour market brought about, by
counterfeiting money and manipulating interest rates. The root of the problem is
unwavering commitment to bad economic theory, so that when the economy doesn't
respond as expected to a certain dosage a higher dosage is automatically
considered appropriate. It never occurs to the good doctors that they have their
diagnosis completely wrong. How could it when they are, in effect, astronomers
trying to make sense of the planetary movements based on the theory that
everything revolves around the Earth.
The bottom line is that when this latest program doesn't achieve the intended
results, it won't be perceived by the Fed as a failure of "monetary
accommodation". It will, instead, be perceived as a failure due to insufficient
monetary accommodation and therefore as a reason for an even higher dose of the
same bogus remedy. This process is likely to continue until price inflation is
widely perceived as a major problem.
The process outlined above was well underway prior to last week, but last week's
Fed decision marks a material acceleration. This is bullish for gold and very
bearish for the US economy.
The Stock
Market
Although we didn't think it was the most
likely outcome, the recent extension of the US stock market's short-term upward
trend helps with the inter-market puzzle. As stated in the 20th August Weekly
Update:
"If the stock market were able to hold up (avoid falling out of bed) for
another 2-3 months it would allow the pieces of the inter-market puzzle to fit
more neatly than they do right now. For starters, 2-3 months of additional stock
market stability would pave the way for a strong euro rebound and the unwinding
of the huge net-short position in euro futures, thus creating a set-up for the
next US$ rally. For seconds, 2-3 months of additional stock market stability
would enable T-Bond futures to fall far enough to become 'oversold' on an
intermediate-term basis, thus setting the stage for T-Bonds to subsequently
benefit from a 'flight to safety' as stocks trended downward."
The monetary change that occurred last week has altered the short-term
probabilities such that the US stock market is likely to do no worse than
experience a routine (no more than 5%) pullback over the next couple of weeks
and generally be stable or firm for another 1-2 months. That being said, one of
the difficulties in assessing the stock market's short-term risk/reward in the
wake of the Fed's new bout of stupidity is that previous "QEs" were initiated
when the stock market was very 'oversold' and at or near a 12-month low. As
discussed above, the latest QE is unprecedented in that it is commencing with
the stock market 'overbought' and near a multi-year high. This not only makes
the short-term price direction even more unpredictable than usual, it means that
we have no history to draw upon when assessing risk versus reward. Whereas
previous QEs were followed by multi-month advances, there's a decent chance that
the latest QE will do no more than prolong the market's topping process. That's
why we have left our short-term stock market outlook as "bearish".
To further explain our stance, the probability of substantial short-term
downside has certainly been reduced by the Fed's new inflation program. This is
because stock prices are quoted in currency units that the central bank appears
to be in a hurry to depreciate. But while a sizeable short-term decline now has
a lower probability, the risk hasn't been eliminated. Due to this risk we think
it makes sense to remain hedged and/or to add some hedges. We are currently
hedged via a 30% cash reserve and a small position in VIX call options. We will
be looking for opportunities over the weeks ahead to increase our cash reserve.
Moving on, here's something to file in the "interesting but of unknown
significance" file. The Dow Transportation Average (TRAN) has lagged the Dow
Industrials Index by a widening margin over the past several months, leading to
a definitive "Dow Theory" non-confirmation. The non-confirmation was in place
prior to last week, but is now more pronounced due to last week's rise by the
Industrials to a new 52-week high and the on-going sideways drift in the
Transports. A daily chart of TRAN is shown below.
According to "Dow Theory", the non-confirmation is a bearish warning signal. We
don't view it as bearish, because we've seen no evidence that "Dow Theory"
signals provide reliable information about the future. We do find it
interesting, however, that the Transportation sector of the stock market
continues to show few signs of life. We could cite the lacklustre performance of
the TRAN as proof that the economy is deteriorating even as the senior stock
indices rally on the back of monetary inflation, but that would be self-serving
given that TRAN proved itself to be a poor economic indicator during 2007-2008.
This week's
important US economic events
| Date |
Description |
| Monday Sep 17 |
Empire State Mfg Survey
| | Tuesday Sep 18 |
Q2 Current Account Balance
Housing Market Index
TIC Report
| | Wednesday Sep 19 |
Housing Starts
Existing Home Sales | | Thursday
Sep 20 |
Philadelphia Fed Survey
Leading Economic Indicators
|
| Friday Sep 21 |
Quadruple Witching
|
Gold and
the Dollar
Gold
Considering what the Fed did last week, the reaction of the US$ gold price was
small. The gold price gained 2% over the course of the week, which isn't to be
sneezed at but at the same time isn't particularly impressive in light of the
monetary development. This shows that even though we weren't expecting the Fed
to do anything immediately, most traders were. Obviously there was a lot of QE
anticipation built into the market prior to last week.
The QE anticipation is evident in the Commitments of Traders (COT) data that
were released on Friday. The latest COT numbers reveal that the total
speculative net-long position in COMEX gold futures was 237K contracts as of
Tuesday 11th September. This reflects an increase of almost 100K contracts over
the preceding 5 weeks. The next set of COT data won't be published until this
coming Friday, but it is reasonable to assume that the speculative net-long
position is now at least 250K contracts (close to the 12-month high reached at
the end of February). This simply means that there are now a lot more short-term
traders involved in the gold market on the 'long' side than there were a few
weeks ago. Many of these new short-term bulls will be shaken out of the market
during the next correction.
Resistance at $1800 still appears to be a reasonable near-term target, but we
doubt that gold will do much better than that before commencing a multi-week
correction. The 50-day moving average (MA) is the most plausible downside target
for this correction. This MA is currently at $1635, but it is rising rapidly and
could easily be in the high-$1600s by the time it meets the market price.
Silver is in a similar position to gold, except that it is more 'overbought'.
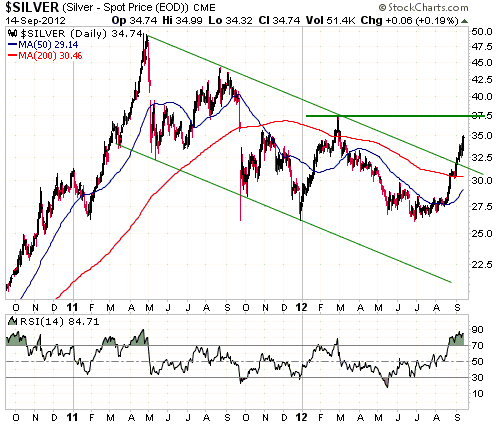
The next short-term buying opportunities in gold and silver will be created by
pullbacks to near the respective 50-day moving averages.
Could gold and silver do better than we expect over the next several weeks as a
consequence of the Fed's monetary profligacy? Yes, but that possibility is not a
concern. It is never a concern to us when a market that we have substantial
exposure to does better than we expect. We are only concerned when the market we
happen to be 'long' does worse than expected. We therefore spend a lot more time
pondering what could go wrong than what could go right.
Gold Stocks
HUI Scenarios Update
When the HUI was near its bottom during May and when it was testing its bottom
during July we said there was a good chance of a recovery to 550 by October,
which seemed farfetched at the time considering that 550 was 47% above the May
low and 43% above the July low. However, 550 by October no longer seems
farfetched given that it is only 7% above last Friday's closing price.
"550 by October" wasn't a forecast, and if the HUI makes it up to 550 within the
next few weeks it won't indicate any prescience on our part. We never pretend to
know what's going to happen in the future. Our point was simply that if the HUI
did what it did the last two times it became dramatically oversold during the
month of May then it would be back at 550 by October.
As a result of the price action of the past two weeks we are left with two
plausible scenarios with regard to the HUI's likely performance over the next 12
months. There are actually many other possible outcomes, but the two
possibilities that we are now going to mention have by far the highest
probabilities assuming that past is prologue. These scenarios were also
considered to have the highest probabilities in early June when we first
outlined them. They are:
1. The intermediate-term upward trend that began in May of 2012 won't end prior
to May of next year, but there will be multi-week corrections of as much as 20%
along the way.
2. The intermediate-term upward trend that began in May of 2012 will end during
October-November of this year. The gold sector will then trend downward to an
intermediate-term bottom in the second quarter of next year.
Scenario 1 was originally thought to have the higher probability. That's still
the case. In fact, last week's decision by the Fed increased the probability of
Scenario 1 relative to Scenario 2.
Current Market Situation
The bullion market's reaction to the Fed's new inflation program was muted, but
the reaction of the gold-stock indices was far more impressive. The HUI cut
through resistance at 480-500 like a sharp knife through soft butter and ended
the week at a 6-month high. The HUI/gold ratio also ended the week at a 6-month
high.
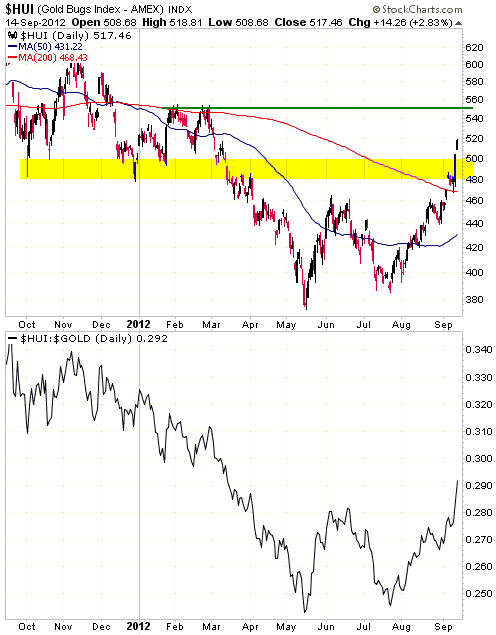
The HUI is likely to make significant additional gains before an
intermediate-term peak is in place, but the short-term downside potential is now
almost as large as the remaining short-term upside potential. That's why we've
shifted our short-term HUI outlook from "bullish" to "neutral".
Regardless of whether it begins immediately or three weeks from now (it will
almost certainly begin within three weeks), the gold sector's next downward
correction will likely take the HUI back to its 50-day moving average (MA). This
MA is currently way down at 431, but it has begun to rise and its rate of ascent
should accelerate over the next few weeks. It's probable that by the time the
HUI next meets up with its 50-day MA, the MA will be in the 460s.
Buying and selling opportunities will emerge in individual gold stocks
independently of the HUI and the other gold-stock indices, but the next
sector-wide buying opportunity will occur when the HUI drops to the vicinity of
its 50-day MA.
Some junior gold/silver mining stocks have made large gains since their May-July
bottoms, but many others have only made small gains or haven't even begun to
recover. It should be remembered that the juniors are called late-stage stocks
for a reason: they tend to achieve the bulk of their gains during the second
halves of intermediate-term advances. As an upward trend matures, market
participants become more confident in its sustainability and gravitate towards
riskier stocks.
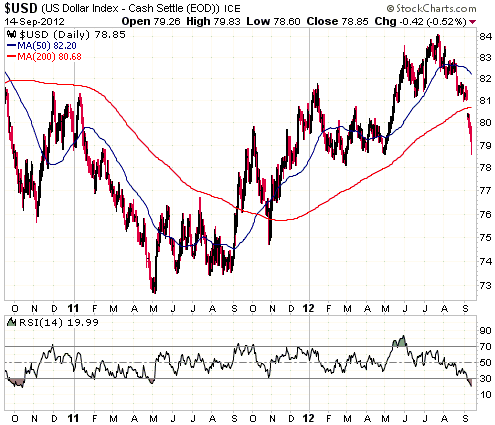
Currency Market Update
Our short-term US$ outlook shifted to "bullish" last week on the basis that
there was the potential for an 'oversold' bounce to as high as 83 (about 3
points of upside potential) and that there was downside risk to around 79 (about
1 point of downside risk). As a result of last week's action the Dollar Index is
now even more 'oversold'. In fact, according to the RSI displayed at the bottom
of the following daily chart it is now more 'oversold' than it has been at any
time since September-October of 2010. However, the Fed news has changed the
risk/reward equation. There is a good chance of a US$ bounce within the next
couple of weeks, but the downside risk is now greater (although still not
substantial) and the next bounce will likely be followed by a decline to new
lows for the year. Our short-term US$ outlook has therefore shifted back to
"neutral".
Update
on Stock Selections
Notes: 1) To review the complete list of current TSI stock selections, logon at
http://www.speculative-investor.com/new/market_logon.asp
and then click on "Stock Selections" in the menu. When at the Stock
Selections page, click on a stock's symbol to bring-up an archive of
our comments on the stock in question. 2) The Small Stock Watch List is
located at http://www.speculative-investor.com/new/smallstockwatch.html
 Company
news/developments for the week ended Friday 14th September 2012: Company
news/developments for the week ended Friday 14th September 2012:
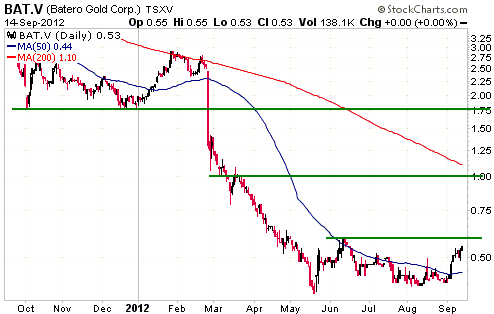
*Batero Gold (BAT.V) reported the results from seven infill drill holes.
Six of the seven holes contained good intercepts, with the best
results being 96.6m of 1.14-g/t gold starting from 3.4m below the
surface, 97.4m of 1.00-g/t gold starting from 2.6m below the
surface, and 167m of 0.91-g/t gold starting from 3.2m below the
surface.
In the wake of the disappointing resource estimate published early
this year, BAT changed plans and set about defining a smaller and
shallower pit than originally envisaged. The primary focus is now on
a piece of land roughly 600m long by 200m wide by 200m deep,
containing oxide ore (from surface to a depth of about 70m) and
transition ore.
The plan change makes sense for a number of reasons. First,
financing a larger operation in the current market environment would
be somewhere between difficult and impossible. Second, the best
grades at Batero's La Cumbre deposit tend to be in the top 150m of
the deposit. Third, metallurgical testing yielded gold recoveries of
93%-94% for mineralization in the Oxide Zone and recoveries of
82%-86% in the Transition Zone, whereas initial recoveries for the
deeper Sulfide Zone were much lower. Fourth, a smaller/shallower
operation could be brought into production more quickly. In a
nutshell, it became clear that the company's best chance of
generating good returns for shareholders was to focus on the top
200m of the deposit.
While BAT's exploration and engineering work is now focused on a
shallower hole, the stock price is still near the bottom of a deep
hole (see chart below). This is bad for existing shareholders, but
means that there is a lot of upside potential for buyers near the
current low price.
Our main concern at this time is that BAT will need to do another
financing within the next few months. Due mainly to this financing
risk, we would only put a small amount of new money into BAT shares
at this time.
*Clifton Star Resources (CFO.V) announced that the option payments it is
obligated to make to the current owners of its Duparquet project
(CFO has the option to earn 100% of the project by making certain
payments) have been renegotiated to substantially reduce this year's
obligation and spread the balance more evenly over the next five
years. Previously, CFO was required to make option payments of $22M
on 1st Dec 2012 and $30M on 1st Dec 2017. The new payment schedule,
which CFO can choose to accelerate, is:
-$2-million and 250,000 shares on Dec. 1, 2012
-$10-million on Dec. 1, 2014
-$10-million on Dec. 1, 2015
-$15-million on Dec. 1, 2016
-$15.2-million on Dec. 1, 2017
This new payment schedule enhances CFO's financial flexibility, but
we understand that CFO still has the right to borrow $22M from
Osisko (OSK) to cover option payments. The right to borrow $22M from
OSK was part of an earlier joint-venture agreement between the two
companies and remained applicable after the JV was ended.
Furthermore, the $22M could be repaid by issuing shares to OSK at a
deemed price of C$3.12/share. That is, our understanding is that CFO
is entitled to $22M of funding from OSK at C$3.12/share, with the
money to be used to make option payments.
So, there are two important events coming up for CFO over the next
four months. The first -- unless OSK is able to wriggle out of its
commitment -- is the receipt of a $22M financing effectively priced
at $3.12/share. The second is the completion of a Preliminary
Economic Assessment (PEA).
If you currently don't own any CFO shares and you can tolerate the
stock's risk and lack of liquidity, then you should consider taking
a small position ahead of the upcoming news.
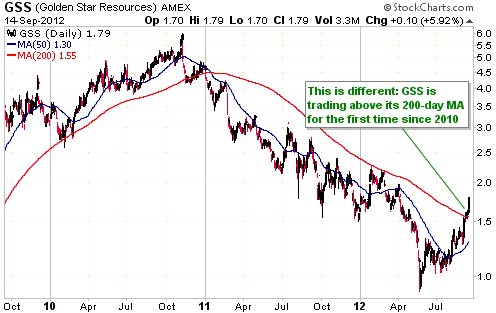
*Golden Star Resources (GSS) announced that it had redeemed $6M of the
convertible notes that were due to be repaid on 30th November 2012,
leaving a balance of $44M. The remaining $44M is expected to be
repaid using the company's existing cash.
*Jaguar Mining (JAG) appointed David Petroff as its new CEO. Mr. Petroff
has a good C.V. and probably wouldn't have trouble finding a
top-level job in the junior mining realm, so the fact that he has
chosen to work for JAG is a plus for the company.
If JAG's management successfully completes its three-stage cost
reduction program by early next year (as currently scheduled) and
substantially reduces debt by making an asset sale then JAG's share
price could rebound to at least US$3.50 even with no additional gain
in the gold price. That's the upside potential, but there is also
considerable risk due mainly to the present weak state of the
company's balance sheet.
*Pinetree Capital (PNP.TO) reported that its per-share net asset value
was C$1.74 as at 31st August. Due to price changes since then it
would probably now be C$1.85-$1.90.
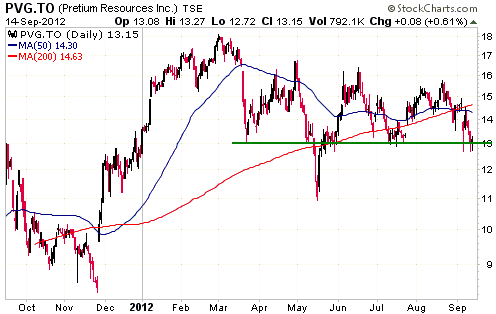
*Pretium Resources (PVG) has followed the typical 'bad-news-plunge' price
pattern despite the sector-wide rally and the Fed's yeoman-like
efforts to increase the wealth of gold investors. The bad news in
this case was the surprisingly-low resource re-estimate reported on
Friday 7th September.
As explained in our 10th September commentary: "It usually isn't
a good idea to buy a stock in the immediate aftermath of
company-specific negative news. Even if the news isn't bad enough to
alter an overall bullish trend (as in PVG's case), the first rebound
after the news-related plunge is usually followed by a decline to
successfully test or breach the initial low. If PVG traces out the
typical pattern then Friday's low (C$12.70) will be tested or
breached after a rebound runs its course."
We just got the test of the 7th September low. It's too soon to tell
if the test will be successful, but this is a reasonable time/price
to buy some PVG shares if you currently don't own any.
*Ramelius Resources (RMS.AX) reported very good drilling results from
below one of the historical open pits at its Mt Magnet gold-mining
operation. The results included 11m of 10.85-g/t gold and 12m of
12.14-g/t gold. We don't yet know the significance of these results.
In particular, we don't know the extent to which they expand the
mineable gold resource.
The same press release confirmed that the Mt Magnet mine was on
track to reach its targeted 80K-oz/yr production rate in December.
*Rio Novo Gold (RN.TO) reported the resignation of its CEO. We don't know
why the stock market reacted negatively to this news, as the
just-resigned CEO was sub-par (based on performance) and his
replacement (Julio Carvalho) has the potential to be much better.
The new CEO certainly has a wealth of experience, having previously
been CEO of Peak Gold Limited (now New Gold), Executive Vice
President of South and Central America of Goldcorp, President and
CEO of Mineracao Onca Puma Ltda. (the Brazilian subsidiary of Canico
Resource Corp.), and Chief Financial Officer and Executive Director
for Rio Tinto Brasil.
*Volta Resources (VTR.TO) reported another -- and likely final for this
year -- round of drilling results for its Kiaka South prospect. The
results were generally positive, with best gold intercepts of 6.95m
@ 11.59g/t, 32.00m @ 4.44g/t and 15.00m @ 3.87g/t. The first
resource estimate for Kiaka South will now be done.
Reducing
exposure to West Africa
There are a lot of interesting gold-mining companies operating in West Africa.
This part of the world still seems to have an abundance of untapped exploration
potential and in many cases the stocks of West-Africa-based gold miners appear
to be very under-valued. That's why the TSI Stocks List now contains several
West-Africa-focused gold mining companies. We are referring to Endeavour Mining
(EDV.TO, EVR.AX), Golden Star Resources (GSS), Keegan Resources (KGN), Resolute
Mining (RSG.AX) and Volta Resources (VTR.TO). There are good reasons to be
bullish on each of these stocks at their current prices, but it's not good that
our list of stock selections has so much exposure to a single moderately-risky
region that appears to be headed in the wrong direction on the risk scale.
There are two main reasons for our view that West Africa is headed in the wrong
direction on the risk scale. First, this year's events in Mali (a military coup,
a civil war, inroads being made by well-armed Islamic fundamentalists) suggest
that democratically elected governments in that part of the world have a tenuous
hold on power. After all, prior to this year Mali was generally thought to be
one of the most politically stable of West Africa's nation states. Second,
governments in West Africa are becoming increasingly aggressive in their efforts
to take a bigger share of the profits earned by gold mining companies. For one
example, in its 2012 budget the government of Ghana increased the corporate tax
rate on miners from 25% to 35% and introduced a 10% windfall profits tax. The
windfall tax has since been delayed and could ultimately be abandoned, but it is
clear that tax policy in Ghana, which is reputedly the best country in West
Africa to operate a gold mining business, is being driven by the belief that the
miners are rolling in money and that "the people" deserve more of this money. If
only the miners really were rolling in money. For a second example, a spokesman
for the Cote d'Ivoire government said last week that a windfall profits tax on
gold miners would be put in place "to ensure the country benefits from higher
world prices for the precious metal". These governments don't understand that if
they implement windfall profit taxes then investment in the mining industry will
dry-up and overall tax revenues will end up declining. Mining is a very cyclical
business. If the opportunity to earn a lot of money near the peak of the cycle
is taken away then so is the incentive to invest.
At this stage we plan to maintain significant exposure to West Africa via gold
stocks that have attractive risk/reward ratios (taking into account the
increasing political risk), but our short-term goal is to reduce the number of
West-Africa-focused stocks in the TSI List from 5 to 3. We are going to start
immediately by exiting Resolute Mining (RSX.AX), a long-time inclusion in the
TSI List. We have made numerous suggestions to buy RSG shares and numerous
suggestions to take partial profits on RSG shares over the years, but this one
will go into the books as a profit of 106% based on its price when it first
appeared in the TSI List (March of 2005) and last Friday's closing price of
A$1.88.
We have chosen to exit RSG because its flagship Syama project is in Mali, which
has turned out to be one of the riskiest countries in the region. EDV.TO will
also have significant exposure to Mali after it completes its takeover of Avion
Gold, but with EDV's current production coming from three separate West-African
countries it is less vulnerable to a major problem in any one country. In a
market and political environment in which everything went well for RSG, EDV
would also do very well. And in terms of valuation and growth potential, RSG and
EDV look quite similar.
The bottom line is that with EDV picking up significant Mali exposure via its
Avion purchase, it doesn't make sense for us to have both EDV and RSG in the TSI
List. RSG is the one to go because its stable of assets is less diverse and
riskier.
Short-term
GDXJ trade closed out
In the 10th September Weekly Update we wrote that for TSI record purposes we
would exit the short-term GDXJ trading position if GDXJ traded at $23.90. This
price was achieved on Thursday 13th September, so the trade has been closed at a
profit of 22.9% (based on the 25th June entry price of $19.45).
Index
changes to be aware of
At the end of last week Standard and Poors (S&P) announced
changes to various Canadian (S&P/TSX) equity indices that become effective
after the close of trading on 21st September. Here's how members of the TSI
Stocks List will be affected:
1. Endeavour Mining (EDV.TO) will be added to the S&P/TSX Global Gold Index and
will therefore have to be purchased by some index-tracking funds late this week,
which could give the stock price a boost.
2. GPD.TO, JAG.TO, ORV.TO, PNP.TO and VTR.TO will be deleted from the S&P/TSX
SmallCap Index, which could put some downward pressure on these stocks late this
week. One way to take advantage of this situation would be to place an
under-the-market buy order for an affected stock prior to the start of trading
on Friday 21st September with the aim of catching a downward spike caused by the
selling of index trackers. Upward and downward spikes caused by index changes
are often retraced in full during the ensuing trading day.
Previously it was announced that Ramelius Resources (RMS.AX) would be removed
from one of the S&P/ASX indices at the close of trading on 21st September, which
could result in some downward pressure on RMS's stock price late this week.
Chart Sources
Charts appearing in today's commentary
are courtesy of:
http://stockcharts.com/index.html
http://www.fullermoney.com/

|
