|
-- Weekly Market Update for the Week Commencing 17th October 2011
Big Picture
View
Here is a summary of our big picture
view of the markets. Note that our short-term views may differ from our
big picture view.
In nominal dollar terms, the BULL market in US Treasury Bonds
that began in the early 1980s ended in December of 2008. In real (gold)
terms, bonds commenced a secular BEAR market in 2001 that will continue
until 2014-2020. (Last
update: 4 April 2011)
The stock market, as represented by the S&P500 Index, commenced
a secular BEAR market during the first quarter of 2000, where "secular
bear market" is defined as a long-term downward trend in valuations
(P/E ratios, etc.) and gold-denominated prices. This secular trend will bottom sometime between 2014 and 2020. (Last update: 22 October 2007)
A secular BEAR market in the Dollar
began during the final quarter of 2000 and ended in July of 2008. This
secular bear market will be followed by a multi-year period of range
trading. (Last
update: 09 February 2009)
Gold commenced a
secular bull market relative to all fiat currencies, the CRB Index,
bonds and most stock market indices during 1999-2001. This secular trend will peak sometime between 2014 and 2020. (Last update: 22 October 2007)
Commodities,
as represented by the Continuous Commodity Index (CCI), commenced a
secular BULL market in 2001 in nominal dollar terms. The first major
upward leg in this bull market ended during the first half of 2008, but
a long-term peak won't occur until 2014-2020. In real (gold) terms,
commodities commenced a secular BEAR market in 2001 that will continue
until 2014-2020. (Last
update: 09 February 2009)
Copyright
Reminder
The commentaries that appear at TSI
may not be distributed, in full or in part, without our written permission.
In particular, please note that the posting of extracts from TSI commentaries
at other web sites or providing links to TSI commentaries at other web
sites (for example, at discussion boards) without our written permission
is prohibited.
We reserve the right to immediately
terminate the subscription of any TSI subscriber who distributes the TSI
commentaries without our written permission.
Outlook Summary
Market
|
Short-Term
(0-3 month)
|
Intermediate-Term
(3-12 month)
|
Long-Term
(1-5 Year)
|
| Gold
|
Neutral
(22-Sep-11)
|
Neutral
(24-Jan-11)
|
Bullish
|
| US$ (Dollar Index)
|
Bullish
(12-Oct-11)
| Bullish
(12-Oct-11)
|
Neutral
(19-Sep-07)
|
| Bonds (US T-Bond)
|
Neutral
(19-Sep-11)
|
Bearish
(24-Aug-11)
|
Bearish
|
| Stock Market (S&P500)
|
Bearish
(17-Oct-11)
|
Neutral
(24-Aug-11)
|
Bearish
|
| Gold Stocks
(HUI)
|
Bullish
(04-Oct-11)
|
Bullish
(23-Jun-10)
|
Bullish
|
| Oil | Neutral
(31-Jan-11) | Neutral
(31-Jan-11)
| Bullish
|
| Industrial Metals
(GYX)
| Bearish
(19-Sep-11)
| Neutral
(29-Aug-11)
| Neutral
(11-Jan-10)
|
Notes:
1. In those cases where we have been able to identify the commentary in
which the most recent outlook change occurred we've put the date of the
commentary below the current outlook.
2. "Neutral", in the above table, means that we either don't have a
firm opinion or that we think risk and reward are roughly in balance with respect to the timeframe in question.
3. Long-term views are determined almost completely by fundamentals,
intermediate-term views by giving an approximately equal weighting to
fundamental and technical factors, and short-term views almost
completely by technicals.
Monetary Inflation Update
Monthly US money supply data for September became available late last week, so we have updated our TMS (True Money Supply) charts accordingly. Here are charts showing the year-over-year and three-month (annualised) growth rates for TMS.
Taken at face value, the US monetary inflation backdrop remains very supportive of equity and commodity prices in US$ terms. However, the inflation backdrop is not as supportive as it superficially appears to be, the reason being that part -- perhaps the largest part -- of the recent growth spurt in the US money supply is due to dollars moving from Europe to the US.
Bear in mind, though, that without the recent shift in dollar location there would still have been substantial growth in the US money supply over the past 12 months. In other words, the shift in dollar location is not masking monetary deflation. Far from it.
Energy Fuels
Oil
In the 14th February 2011 Weekly Update, we wrote: "...oil has a lot of upside potential AND a lot of downside risk. The upside potential is primarily due to politics and monetary inflation, while the downside risk is associated with economic weakness, the potential for a large decline in the stock market, the fact that the oil market is well supplied at this time, and the possibility that new drilling technology will affect the oil market similarly to how it has affected the natural gas market." With respect to oil's risk versus reward, little has changed over the intervening eight months.
We've never been supporters of the theory that the world is about to run out of oil due to geological constraints on oil production. It is true that many of the major oil fields discovered over the past 60 years have reached or are close to reaching their peak levels of production, but when markets are free there is never a sustained shortage of anything that many people find useful and are prepared to pay for. Therefore, the market, if left to its own devices, would address an oil shortage risk a long time before it became a big problem. The new drilling technology that is in the process of revolutionising oil and gas production in North America is one example of how the market deals with such issues.
The oil supply threat doesn't stem from geological limitations, it stems from the fact that the oil market is not remotely close to being free. That's why we say that politics is one of the two main factors creating upside potential in the oil price. Politics, whether related to the restrictions that are placed on drilling or the nationalisation of oil-production businesses or the short-sighted and inefficient way in which State-owned oil facilities are managed or civil unrest in the Middle East and North Africa or international conflict in the Middle East, is what limits or seriously threatens to limit global oil supply.
Based solely on our economic outlook we would be intermediate-term bearish on oil right now and would have been bearish on oil over the past 6 months, but the downside risk due to slowing global growth must be weighed against the fact that politics creates large and ever-present upside potential. If nothing else happens on the political front to disrupt the oil supply or cause speculators to anticipate a supply disruption, the resumption of the revolutionary trend in the Middle East will probably do it within the next 12 months.
Politics and US monetary inflation continue to be supportive factors in the oil market. With Bernanke at the helm of the Fed and tensions in the Middle East seemingly never far from the boiling point, you'd have to be reckless to hold a large naked short position in oil futures. Such a bet could pay off, just like playing Russian Roulette could pay off if you are lucky.
The chart displayed below shows that oil (West Texas Intermediate Crude) has substantial support at around $70. This support probably defines the downside risk with regard to the next three months. Over the same period the upside will probably be limited to the mid-$90s, assuming that there isn't a flare-up in the Middle East. In other words, in the absence of a Middle-East-related supply shock the oil market probably won't do much over the next few months.
Natural Gas
There is a tendency for the natural gas (NG) price to rally from a September-October low. With NG futures having made a new low for the year last week and with the US east coast likely to experience a colder-than-average winter, the stage is now set for a seasonal rally. However, due to the fact that this year's low prices did not bring about a reduction in NG drilling activity, something more than a 2-4 month seasonal rebound does not appear to be 'on the cards'.
The stocks of drilling services companies provide investors with the lowest-risk exposure to both oil and natural gas. These stocks should do relatively well, as a group, as long as E&P companies are aggressively exploring the potential of shale formations, which means that they should do relatively well for at least a couple more years.
The August-October stock market decline created good opportunities to establish or add to positions in drilling services stocks such as PDS, but the rebound since the 4th October bottom has been so furious that it doesn't make sense to buy right now. Hopefully, a better buying opportunity will emerge during November.
Uranium
The spot uranium (U3O8) price (the solid line on the chart displayed below) fell 30% during the 5-month period following the Fukushima disaster, but at this stage the disaster does not appear to have significantly reduced the long-term demand for uranium. It looks like Japan and Germany will end up with less nuclear power generation capacity than would have been the case in the absence of the disaster, but the countries that were expected to account for the bulk of the growth in nuclear power usage prior to the disaster have not changed course. This is no doubt because nuclear power generation is the only economically viable alternative to fossil-fuel power generation for cities in most parts of the world.
For the uranium mining business, the long-term contract price for U3O8 (the dotted line on the following chart) is more important than the spot price. The long-term contract price is only down by about 12% from the high reached during the first quarter of this year, so uranium mining fundamentals are not a lot worse today than they were during the weeks leading up to the Fukushima disaster. However, most uranium mining stocks are down by 50-80% from their first quarter highs.
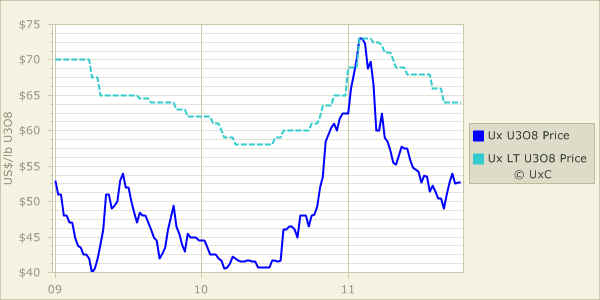
Chart Source: www.uxc.com
The huge decline in the price of the average uranium mining stock relative to the price of uranium has created an excellent opportunity to accumulate the stocks of uranium miners, but it's an opportunity with a non-quantifiable duration. This means that there is no telling when the market will begin to bring stock prices back into line with the long-term fundamentals. The re-rating might have already begun, given that the uranium sector has rebounded strongly along with most other stock market sectors over the past two weeks. Alternatively, we could still be many months away from the start of a sustainable advance.
Quotes of the Week
"As we now get daily news reports from Occupy Wall Street, where the object of ire is not just banks but also those that are in the 1% wealth/earnings category, I felt the need for factual purposes just to list some of the publicly traded companies that were founded by billionaires and the amount of employees working at companies that were founded by them. Microsoft, Oracle, Walmart, Las Vegas Sands, Amazon, Google, Dell, Nike, News Corp, Apple, Echo Star, Estee Lauder, EBAY, Ralph Lauren, Franklin Resources, Carnival Cruise, Viacom, Limited Brands, Intel, Charles Schwab, MGM Resorts, Wynn Resorts, Cablevision, Dolby, Waste Management, Republic Services, Autonation, Best Buy, Salesforce.com, Direct TV, Home Depot, FedEx, Paychex, Marriott, AOL, Starbucks, Chesapeake Energy, Qualcom, Yahoo, Progressive and Vornado. The above 42 companies employ a combined 4,000,000+ people globally. I fully understand the frustration of many as our country goes through a difficult time and I dont want to get political in this note on whos to blame. I just wanted to put some faces behind these billionaires and corporations they built and I cant imagine our world without them."
- Barry Ritholtz (www.ritholtz.com)
"When things began to disintegrate, no one dared to take away the punchbowl. They feared shutting off the monetary heroin would lead to riots, civil war, and, worst of all communism. So, realizing that what they were doing was destructive, they kept doing it out of fear that stopping would be even more destructive."
- Art Cashin (from a discussion of the Weimar Republic's hyperinflation)
The Stock
Market
The 1937-1942 Model Update
The idea behind the 1937-1942 Model that we've been tracking over the past few years is that the US stock market's performance following the major peak of Oct-2007 would be roughly in line with its performance following the major peak of Mar-1937. The chart displayed below shows the relevant comparison. Note that on this chart, the horizontal axis is the number of weeks from the major peak and the vertical axis is the percentage change since the major peak.
The current market overshot to the downside during the first quarter of 2009, possibly in reaction to the general realisation that the government's role would expand at an even faster rate under the newly elected administration than it had under the preceding administration. The rally that followed the Q1-2009 bottom then overshot in a big way to the upside, undoubtedly because there was a lot more monetary inflation during 2009-2011 than there was during 1938-1940.
The Model predicts that the US stock market will work its way downward to a major low during 2012-2013. Due to the amount of monetary inflation that has already occurred, the next major low will likely be well above the March-2009 low.
Current Market Situation
Last week's price action increased the probability that a multi-month bottom was put in place on 4th October, but it has resulted in the market becoming very 'overbought' by some measures. For example, the following chart shows that the NASDAQ's McClellan Oscillator is now as high as it was in early July, just prior to the start of a sizeable decline.
Our guess is that there will be a pullback that retraces up to half of the advance of the past fortnight and then a move to a new multi-week high before the next bear-market leg gets underway. However, there's a realistic chance that the coming "pullback" will do a lot more than retrace up to half of the recent advance, while the scope for additional upside appears to be relatively small. We have therefore downgraded our short-term US stock market outlook to "bearish".
And now for something a little different. Below is a daily chart of the Cairo Stock Exchange Index (CASE30), a proxy for Egypt's stock market. We have included this chart because the political situation in Egypt has again become volatile. There are increasing tensions between Christians and Muslims, and there is growing frustration/disenchantment due to the failure, to date, of the military government to provide the free elections that were promised after Mubarak was removed from office early this year.
Notice that the CASE30 has fallen well below the lows made in response to the Q1-2011 revolution.
Chart Source: www.fullermoney.com
The potential for another revolution in Egypt and more civil unrest throughout the Middle East is a source of downside risk for the broad stock market and upside risk for oil and gold that few people are contemplating at this time.
This week's
important US economic events
| Date |
Description |
| Monday Oct 17 | Empire
State Manufacturing Survey
Industrial Production
| | Tuesday Oct 18 | PPI
Housing Market Index
TIC Report
| | Wednesday Oct 19 | CPI
Housing Starts
Beige Book | | Thursday
Oct 20 | Existing Home Sales
Philadelphia Fed Survey
Leading Economic Indicators
| | Friday Oct 21 | No important events
scheduled
|
Gold and
the Dollar
Gold
The following chart shows that the euro-denominated gold price (gold/euro) has intermediate-term lateral support just below 1100. This support probably defines the maximum downside risk on both a short- and intermediate-term basis, but we doubt that it will be tested. It's more likely that the late-September low will turn out to be gold/euro's ultimate correction low.
While gold/euro probably won't trade any lower than it did on 26th September, it isn't reasonable to expect a new intermediate-term upward trend to begin in the near future. Based on the historical record, there's a good chance that gold/euro will trade at its 200-day moving average before the start of the next intermediate-term advance.
We suspect that the September-2011 low will end up being similar to the July-2010 low (Point A on the above chart), and that gold/euro will meet up with its 200-day moving average several months from now at somewhere above the September-2011 low (similar to Point B on the above chart). In other words, we think that the most realistic expectation is for gold/euro to range-trade over the next several months.
As discussed in last week's Interim Update, a multi-month period of range-trading probably also lies in store for the US$ gold price.
Gold Stocks
It could be many months before we know, for sure, that the HUI made an intermediate-term bottom on 4th October, but at this stage the evidence suggests that it did. However, even if an intermediate-term low is in place it is unlikely that new highs will be reached within the next few months.
The HUI is not close to being 'overbought'. This doesn't mean that a pullback won't occur over the days ahead, but it does mean that any pullback that began from near the current level would likely be minor. Our guess is that the HUI will rise to resistance at 570-580 before experiencing a pullback that lasts more than three days and wipes more than a few percent off its value.
The CDNX is a proxy for small-cap resource stocks, including small-cap gold stocks. As noted on the following chart, it has quickly rebounded by 20% from its 4th October low.
With many small-cap stocks well down from their end-2010 levels, tax-loss selling is likely to have a significant effect during November-December. This means that even if an intermediate-term low is in place for indices such as the HUI and the XAU (indices that are dominated by top-tier mining stocks), the CDNX could make a new low for the year during November. Keep that in mind if the small-cap stocks continue their rebounds over the next couple of weeks.
Currency Market Update
When the Dollar Index is in an intermediate-term upward trend, corrections tend to take it back to the 50-day moving average and no further. At the end of last week the Dollar Index was within half a point of this moving average.
Along similar lines, when the euro is in an intermediate-term downward trend it tends to 'correct' upward to the vicinity of its 50-day moving average. As illustrated by the following daily chart, it is almost there.
We have just begun to establish a new position in euro (FXE) put options (an earlier position was exited on 4th October) on the basis that the euro has almost exhausted its rebound potential. If the euro were to achieve consecutive daily closes above 140 in the near future it would mean that the market was not following the expected path and we would probably close out this bearish speculation.
Update
on Stock Selections
Notes: 1) To review the complete list of current TSI stock selections, logon at
http://www.speculative-investor.com/new/market_logon.asp
and then click on "Stock Selections" in the menu. When at the Stock
Selections page, click on a stock's symbol to bring-up an archive of
our comments on the stock in question. 2) The Small Stock Watch List is
located at http://www.speculative-investor.com/new/smallstockwatch.html
 Gold-Ore Resources (TSX: GOZ). Shares: 85M issued, 91M fully diluted. Recent price: C$0.83 Gold-Ore Resources (TSX: GOZ). Shares: 85M issued, 91M fully diluted. Recent price: C$0.83
At Friday's closing price of C$0.83/share, GOZ's market cap was $71M. However, it had working capital of $21M and long-term debt of $1M, so its enterprise value was only $51M.
For $51M, you get a company that just reported quarterly cash flow of $7.8M ($31.2M annualised) and quarterly earnings of $5.5M ($22M annualised). That is, GOZ is presently trading at less than 2 times current cash flow and less than 3 times current earnings.
There are a number of reasons for this very low valuation. First, the company produces gold on a small scale (small-scale gold producers generally trade at much lower valuations than large-scale producers). Second, the company doesn't appear to have much in-house growth potential. Third, there has been a market-wide shift away from risk since February of this year.
That being said, GOZ's valuation appears to be unsustainably low.
Pretium Resources (TSX: PVG). Shares: 87M issued, 92M fully diluted. Recent price: C$9.60
As a result of not yet rebounding by much since bottoming in early October, PVG currently stands out as a good candidate for new buying.
PVG probably won't be affected by tax-loss selling and should have good news flow over the next few months. In addition to drilling results, the news we are expecting is an updated resource estimate for the Brucejack project and the completion of an engineering study that assesses the economics of combining PVG's Snowfield project with Seabridge Gold's neighbouring KSM project. Combined, these projects contain the largest known gold deposit in North America.
Capstone Mining (TSX: CS). Shares: 374M issued, 404M fully diluted. Recent price: C$3.04
We added junior copper miner CS to the TSI List last month at C$2.25. This means that we are 'officially' up by about 35%, but anyone who immediately bought in response to our write-up wouldn't have paid more than C$2.05 and would therefore have a quick profit of around 50%.
Due to CS now getting close to resistance and our concerns about downside risk in the broad stock market and the copper market, we have decided to remove this stock from the TSI List.
Chart Sources
Charts appearing in today's commentary
are courtesy of:
http://stockcharts.com/index.html
http://www.decisionpoint.com/
http://www.fullermoney.com/

|
