![]()
![]()
![]()
![]()
-- Weekly Market Update for the Week Commencing 17th October 2016
Big Picture
View
Here is a summary of our big picture
view of the markets. Note that our short-term views may differ from our
big picture view.
The BULL market in US Treasury Bonds that began in the early 1980s ended in early-2015, but there will be many years of topping action in bond prices and bottoming action in bond yields before major new trends get underway. (Last update: 29 June 2015)
The stock market, as represented by the S&P500 Index, commenced a secular BEAR market during the first quarter of 2000, where "secular bear market" is defined as a long-term downward trend in valuations (P/E ratios, etc.) and gold-denominated prices. This secular trend will bottom sometime between 2018 and 2020. (Last update: 29 June 2015)
A secular BEAR market in the US Dollar began during the final quarter of 2000 and ended in July of 2008. This secular bear market will be followed by a multi-year period of range trading. (Last update: 09 February 2009)
Gold commenced a secular bull market relative to all fiat currencies, the CRB Index, bonds and most stock market indices during 1999-2001. This secular trend will peak sometime between 2018 and 2020. (Last update: 29 June 2015)
Commodities,
as represented by the CRB Index, commenced a
secular BULL market in 2001 in nominal dollar terms. The first major
upward leg in this bull market ended during the first half of 2008, but
a long-term peak won't occur until 2018-2020.
(Last
update: 29 June 2015)
Copyright
Reminder
The commentaries that appear at TSI
may not be distributed, in full or in part, without our written permission.
In particular, please note that the posting of extracts from TSI commentaries
at other web sites or providing links to TSI commentaries at other web
sites (for example, at discussion boards) without our written permission
is prohibited.
We reserve the right to immediately
terminate the subscription of any TSI subscriber who distributes the TSI
commentaries without our written permission.
Outlook Summary
|
Market |
Short-Term (1-3 month) |
Intermediate-Term (6-18 month) |
Long-Term (2-5 Year) |
| Gold | N/A |
Bullish (10-Oct-16) |
Bullish |
| US$ (Dollar Index) | N/A |
Neutral (17-Aug-16) |
Neutral (19-Sep-07) |
| US Treasury Bonds (TLT) | N/A |
Bearish (19-Oct-15) |
Bearish |
| Stock Market (DJW) | N/A |
Bearish (19-Sep-16) |
Bearish |
| Gold Stocks (HUI) | N/A |
Bullish (10-Oct-16) |
Bullish |
| Oil | N/A |
Neutral (26-Oct-15) |
Bullish |
| Industrial Metals (GYX) | N/A |
Neutral (10-Oct-16) | Bullish |
4. Long-term views are determined almost completely by fundamentals and intermediate-term views
are determined by a combination of fundamentals, sentiment and technicals.
Last week's posts at the TSI Blog
Most people want price controls
The gold manipulation silliness continues
Summary of current
thinking/positioning
1) No longer hedged via put
options against short-term downside in gold and the associated mining
stocks (due to options having been exited in response to the recent price
plunge), but still hedged via a substantial cash reserve. Expecting large
gains in gold-related investments over the next two years, but not
expecting much with regard to the next 6 months.
2) Gradually
increasing exposure to non-gold commodity-related stocks during periods of
price weakness in anticipation of 2017-2018 being a very bullish period
for commodities. Thinking that the early-2016 lows could be tested prior
to the start of the aforementioned bullish period.
3) Thinking that
the US stock market has commenced a meaningful 1-2 month decline.
Positioned via QID call options and EEM (Emerging Markets ETF) put
options.
4) Due mainly to the divergence between the currency and
oil markets discussed in the 12th October Interim Update, expecting the
oil price to soon commence a tradable decline and positioned for such an
outcome via USO put options.
5) Thinking that the Yen is about to
break out to the downside, that the commodity currencies are still in
consolidation mode with a risk of testing their early-2016 lows, and that
within the next few months the British Pound will make a low of similar
magnitude to the major bottom of early-1985.
6) Maintaining a large
cash reserve in recognition of the downside risk in almost all equities
(current cash percentage is around 50%), but looking for opportunities to
reduce cash and add to gold plus commodity exposure.
The US Treasury
has been tightening monetary conditions
Since last October the
year-over-year rate of growth in US True Money Supply (TMS) has risen from
about 6.8% to about 9.6%. Putting this into perspective, 9.6% is the
fastest rate of US monetary inflation since April-2013. The acceleration
in the US money-supply growth rate has, however, partly been offset by the
US Treasury's removal of money from the economy. Curiously, while
'everyone' has been agonising over when the Fed will take its next baby
step along the tightening path, the US Treasury has been stealthily
tightening US monetary conditions.
The stealth tightening by the
Treasury was broached in a
14th September post at the TSI Blog. The crux of the matter is that
there has been a large increase since early-November of last year in the
amount of money held by the Treasury in its account at the Fed. This money
forms part of the US money supply and is therefore included in the TMS
calculation, but for all intents and purposes it has been temporarily
removed from the economy.
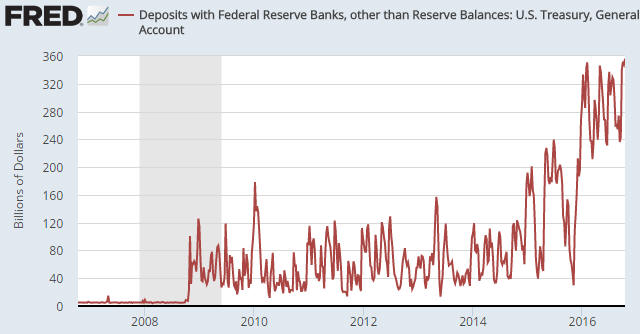
The following chart illustrates what we
mentioned in the preceding paragraph (the chart indicates the amount of
money in billions of dollars that the US federal government has on deposit
at the Fed). It shows that:
1. Prior to 2008 the Treasury's account
at the Fed was usually almost empty.
2. From late-2008 through to
late last year the amount held in the Treasury's account at the Fed
usually fluctuated between $20B and $120B, and that in early-November of
last year it was around $30B.
3. This year the amount held in the
Treasury's account at the Fed has fluctuated in a much higher range and is
currently at an all-time high of almost $360B.
In effect, the US Treasury has removed -- by not spending all the
taxes it collects or the money it borrows -- about $330B from the US
economy since early-November of last year. This is sufficient to have
caused a slowing of economic activity.
Just to be clear, creating
money out of nothing can only get in the way of real economic progress,
but it often causes a burst of activity and temporarily makes the economy
seem more vibrant. It can be likened to throwing a party in which the seed
corn is consumed. The party-goers feel great for a while...and then they
starve. By the same token, while slowing the pace at which money is
created out of nothing (that is, slowing the pace at which the seed corn
is consumed) will ultimately be helpful, in the short-term it will make
the economy seem less vibrant. In terms of short-term economic effect, the
actions taken by the US Treasury since last November are similar to
slowing the pace at which new money is created.
Conspiracy
theorists would be having a field day if the opposite had happened, that
is, if the amount of money in the Treasury's account at the Fed had fallen
by $330B over the past 11 months. They would be shouting that the account
had been drained in an effort to give the economy an artificial boost in
the lead-up to the Presidential election, thus improving the chances of a
Democrat victory. But with the incumbents having taken money OUT of the
economy in the lead-up to the election this particular theory never got
off the ground.
So what, then, is the reason for the stealth
monetary tightening conducted by the US Treasury via its account at the
Fed?
We can only guess, but it's reasonable to assume that the
slight tightening of monetary conditions was NOT an intended consequence
of the Treasury's actions. In other words, it's implausible that during
the year leading up to an election the Treasury knowingly took a course of
action that would be a short-term economic depressant.
A far more
reasonable explanation is that the action was taken for risk management
purposes. The Treasury has always lived from hand to mouth, with almost no
emergency cash. Having run out of money a couple of times over the past
few years due to inter-party haggling over the "debt ceiling", it has
probably been decided that a lot more cash should be kept in reserve.
The bond market
breaks support
The iShares 20+ Year Treasury
ETF broke below support at $133 on Friday. This breakdown suggests
short-term downside potential to $127-$128 and -- dare we say it -- is
possibly an early warning that the secular bull market in US government
bonds has ended.
The market for government bonds has been steadily weakening since
early-July. The weakening could be a routine intermediate-term correction
within an on-going bull market, but there are signs that it is something
more serious. Specifically, there are signs that it is due to a spreading
realisation that central-bank programs designed to push bond prices to
absurdly-high levels are counter-productive, and that a further
doubling-down on these programs could wreak both economic and political
havoc.
Last Friday's reaction to a Janet Yellen speech was one such
sign that the bond market is becoming increasingly wary of central-bank
promises to do more of the same. We are referring to the fact that when
Yellen speculated on Friday that the Fed might have to do more
(meaning: monetise more assets and hold interest rates lower for longer),
the T-Bond sold off and broke below support.
The T-bond price is
not going to suddenly collapse in a heap, because the Treasury market is
still widely considered to be a safe haven in times of trouble and there
will be no shortage of trouble in the future. A realistic possibility,
however, is a downward trend that gradually picks up steam over the coming
12 months.
The Stock Market
The US
The S&P500 Index (SPX) opened sharply lower last Thursday and briefly
traded below support at 2120 (the 'cliff edge') before reversing course.
It ended the day with a trivial loss and handily above the aforementioned
support. Optimism inspired by Thursday's turnaround then prompted some
follow-through to the upside during the first couple of hours of Friday's
trading session, but the gains were given back and the market ended flat
on the day.
Despite the downside breakout from a 'contracting
triangle' early in the week and significant intra-day volatility during
the final two days of the week, the SPX got through last week's challenges
without suffering much technical damage. So, what's likely to happen from
here?
One possibility is that a routine 2-month correction ended with last
Thursday's short-lived breach of support. If so, a rally to a new all-time
high is just getting underway.
It's more likely, however, that
there will soon be another test of support at 2120 with a very different
result. As previously advised, we are expecting that a breach of support
at 2120 will be followed by a quick decline to near the "Brexit" sell-off
low in the 1990s.
For anyone interested in taking a short-term
bearish position, one advantage of the current situation is that it
wouldn't take much movement in the wrong direction (upward) to show that
the position was wrong. As mentioned in last week's Interim Update, all it
would take is a daily SPX close above 2170. This makes risk management
relatively straightforward.
Emerging Market Equities
We use the Emerging Markets Equity ETF (EEM) as a commodity-market
indicator. It is useful in this regard because periods during which EEM is
strong relative to the SPX almost always coincide with periods of
broad-based strength in commodity prices. Moreover, the EEM/SPX ratio
either leads the commodity world at major turning points or can be used to
confirm a major trend reversal in commodities.
There was enough
strength in the EEM/SPX ratio during the first 8 months of this year to
signal a major reversal from down to up in the commodity world. However,
no major trend evolves in a straight line and there are signs, including
the recent divergence between the Canadian dollar and the oil price, that
at least a 1-2 month period of commodity-price weakness has begun or will
soon begin.
If we get concurrent downturns in the commodity markets
and the SPX over the weeks ahead then EEM is likely to fall in both
nominal dollar terms and relative to the SPX.
With reference to the
following chart, EEM has more-or-less traded sideways since topping in
August. It appears to have broken below the bottom of a channel that dates
back to the January low, but the important support lies at $36.00. EEM
support at $36 is equivalent to SPX support at 2120, with a decisive
breach projecting a decline to the June low ($32 for EEM).
We are planning to substantially increase our exposure to non-gold
commodity stocks over the months ahead, but we already have enough
exposure to this group of stocks to be concerned about the effects on our
portfolio of concurrent commodity and equity sell-offs. We therefore
purchased some December-2016 EEM put options last week as both a hedge and
a speculation.
Those who are interested in a way of trading a
short-term stock market decline and who aren't interested in trading
options could consider buying the ProShares UltraShort Emerging Markets
ETF (EEV) near Friday's closing price of US$15.52. A decline in EEM to
around $32 would likely result in a gain of around 25% in EEV's price.
A daily close above $38.50 by EEM could be used as a stop for an
emerging-markets-related bearish speculation.
This week's
significant US economic events
[Notes:
1) The most important events
(to the markets) are shown
in bold. 2) A list of global economic events can be found
HERE]
| Date | Description |
| Monday October 17 |
Empire State Mfg Survey Industrial Production |
| Tuesday October 18 |
CPI TIC Report |
| Wednesday October 19 |
Housing Starts Fed's Beige Book |
| Thursday October 20 |
Existing Home Sales Leading Economic Indicators |
| Friday October 21 | No important events scheduled |
Gold and the Dollar