


-- Weekly Market Update for the Week Commencing
18th April 2016
Big Picture
View
Here is a summary of our big picture
view of the markets. Note that our short-term views may differ from our
big picture view.
The BULL market in US Treasury Bonds
that began in the early 1980s ended in early-2015, but there will be many years
of topping action in bond prices and bottoming action in bond yields before
major new trends get underway. (Last update: 29 June 2015)
The stock market, as represented by the S&P500 Index,
commenced
a secular BEAR market during the first quarter of 2000, where "secular
bear market" is defined as a long-term downward trend in valuations
(P/E ratios, etc.) and gold-denominated prices. This secular trend will bottom sometime between 2018 and 2020.
(Last update: 29 June 2015)
A secular BEAR market in the
US
Dollar
began during the final quarter of 2000 and ended in July of 2008. This
secular bear market will be followed by a multi-year period of range
trading.
(Last
update: 09 February 2009)
Gold commenced a
secular bull market relative to all fiat currencies, the CRB Index,
bonds and most stock market indices during 1999-2001.
This secular trend will peak sometime between 2018 and 2020.
(Last update: 29 June 2015)
Commodities,
as represented by the CRB Index, commenced a
secular BULL market in 2001 in nominal dollar terms. The first major
upward leg in this bull market ended during the first half of 2008, but
a long-term peak won't occur until 2018-2020.
(Last
update: 29 June 2015)
Copyright
Reminder
The commentaries that appear at TSI
may not be distributed, in full or in part, without our written permission.
In particular, please note that the posting of extracts from TSI commentaries
at other web sites or providing links to TSI commentaries at other web
sites (for example, at discussion boards) without our written permission
is prohibited.
We reserve the right to immediately
terminate the subscription of any TSI subscriber who distributes the TSI
commentaries without our written permission.
Outlook Summary
Market
|
Short-Term
(1-3 month)
|
Intermediate-Term
(6-18 month)
|
Long-Term
(2-5 Year)
|
|
Gold
|
N/A |
Bullish
(26-Mar-12) |
Bullish
|
|
US$ (Dollar Index)
|
N/A |
Bullish
(29-Feb-16) |
Neutral
(19-Sep-07) |
|
US Treasury Bonds (TLT)
|
N/A |
Bearish
(19-Oct-15)
|
Bearish |
|
Stock Market
(DJW)
|
N/A |
Bearish
(30-Dec-15) |
Bearish
|
|
Gold Stocks
(HUI)
|
N/A |
Bullish
(23-Jun-10) |
Bullish
|
|
Oil |
N/A |
Neutral
(26-Oct-15) |
Bullish
|
|
Industrial Metals
(GYX)
|
N/A |
Neutral
(09-Nov-15) |
Bullish
(28-Apr-14) |
Notes:
1. Our short-term expectations are discussed in the commentaries, but except in
special circumstances we won't attempt to assign a "bullish", "bearish" or
"neutral" label to these expectations.
2. The date shown below the current outlook is when the most recent outlook change occurred.
3. "Neutral" means that we think risk and reward are roughly in balance with respect to the timeframe in question.
4. Long-term views are determined almost completely by fundamentals and intermediate-term views
are determined by a combination of fundamentals, sentiment and technicals.
Last week's posts at the TSI Blog
ZeroHedge tries to create more drama out of nothing
The
true meaning of gold's COT data
Money
should NOT be backed by gold
The folly of staying bearish on oil due to "excess supply"
Monetary Inflation
Update
The most important monetary
indicator
The change in the rate of monetary inflation is one of the two inter-related
drivers of the boom-bust cycle, the other being the manipulation/distortion of
interest rates (the two are inter-related because interest rates can't be
suppressed without increasing the money supply and the creation or destruction
of money will naturally affect interest rates). That's why we closely track the
money-supply growth rates of several countries/regions.
The most important money supply is that of the US, but we've found that from a
practical investing/speculating standpoint the most useful money-supply
indicator is the combination of US$ and euro supply. We call this combination
"G2 TMS", where TMS stands for True Money Supply (a monetary aggregate based on
Austrian Economics principles). We created G2 TMS in response to what happened
during 2005-2006, when accelerating monetary inflation in the euro-zone delayed
the onset of an economic bust in the US.
As illustrated below, over the past 5 years the year-over-year (YOY) rate of
growth in G2 TMS oscillated between 6% and 10%. There was a surge to the top of
this range last year thanks to more rapid money-pumping in the euro-zone, but
over the past few months the inflation rate has fallen back to near the middle
of its 5-year range.
The booms that ended in 2000 and 2006-2007 did so a few months after the G2
monetary inflation rate dropped below 6%, which suggests that the current
investment booms are yet to run out of monetary steam. However, considering the
damage that has been done by the unprecedented central-bank interventions of the
past several years, it will not surprise us if the next bust starts with the G2
monetary inflation rate still comfortably above 6%. In fact, the next bust might
have already begun.
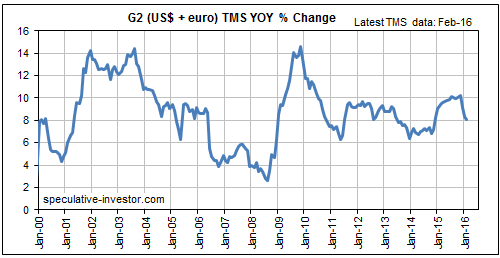
In summary, it's very likely that a decline in the G2 monetary inflation rate to
below 6% would soon be followed by economic busts and financial-market crises in
the US and Europe, but there's also an uncomfortably-high risk that this time
around these painful developments will begin at a faster inflation rate.
Japan's monetary inflation rate continues to defy widespread expectations and
beliefs
In early-2013 the Bank of Japan (BOJ) fired what many have likened to a monetary
bazooka when it implemented a QE program that was vastly bigger, relative to
GDP, than anything ever attempted in a developed country in the modern era.
Let's call it a QE on Steroids (QEOS) program. At the time this monetary bazooka
was fired, the YOY rate of growth in Japan's M2 money supply was slightly above
3%. Today it is still slightly above 3%. So much for the 'bazooka'.
As illustrated below, Japan's M2 inflation rate initially responded to the QEOS
program by rising to a high of almost 4.5% in early-2014. However, even at this
accelerated pace the money supply in Japan was growing at less than half the
pace of the money supply in the US at the time. Japan's current rate of monetary
inflation is less than half that of the US and less than one-third that of the
euro-zone. And yet, we still regularly see comments to the effect that the Yen
is being inflated to oblivion.
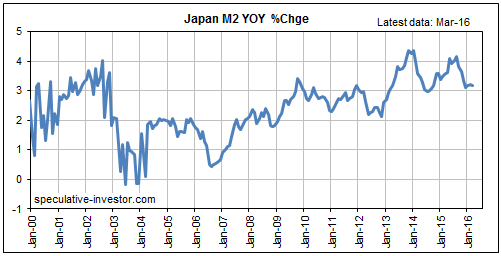
The fact is that the entire decline in the Yen from early 2013 through to
mid-2015 was based on a false perception. Perhaps that's why the Yen has been
'surprisingly' strong over the past few months.
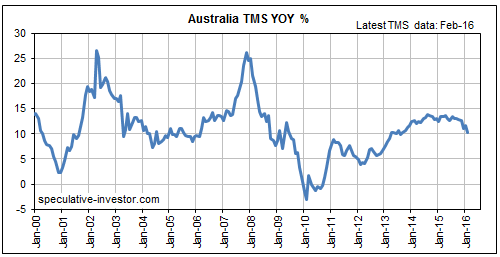
Despite the obvious real-estate bubble, easy monetary policy persists in
Australia
Australia's monetary inflation rate has tapered over the past 12 months (see
chart below), but it is still in double digits. This hasn't prevented the A$
from strengthening on the FX market over the past three months, because the A$'s
rate of exchange against the US$ is primarily influenced by commodity prices and
the commodity markets have rallied. However, the on-going rapid monetary
inflation probably means that anyone in Australia whose salary isn't rising by
at least 8%/year will be experiencing a declining salary in real terms and that
houses are going to remain very expensive for a while.
Commodities
The wide-angle view
Over the past 10 years the CRB Index (the green line on the following chart) has
generally trended with international freight rates as measured by the Baltic Dry
Index (BDI, the blue line on the following chart). There have been multi-month
periods when these two quantities went their separate ways, but they always
ended up moving back into line with each other. For example, when a rally in the
CRB Index and a decline in the BDI during the first half of 2014 created a large
divergence, the divergence was subsequently closed by a plunge in the CRB Index.
For another example, a divergence created by a surge in the BDI and a decline in
the CRB Index during June-July of last year was subsequently eliminated by a
plunge in the BDI.
The CRB and the BDI have rallied together over the past 2 months, although the
BDI has recently been a lot stronger than the CRB.
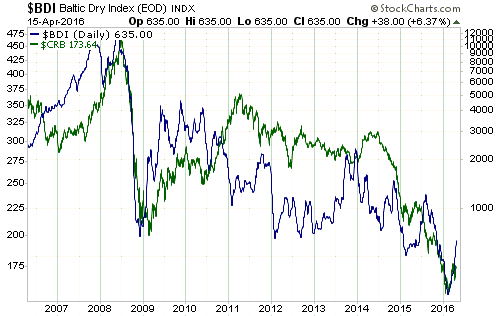
The above chart's message is that it makes no sense to be bullish on commodities
and not bullish on international freight rates. If a major or at least an
intermediate-term bottom was put in place for broad-based commodity indices
during the first quarter of this year, as we currently suspect, then it's highly
probable that a major or at least an intermediate-term bottom is in place for
international freight rates.
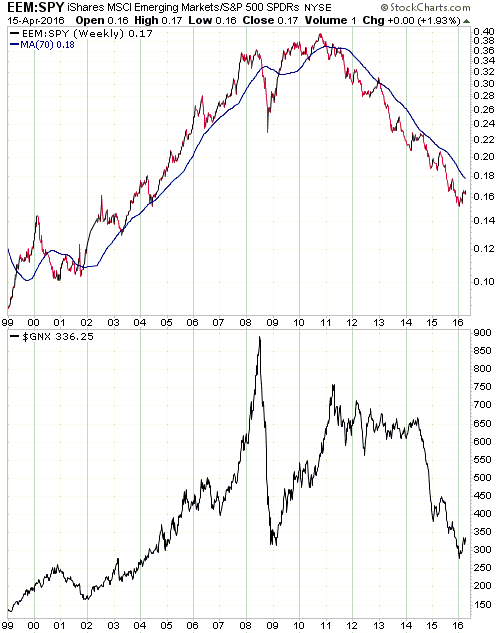
The next chart compares the EEM/SPY ratio (emerging-market equities relative to
the US stock market) with the Goldman Sachs Spot Commodity Index (GNX). This
chart shows that on a long-term basis the GNX trends in the same direction as
the EEM/SPY ratio. More importantly, it shows that the EEM/SPY ratio tends to
lead the GNX at major turning points.
It's possible that a major turning point occurred early this year, but it hasn't
yet been confirmed. Confirmation would take the form of EEM/SPY achieving a
weekly close above its 70-week MA (the blue line on the chart).
Oil
In a
blog post late last week we discussed the folly of remaining bearish on oil
due to "excess supply". In a note at the end of this post we wrote: "The
price action hasn't yet definitively signaled a reversal, but it's possible that
an intermediate-term reversal signal will be generated at the end of this week."
An intermediate-term reversal signal was generated at the end of last week, in
that oil managed to achieve a weekly close above its 40-week MA (the red line on
the following chart) for the first time since mid-2014. Furthermore, the most
reliable measure of oil's supply-demand situation indicates a significant
tightening in this market over the past two months. We are referring to the fact
that there has been a meaningful shrinkage in the "contango" (the difference
between the price for future delivery and the cash price), which tells us that
oil supply is presently not as excessive as many people seem to believe.
At the same time, the following chart shows that the price reversed downward
last week after touching the top of a 2-year channel. This suggests to us that
there will be consolidation in the oil market over the next few weeks even if a
long-term upward reversal has happened.
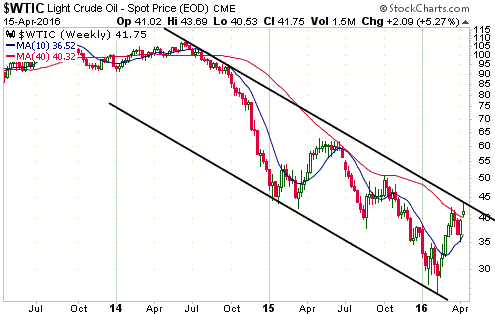
A multi-year bottom is probably in place in the oil market, although there is
still a risk that the February low will be tested as part of a basing process.
The Copper Bottom
From the 15th February Weekly Update:
"At major price bottoms, gold leads and copper follows. With gold having
provided us with evidence that something more than a short-term rebound is in
the works, it's time to give more thought to the possibility that a sustained
up-turn in the copper market is not far away.
While gold tends to lead at major bottoms, the lead time is variable. For
example, in 2001 the bottom for gold preceded the bottom for copper by about 7
months, whereas in 2008 the bottom for gold preceded the bottom for copper by
1-2 months. However, if we are right to assume that gold has bottomed then the
next upside breakout in the copper price should signal the start of an
intermediate-term rally.
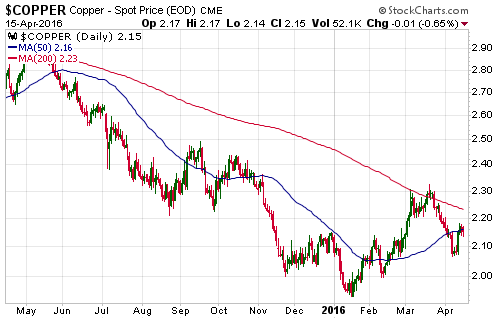
With reference to the following chart, a daily close above $2.15 would take the
copper price above lateral resistance and the top of a well-defined 9-month
channel. As long as the gold market maintains its longer-term bullish posture we
would therefore take a daily close above $2.15 as evidence of a sustainable
turnaround in the copper market."
The copper price subsequently signaled a sustainable turnaround by closing above
US$2.15. It then moved up to the low-$2.30s before embarking on a correction. We
don't know if the correction is over and we will not be surprised if the January
low is tested as part of a basing process, but due primarily to gold's
performance and leadership we suspect that a multi-year price bottom is in place
for copper.
The Commitments of Traders (COT) report continues to perform admirably as an
indicator of short-term price tops and bottoms in the copper market. Just a
reminder that short-term price bottoms tend to occur at around the time that the
blue bars on the following chart (the Commercial net-position) reach the top of
the indicated range and/or the red bars on the following chart (the Speculative
net-position) reach the bottom of the indicated range, and that short-term price
tops occur at around the time that the speculative net-position reaches zero or
becomes slightly positive.
The COT data signaled the recent short-term price top and is currently
non-committal.
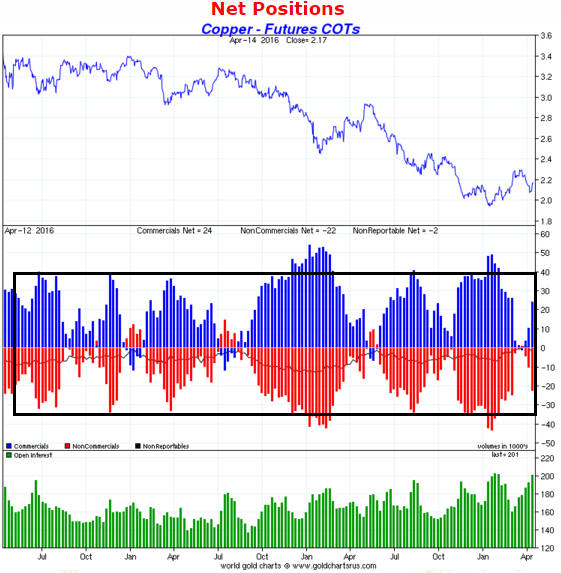
Chart source: www.sharelynx.com
A final point is that the COT levels that reliably indicated short-term price
tops and bottoms in copper over the past three years are going to stop working
when copper enters a new bull market. The reason is that after the major price
trend shifts from down to up the speculative net-position will be skewed more to
the long side than it has been over the past few years. The red bars on the
above chart moving well above zero during a short-term upward trend will
therefore be a sign that the long-term price trend has become bullish.
The Stock Market
The US
The senior US stock indices traded in a very narrow range over the final two
days of last week, that is, over the days since we posted last week's Interim
Update. On a daily closing basis the SPX was up one point on Thursday and down
two points on Friday. This means that the stock market is still 'pushing the
envelope' in terms of what's possible/plausible for a bear-market rebound.
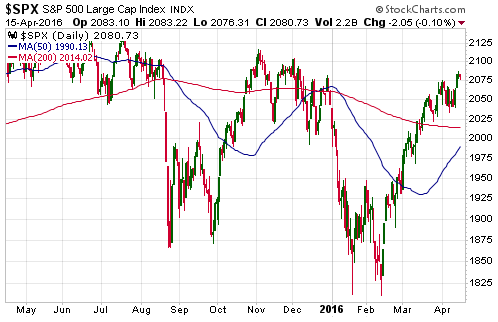
Also unchanged over the final two days of last week are the bearish
divergences/non-confirmations we've recently noted. Specifically, the Dow
Transportation Average and the number of individual stocks making new highs are
still below their March peaks.
Here's the sequence of events that should soon begin IF our big-picture view is
correct:
1) A sharp 1-2 week pullback, most likely bottoming in the vicinity of the SPX's
50-day MA (1990-2000).
2) A rebound to a lower higher.
3) A much larger decline lasting several weeks.
By the way, step 1) in this sequence is a likely outcome even if our favoured
bear-market scenario is wrong. This is because a pullback to near the 50-day MA
is due (or overdue) regardless of the longer-term outlook. The difference is
that if a bull market is still in progress then a decline to the 50-day MA would
be followed by a move to a new high for the year.
With regard to valuation, the article posted
HERE makes some good points. For example, earnings for the S&P500 Index are
now about the same as they were in 2013 when the index was trading slightly
above 1600, which means that the SPX has gained about 30% over the past 2.5
years with no growth in earnings. This would not imply present over-valuation if
the market were dirt cheap back in 2013, but back then the P/E ratio was already
about 13% above the long-term average. Today the SPX's P/E ratio is 24, putting
it in the top 8% of the long-term range.
On its own, a high valuation is generally not a good reason to enter a bearish
speculation. This is because historically-expensive markets often get more
expensive, and sometimes get a lot more expensive, before they top. However, we
currently have over-valuation combined with evidence that the long-term price
trend has reversed downward. To put it another way, there is evidence that
valuations are going to become lower over the months ahead.
This week's
significant US economic events
[Notes:
1) The most important events
(to the markets) are shown
in bold. 2) A list of global economic events can be found
HERE]
| Date |
Description |
| Monday
Apr 18 |
Housing Market Index |
| Tuesday
Apr 19 |
Housing Starts |
| Wednesday
Apr 20 |
Existing Home Sales |
| Thursday
Apr 21 |
Philadelphia Fed Business
Outlook Survey
Leading Economic Indicators |
| Friday Apr 22 |
No important events
scheduled |
Gold and the Dollar
Gold
The Yuan Gold Fix
As of April 19 the
Shanghai Gold Exchange (SGE) will quote a "gold fix" twice per day.
Like the famous twice-daily London Gold Fix, the SGE gold fix will simply be a
snapshot of the spot price at a set time. In other words, the 'fix' is not
actually determined by the banks that participate in the 'fixing' process, it is
determined by the market. There is some ability for the participants in the
'fix' to shift the price in one direction or the other for their own purposes
(for example, to avoid paying-out on option contracts), but the effect on the
overall market of such machinations would be very small in terms of both time
and price.
As far as we can tell, the Yuan gold fix will have no effect on gold's true
fundamentals and will therefore have no effect on gold's intermediate-term or
long-term price trends. It shouldn't even have an effect on gold's short-term
price performance, although whether it does or not will largely depend on the
vagaries of speculative sentiment.
Current Market Situation
The US$ gold price achieved a marginal upside breakout near the end of the week
before last. It built on this breakout last Monday, but then turned around and
headed back to its 50-day MA. At the end of last week it was in the narrow gap
between its 50-day and 20-day MAs -- slightly above the former and slightly
below the latter.
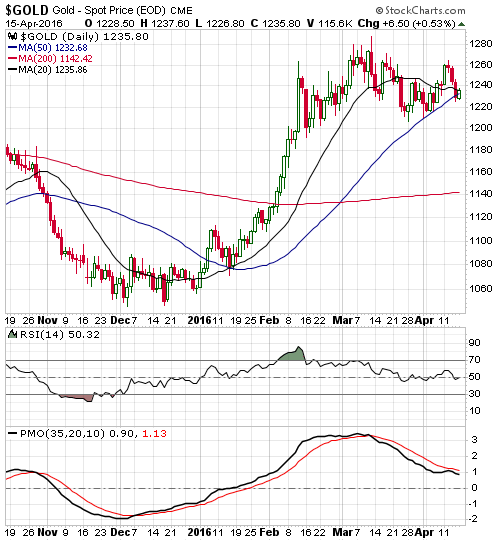
The reason we rarely buy in reaction to an upside breakout is that more than
half the time they either prove to be false signals or are quickly followed by
pullbacks to test the breakout. We don't yet know whether gold's recent upside
breakout was a genuine signal of what's to come or a false signal 'designed' to
suck-in some additional speculators on the long side prior to a move to new
2-month lows. These conflicting near-term outcomes are equally plausible.
With regard to gold's likely performance over the weeks ahead, the waters are
muddied by the fact that speculative sentiment has become increasingly bullish
over the past 2 months while the price has worked off an 'overbought' extreme by
essentially going sideways. We are referring to the fact that last Friday's
closing level for the US$ gold price was $12 lower than its closing level on
11th February, and yet the total speculative net-long position in Comex gold
futures is now substantially greater than its February-2016 peak and at its
highest level since late-2012 (when gold was trading at around $1700/oz). To put
it another way, in momentum terms the gold market appears to have completed a
correction while at the same time becoming even more stretched to the upside in
speculative sentiment terms.
That there has, indeed, been rising speculative enthusiasm for gold in the face
of lacklustre short-term price action is also evidenced by the performance of
the gold-mining sector. Since 11th February there has been a 21% increase in GDX
and a 35% increase in the more speculative GDXJ in parallel with a 1% DECLINE in
the US$ gold price.
One possibility is that there will be a further surge in the level of
speculation over the next 2-3 weeks, propelling gold to the low-$1300s and
creating a blow-off move to the upside in the gold-mining sector. This is why
it's important to maintain a sizable core position in gold stocks. Another
possibility is that there will soon be a solid break below the 50-day MA in the
gold market, prompting the quick-fire liquidation of recently-taken speculative
positions in both gold and the mining stocks. This is why it's important NOT to
have leveraged positions predicated on a bullish near-term outcome.
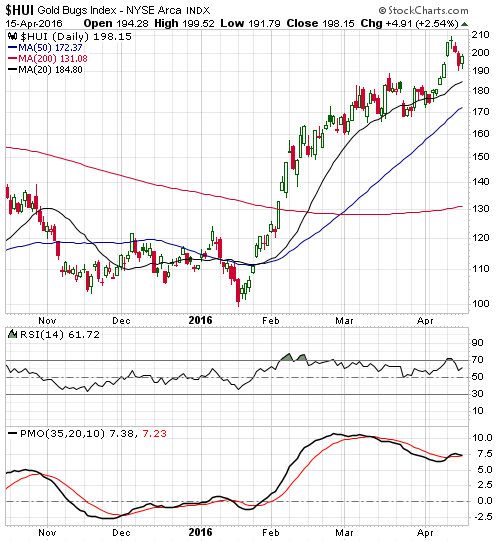
Gold Stocks
With regard to both the price action and the fundamental backdrop, the
gold-mining rally that has the most in common with this year's rally is the one
that began in late-November of 2000. This was the rally that kicked off a
cyclical and a secular bull market.
The following weekly chart covering the 2000-2002 period shows that the first
intermediate-term correction didn't begin until after the HUI reached its
200-week MA (the red line) in early-May of 2001. The chart also shows that there
was a significant 3-4 week short-term correction in March-2001 -- near the
mid-point of the first upward leg.
The next weekly chart shows the current situation.
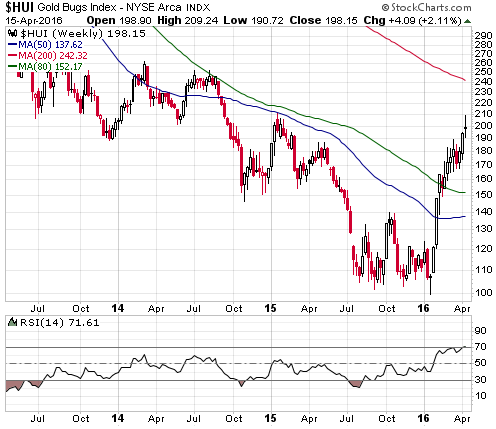
The main difference up until now between the rally that got underway in
late-2000 and the rally that got underway in January of this year is that this
year's rally has not yet experienced a genuine short-term correction. In fact,
since the beginning of this year's rally there have only been two down-weeks for
the HUI and these down weeks were separated by four up-weeks.
If this year's rally ends up matching the 2000-2001 rally then the HUI will
reach an intermediate-term peak of around 250 in late-June or early-July.
However, in order for the rally to continue for another 2-3 months there will
soon have to be a significant multi-week correction (the HUI can't keep going up
in a straight line). An alternative is that we get an upside blow-off that takes
the HUI to an intermediate-term peak within the next 2-3 weeks. Such a blow-off
would likely be followed by a large 1-2 month decline.
Zooming-in on the recent price action, the HUI broke out to the upside during
the week before last and built on its breakout during the first two days of last
week before suffering a minor set-back. At the risk of sounding repetitive
(we've said something similar almost every week for the past 2 months), the HUI
remains stretched to the upside but hasn't yet signaled a short-term top.
At a minimum, a correction within an on-going short-term upward trend would take
the HUI down to the 165-170 range. A short-term correction to lateral support at
140 is still possible, but as a result of the price action of the past two weeks
is now much less likely.
Before leaving the gold-mining sector it is worth mentioning that there has
recently been evidence of speculators moving down the gold-stock food chain in
search of profits. What we mean is that some lower-quality/higher-risk gold
stocks have recently risen sharply on much-higher-than-average trading volumes.
Two examples are Golden Star Resources (GSS) and Timmins Gold (TGD), but there
are many others.
Speculators are undoubtedly now being attracted to lower-quality/higher-risk
gold stocks on the basis that these stocks offer huge leverage to additional
gains in the gold price. But while this line of thinking can be correct, it
doesn't always apply.
For example, a gold deposit that currently requires a gold price of at least
$1800/oz to become economic offers precisely zero leverage to an increase in the
gold price, because the gold will never be extracted from the ground. That's not
because the gold price won't eventually move above $1800/oz, but because by the
time the gold price moves above $1800/oz the cost of extracting the gold will
have risen and there will be many other deposits with better economics standing
in line for development.
Also, whether or not a gold producer with relatively high costs actually does
offer operational leverage to gains in the gold price will depend on what
financial commitments the producer has entered into. For example, due to the
"streaming" and debt deals done by GSS to ensure its survival, GSS offers
surprisingly little operational leverage to the gold price. In effect, GSS now
exists primarily for the benefit of Royal Gold, its "streaming" partner and
major creditor.
The Currency Market
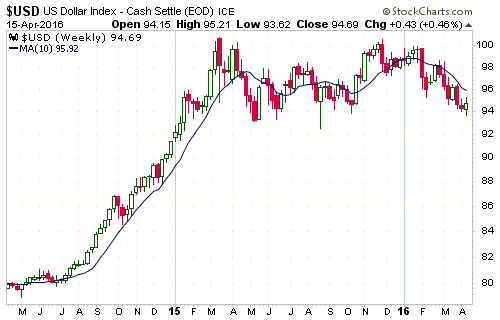
In last week's Interim Update, we wrote: "The Dollar Index is showing signs
of reversing upward. It will generate a clear-cut bullish signal in the form of
an outside week to the upside if it is able to trade above 95.1 within the next
two trading days and retain the bulk of Wednesday's gain."
The Dollar Index did trade above 95.1 and achieved an outside week to the
upside. The bullish signal was weakened by Friday's pullback, but we would still
view it as an early warning of a short-term trend reversal. A weekly close above
96 would be a more conclusive warning.
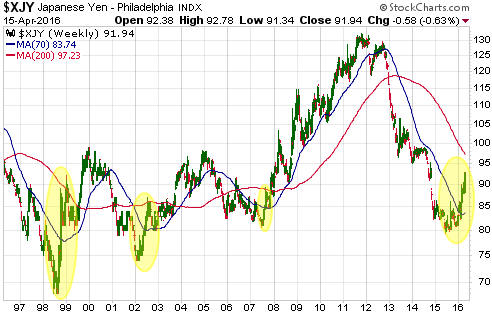
The Yen has been a relatively strong currency since the global stock-market peak
in mid-2015, which isn't surprising to us. What is surprising is the Yen's
upward acceleration over the past two months in parallel with the stock market's
rebound.
Based on the performance of Yen futures during previous rallies from multi-year
bottoms (the shaded areas on the following weekly chart), the 200-week MA (the
red line on the chart) is the most realistic target for an intermediate-term
peak. This implies a 2016 upside target for Yen futures of around 97.
Updates
on Stock Selections
Notes: 1) To review the complete list of current TSI stock selections, logon at
http://www.speculative-investor.com/new/market_logon.asp
and then click on "Stock Selections" in the menu. When at the Stock
Selections page, click on a stock's symbol to bring-up an archive of
our comments on the stock in question. 2) The Small Stock Watch List is
located at http://www.speculative-investor.com/new/smallstockwatch.html
 Company
news/developments for the week ending Friday 15th April 2016:
Company
news/developments for the week ending Friday 15th April 2016:
[Note: AISC = All-In Sustaining Cost, FS = Feasibility Study, FY = Financial
Year, IRR = Internal Rate of Return, MD&A = Management Discussion and Analysis,
M&I = Measured and Indicated, NAV = Net Asset Value, NPV(X%) = Net Present Value
using a discount rate of X%, P&P = Proven and Probable, PEA = Preliminary
Economic Assessment, PFS = Pre-Feasibility Study]
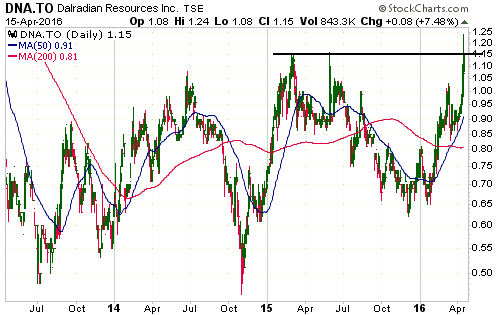
*Dalradian Resources (DNA.TO) reported the final results from the
51,000m infill drilling program at its Curraghinalt project in Northern Ireland.
The drilling program was designed to convert a substantial portion of the
Inferred resources to M&I resources as part of the on-going FS.
It looks like the drilling program achieved its intended purpose, but we'll soon
know for sure because a resource update incorporating the 51,000m of infill
drilling is nearing completion. This resource update will be an important
milestone for DNA.
We have C$2.00 in mind as an intermediate-term target for DNA. This target is
based on our valuation of the Curraghinalt project, which is, in turn, based on
the project's PEA and our view that the FS (due late this year) will confirm the
positive economics indicated by the PEA. However, the stock is not currently a
good candidate for new buying. This is due to last week's >20% surge to the
vicinity of an important resistance level (see chart below).
Even though DNA slightly underperformed over the past two months and continues
to offer good value, for anyone with a significant position in this stock the
recent rapid rise to the vicinity of important resistance has created an
opportunity for PARTIAL profit-taking.
*Energold Drilling (EGD.V) published its financial results for the
year ending 31st December 2015.
Revenue for the year was C$82M, which was C$19M lower than the previous year
thanks to the industry-wide reductions in drilling for metals, oil and gas.
However, the company did a good job of protecting its balance sheet considering
the very difficult market environment for its services. Specifically, the
company began 2015 with a healthy $64M of adjusted working capital (current
assets minus current liabilities and long-term debt) and ended the year with a
still-healthy $59M of adjusted working capital.
With about C$1.23/share of adjusted working capital and an $80M/year drilling
business, EGD continues to offer good value at its current share price of
C$1.12. Note, though, that its business probably won't begin to improve until at
least 6 months after a sustained turn to the upside in commodity prices.
Assuming that commodity prices bottomed during the first quarter of 2016, this
means that its business probably won't begin to improve until at least Q3-2016.
However, the stock price moved up sharply from a January bottom due to the
stock's extremely low valuation (it traded in the low-C$0.30s during December
and January) and a change in market sentiment.
We mentioned last November that the one company-specific concern we have about
EGD is that the "Current Assets" category of its balance sheet includes C$54M
under "Inventories". This is unchanged over the past 12 months and is a concern
because it is an unknown -- we don't know the composition of the "inventories"
amount and whether or not this amount is an accurate reflection of present
market value.
*Endeavour Mining (EDV.TO) announced that it has commenced mine
construction at the Hounde gold project in Burkina Faso. The Hounde Project is
expected to deliver average production of 190K-oz per year over a 10-year mine
life at an AISC of US$709/oz, and the initial capital cost is estimated at
US$328M. Production is scheduled to begin late next year.
The initial capex will be funded by EDV's existing cash and the cash it expects
to generate over the coming 18 months. To ensure that its existing mines
generate sufficient cash to fully fund the construction of the Hounde mine, the
company has established a hedging program covering 50% (400K ounces) of its
production during the 15-month period from April-2016 through to June-2017. The
hedging program guarantees a minimum gold price of US$1200/oz and a maximum gold
price of US$1400/oz for EDV's production during this period.
With the recent acquisition of True Gold Mining (TGM) and the decision to move
the Hounde project into production, EDV can now be likened to a West Africa
gold-mining ETF. When Hounde goes into production the company will have two
operating gold mines in Burkina Faso (Karma and Hounde), two operating gold
mines in Ivory Coast (Agbaou and Ity), an operating gold mine in Mali (Tabakoto)
and an operating gold mine in Ghana (Nzema).
We roughly estimate EDV's value to be C$15/share at a gold price of US$1200/oz
and C$20/share at a gold price of US$1300/oz. It's time we did an updated,
detailed valuation for this stock, but we are holding off because the company is
so active at the moment that any estimate would quickly become obsolete.
*Pilot Gold (PLG.TO) reported the results of the first 8 holes of
this year's drilling program at its Goldstrike project in Utah. This project was
previously mined on a small scale during the 1980s and 1990s via 12 shallow
pits. PLG believes that there could be a lot more gold in the vicinity.
There were significant oxide-gold intercepts in seven of the aforementioned
holes, including 2.10 grams/tonne gold (g/t Au) over 35.1 metres and 1.19 g/t Au
over 57.9 metres.
PLG's drilling program is open-ended, with results from earlier holes
determining the quantity and locations of subsequent holes. The aim is to obtain
enough data to come up with an initial resource estimate by year-end.
*Petrus Resources (PRQ.TO), a junior natural-gas producer, is
worthy of comment due to the relentless decline in its stock price. In January
the company completed a financing at C$7.40/share and also completed a takeover
of Phoscan (FOS) based on an implied C$7.40/share price for the yet-to-be-listed
PRQ shares. The shares were listed on the TSX in February and commenced trading
at C$5.00.
We became interested and brought the stock to the attention of TSI readers after
it had dropped to the C$2.90s, where it appeared to offer good value. The stock
price has since fallen all the way to the C$1.80s.
We have no new information. As mentioned in a previous commentary, we suspect
that the relentless downward pressure on the stock price is the result of
selling by the former shareholders of FOS who ended up with PRQ shares as part
of the takeover that was completed in January. These shares are being sold into
a market that has remained illiquid up until now, which would explain why the
selling is having such a big effect on the stock price. However, there is a risk
that the price weakness is the result of company-specific problems that we are
unaware of.
Due to the fact that we added PRQ to the TSI List as a long-term play based on
valuation it would be illogical for us to remove it after there has been no
known fundamental change and an improvement in the valuation.
In our own accounts the exposure to PRQ is about half of what we would consider
to be a full position. Our plan is to build up to a full position over the next
few months, but whether we actually do so will depend on the company-specific
facts we gather and the performance of the natural-gas market in the meantime.
*Ramelius Resources (RMS.AX) reported that its gold production for
the March quarter was at the low end of its 26K-29K guidance range and that the
average AISC for the quarter was higher than the A$1150/oz guidance. Also, the
company consumed about A$2M of cash during the quarter due to about $8M of
capital spending.
This is not a great result, but it's still OK. With capital spending on the new
Vivien gold mine now essentially complete and low-cost production from the
Vivien mine set to increase, RMS is likely to be cash-flow positive and
profitable during the current quarter.
*Timmins Gold (TGD) reported a good production result for the
first quarter of 2016. The company produced 25.1K ounces of gold, which was
slightly ahead of plan and a bit more than we were counting on. What we don't
know -- because the information isn't yet available -- is whether the good
production result enabled the company to add some much-needed cash to its
balance sheet. As previously advised, TGD needs to obtain additional cash -- to
fill a balance-sheet hole -- by mid-year. If it can do so without massively
diluting the stock it will have the potential to retrace the bulk of the past 2
years' price decline.
*UEX Corp. (UEX.TO) reported the initial results from its drilling
program at the Christie Lake uranium project. UEX currently owns 10% of the
project and has an option to increase its ownership to 70%. The project has an
historic (meaning: not NI 43-101 compliant) resource of 21M pounds grading 3.2%
U3O8.
The results have been received for three holes, two of which failed to hit the
targeted mineralisation and one of which contained a very significant
intersection grading 13.24% U3O8 over 3.1m. This is a good start.
Candidates
for new buying
In the market update posted on 9th April we wrote:
"...if you have a relatively small position in the gold-mining sector and
feel the need to increase your exposure to this sector in response to last
week's upside breakouts in the gold-mining indices, the following stocks are
worth considering near their current prices:
DNA.TO, EVN.AX, PG.TO, RSG.AX, SBB.TO"
It's getting increasingly difficult to find anything in the gold-mining sector
that isn't very stretched to the upside on a short-term basis and could
therefore be considered for new buying in the immediate future. For example, a
week ago the stocks mentioned above had been consolidating for a few weeks and
in addition to offering good value were not short-term 'overbought', but during
the past week DNA.TO and RSG.AX gained more than 20%. Although they are both
likely to trade much higher within the coming 12 months, these two stocks can
now be eliminated as immediate candidates for new buying. EVN.AX, PG.TO and
SBB.TO 'only' gained about 5% last week and could still be considered for new
buying by investors who feel the need to increase their exposure to the gold
sector.
Outside the gold-mining sector there is some value to be found. In particular,
there are uranium and O&G stocks/ETFs that offer good value and are not
short-term 'overbought'. However, concern about the risk of a general
stock-market decline prevents us from highlighting these stocks.
On a short-term basis the trade with the best risk/reward is some form of
bearish speculation on the broad US stock market. Examples include inverse index
funds, put options on ETFs such as QQQ and SPY, and call options on inverse
funds such as QID. This is partly because the general market's short-term risk
is high and partly because it wouldn't take much additional strength from here
to prove us wrong (our bear-market scenario is close to a make-or-break
position, which makes risk management straightforward).
Last Friday we added to our QID call-option position (a bearish speculation
linked to the NASDAQ100 Index). The position size is still small, but it would
yield a large profit if the NASDAQ100 were to return to its 2016 low within the
next 2.5 months.
Chart Sources
Charts appearing in today's commentary
are courtesy of:
http://stockcharts.com/index.html
