![]()
![]()
![]()
![]()
-- Weekly Market Update for the Week Commencing 18th June 2018
Big Picture
View
Here is a summary of our big picture
view of the markets. Note that our short-term views may differ from our
big picture view.
The BULL market in US Treasury Bonds that began in the early 1980s ended in mid-2016, but there will be many years of topping action in bond prices and bottoming action in bond yields before major new trends get underway. A major decline in government bond prices will unfold during the 2020s. (Last update: 11 September 2017)
The stock market, as represented by the S&P500 Index, commenced a secular BEAR market during the first quarter of 2000, where "secular bear market" is defined as a long-term downward trend in valuations (P/E ratios, etc.), gold-denominated prices and inflation-adjusted prices. This secular trend will bottom in 2020 or later. (Last update: 11 September 2017)
A cyclical BEAR market in the US Dollar began in 2016-2017. (Last update: 11 September 2017)
Gold commenced a secular bull market relative to all fiat currencies, the CRB Index, bonds and most stock market indices during 1999-2001. This secular trend will peak in 2020 or later. (Last update: 11 September 2017)
Commodities,
as represented by the CRB Index, commenced a
secular BULL market in 2001 in nominal dollar terms. The first major
upward leg in this bull market ended during the first half of 2008, but
a long-term peak won't occur until 2020 or later.
(Last
update: 11 September 2017)
Copyright
Reminder
The commentaries that appear at TSI
may not be distributed, in full or in part, without our written permission.
In particular, please note that the posting of extracts from TSI commentaries
at other web sites or providing links to TSI commentaries at other web
sites (for example, at discussion boards) without our written permission
is prohibited.
We reserve the right to immediately
terminate the subscription of any TSI subscriber who distributes the TSI
commentaries without our written permission.
True
Fundamentals Summary
[Notes:
1) The date shown next to the current True Fundamentals Model (TFM) signal is
when the most recent change occurred. 2) Charts of the Gold and Equity
TFMs are included in the "Charts and Indicators" section of the TSI web
site]
| Market | True Fundamentals Model (TFM) |
| Gold (US$ Price) | Bearish (12 Jan 2018) |
| US Equity (SPX) | Bearish (25 May 2018) |
| Currency (Dollar Index) | Bullish (27 Apr 2018) |
| Commodities (GNX) | Bearish (01 Jun 2018) |
Last week's posts at the TSI Blog
What is fiat
currency?
Summary of current
thinking/positioning
1) The euro's rebound from its
late-May low came to a premature end last Thursday. The euro and the
Dollar Index now appear to be headed for new 2018 extremes (a new low for
the euro, a new high for the DX), but a lot hinges on whether critical
levels (1.156 for the euro, 95 for the DX) are breached on a weekly
closing basis.
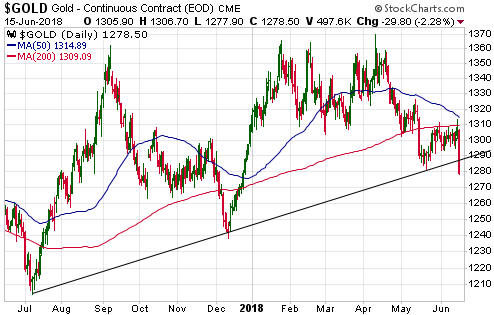
2) Last week's price action suggests that the gold
price is on its way to the mid-$1200s.
3) The SPX likely will make
a new all-time high by July. The risk/reward is not bullish, though,
because a move to well above the January high is unlikely and because
there is a realistic chance of a large decline during the second half of
2018.
4) Bearish signs emerged last week for commodities and
commodity-related currencies.
5) The T-Bond price should have an
upward bias over the coming 2-3 months.
6) Holding a cash reserve
of around 30%.
No Weekly Update
next week
The next Interim Update will be
posted at around the usual time on Thursday 21st June, but please note
that due to our travel schedule there will be no Weekly Update next
Sunday.
Commodities
Copper refuses to follow
the bullish script
A week ago we wrote that copper's price
action suggested the potential for move up to $3.80-$4.00 by September. We
also wrote:
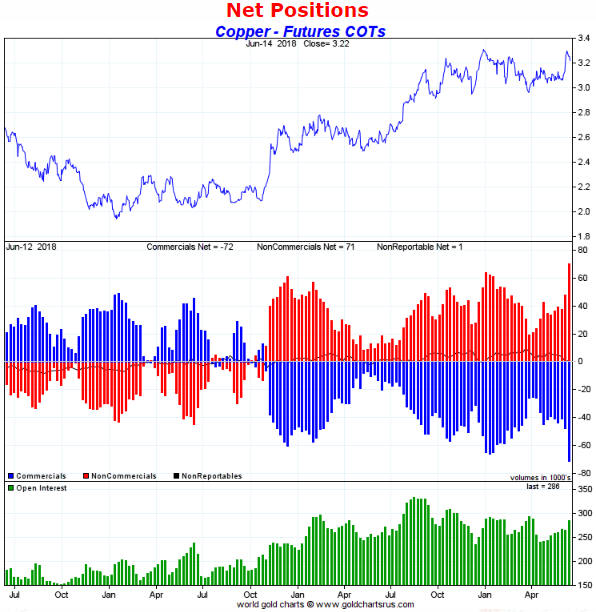
"... the current COT situation constitutes a yellow
warning flag. As illustrated by the following chart, the total speculative
net-long position in Comex copper futures is almost as big as it was when
the price was hitting a short-term top last September. If the total
speculative net-long position gains another 10K contracts or so then the
COT situation will constitute a red warning flag."
And:
"...a daily close below $3.20 would call into question the
validity of last week's breakout, whereas 1-2 weeks of consolidation in
the $3.20-$3.30 range would reduce the downside risk and potentially set
the stage for another sharp rise."
The latest COT report was
published Friday (based on data as of Tuesday 12th June) and it
constitutes a red warning flag. It shows that since the previous report
the total speculative net-long position in Comex copper futures surged by
24K contracts to an all-time high. Here's the relevant chart:
Furthermore, the following chart shows that the copper price broke
below $3.20 on Friday.
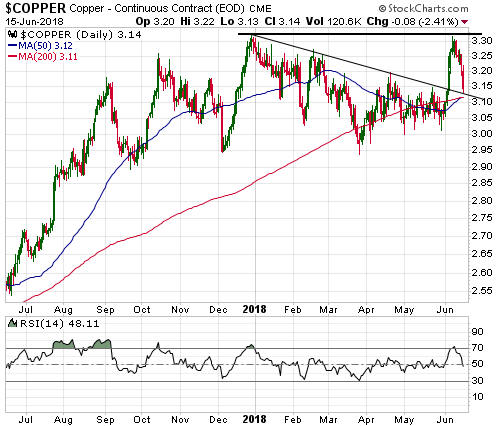
This means that the copper market hasn't followed our bullish script.
The sharp pullback in the price over the final two days of last week still
could be viewed as a test of the preceding week's upside breakout, but the
extremely aggressive speculative positioning indicated by the latest COT
report combined with Friday's decisive breach of $3.20 suggests that we
are dealing with something more bearish than a routine 1-2 week
correction. It suggests that either the previous week's move up to around
$3.30 created an intermediate-term double top, in which case a decline to
as low as the $2.50s could precede the next substantial rally, or the
price will chop around between $2.95 and $3.30 for a few more months
before resuming its multi-year upward trend.
Oil resumes
its correction
The oil price was expected to rebound by a
few dollars before resuming its downward trend, which it has done. It
looks like the downward trend resumed on Friday 15th June in parallel with
broad-based weakness in the commodity markets.
Lateral support near
$58 remains the most plausible target for a correction low.

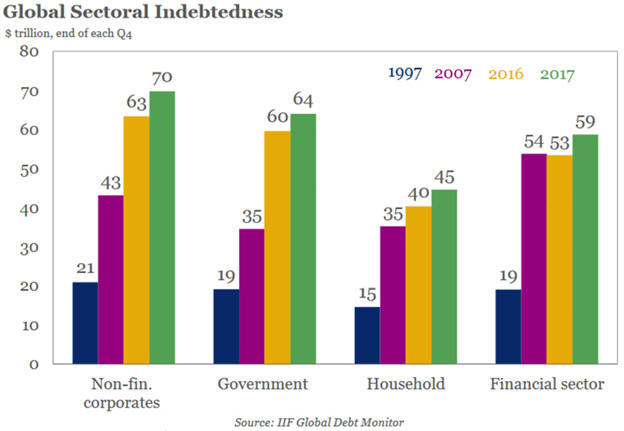
Global Debt
The following chart from the
Institute
of International Finance (IIF) is provided mainly for the sake of
interest. It shows the change in worldwide indebtedness of non-financial
corporations, government, households and financial corporations from 1997
to 2017.
For us, the main takeaways from this chart are:
1)
The incredible increase in total debt from 1997 to 2017. Total global debt
went from US$74 trillion in 1997 to US$238 trillion in 2017. This is
primarily the result of central banks attempting to mitigate the
short-term effects of one bursting credit bubble by fomenting a new credit
bubble.
2) The fact that since 2007 the growth rates of household
and financial-sector indebtedness have slowed substantially whereas
government and non-financial corporate indebtedness have continued to grow
at the same frenetic pace.
The second of the above points suggests
to us that whereas the last major crisis revolved around household and
financial sector debt, the next major crisis will be linked to excessive
corporate and government debt.
The Stock Market
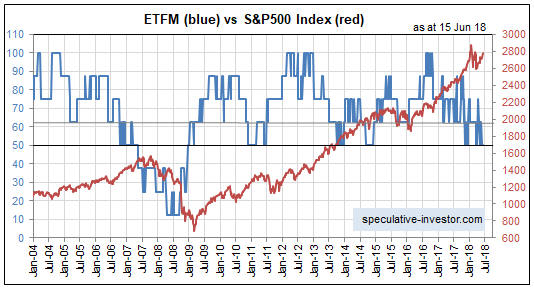
The Fundamentals
The stock-market fundamentals that matter (the monetary inflation
rate, credit spreads, the real interest rate, the yield curve and
confidence in the banking sector) are incorporated into our Equity True
Fundamentals Model (ETFM) to generate a score from 0 (max bearish) to 100
(max bullish). The ETFM's current value is 50, which is the upper end of
bearish territory. A reading of 50 constitutes a warning of
intermediate-term downside risk, but it does not constitute a warning that
a bear market will soon begin.
Referring to the following chart of
the ETFM (in blue) and the SPX, notice that the ETFM broke well below 50
in mid-2007 -- a few months prior to the start of the 2007-2009 equity
bear market. Also notice that the ETFM remained well below 50 until
late-2008.
Current Market Situation
We recently mentioned
signs that downside risk is beginning to rise in the US stock market.
These signs are the TSI Put/Call Indicator getting close to a sell signal
and the Bitcoin price getting close to a breakdown. Also, the
escalating trade war between the US and China governments could soon
start taking a toll, as the Trump decision on Friday 15th June to plough
ahead with $50B of tariffs on Chinese exports to the US prompted China's
government to announce the next day that it would impose 25% tariffs on
$34B of US commodity exports to China.
However, there are not yet
any danger signs in market internals or the SPX's price action.
In
nominal terms the SPX is still trading within the range established during
the first 6 weeks of the year. It looks like a drawn-out consolidation
pattern.
However, the SPX's performance in nominal dollar terms understates its
strength. For example, in gold terms the SPX just made a new high for the
year. In fact, it just made a new 10-year high. This is important because
the SPX tends to peak in gold terms before it peaks in dollar terms.
For another example, in euro terms the SPX has moved well into new
all-time high territory over the past three weeks.
The odds favour the market maintaining an upward bias into July.
This week's
significant US economic events
[Notes:
1) The most important events
(to the markets) are shown
in bold. 2) A list of global economic events can be found
HERE]
| Date | Description |
| Monday Jun-18 | No important events scheduled |
| Tuesday Jun-19 | Housing Starts |
| Wednesday Jun-20 |
Q1 Current Account Existing Home Sales |
| Thursday Jun-21 | No important events scheduled |
| Friday Jun-22 | No important events scheduled |
Gold and the Dollar
Anyone who wants to 'go long' the SF or who took a position (via FXF
or FXF call options) near the May low should plan to wait at least a few
weeks before buying or adding. Also bear in mind that a daily close above
the early-June high would leave almost no doubt that the anticipated
multi-month rally was underway.
The
Commodity Currencies
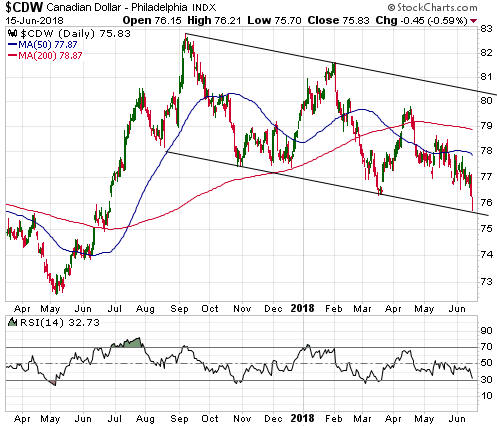
In response to the broad-based weakness
in the commodity markets over the final two days of last week, the two
senior commodity currencies (the A$ and the C$) 'took it on the chin'.
Both ended the week near support levels, though. In the A$'s case the
support being tested is the early-May low. In the C$'s case the support
being tested is the bottom of the channel that began to form last
September. Here are the relevant charts:
The A$ is our primary focus at this time. It achieved a marginal
upside breakout during the week before last and needed to stay above the
50-day MA during a near-term correction, which it failed to do. Also, it
needed to stay above 75 to keep alive the bullish signal generated by last
month's upward reversal from slightly below this level, which it failed to
do.
The A$ could bounce from near its current level, but given the
bearish signs that emerged in the commodity world last week it now looks
like this currency is going to drop at least as far as its May-2017 bottom
(73.5) before the rally we've been expecting gets underway.
Updates
on Stock Selections
Notes: 1) To review the complete list of current TSI stock selections, logon at
http://www.speculative-investor.com/new/market_logon.asp
and then click on "Stock Selections" in the menu. When at the Stock
Selections page, click on a stock's symbol to bring-up an archive of
our comments on the stock in question. 2) The Small Stock Watch List is
located at http://www.speculative-investor.com/new/smallstockwatch.html
![]() Company
news/developments for the week ending Friday 15th June 2018:
Company
news/developments for the week ending Friday 15th June 2018:
[Note: AISC = All-In Sustaining Cost, FS = Feasibility Study, FY =
Financial Year, IRR = Internal Rate of Return, ISR = In-Situ Recovery,
MD&A = Management Discussion and Analysis, M&I = Measured and Indicated,
NAV = Net Asset Value, NPV(X%) = Net Present Value using a discount rate
of X%, NSR = Net Smelter Return, P&P = Proven and Probable, PEA =
Preliminary Economic Assessment, PFS = Pre-Feasibility Study]
*Blackham Resources (BLK.AX) provided some new
information regarding its Golden Age Underground gold mine. Golden Age is
a relatively small part of the company's Matilda-Wiluna operation in
Western Australia, but its production has an outsized effect on overall
profitability due to the mine's high grade and associated low costs.
In the 26th March Weekly Update, we wrote: "Mining studies have
extended the Golden Age Underground mine plan from Jun-18 to Dec-18. This
involves about 5K ounces of additional production. Also, there's a good
chance that an underground drilling program will further extend the life
of this mine."
Last week's news is that recent drilling has
confirmed the potential to further extend the underground mine. Also,
surface drilling at Golden Age North has identified shallower
mineralisation that could be amenable to both open pit and underground
mining. This is obviously good news.
As previously mentioned, our
BLK valuation will increase from A$0.11 to A$0.13 if/when it becomes
highly probable that the company will meet or exceed its CY2018 production
target. Note that the company's production guidance is for 40K-45K ounces
during the first half of CY2018, so we are assuming this means 80K-90K
ounces for the full calendar year.
*Cobalt 27
Capital (KBLT.V) issued a press release after the close of
trading on Monday 11th June that contained good news, neutral news and bad
news.
The good news is that the company has purchased from Vale, at
a cost of US$300M, a "stream" that entitles it to cobalt production from
the Voisey's Bay (VB) nickel mine in Canada beginning on 1st January 2021.
KBLT will be entitled to 32.6% of the cobalt production from VB until
23.8M pounds have been delivered and 16.3% thereafter.
In addition
to the up-front payment of US$300M, KBLT will pay an amount equal to 18%
of the cobalt market price upon delivery of the metal. This effectively
means that once metal deliveries commence in 2021, KBLT will generate a
gross profit from the VB stream equal to the number of delivered pounds
multiplied by 82% of the cobalt market price.
Once Vale's
production ramp-up is complete, the stream is expected to provide KBLT
with 1.9M pounds/year of cobalt. Assuming US$40/pound for cobalt, this
implies annual gross profit US$62M. Applying a multiple of 15 to this
figure gives us an indicative value of US$930M for the stream. Obviously,
the stream could end up being worth a lot more or a lot less than that
depending on what happens to the cobalt price. We expect the cobalt price
to be much higher when metal deliveries begin in 2021, so from our
perspective KBLT has done a good deal.
The neutral news is that
KBLT is issuing new shares to raise C$345M to fund the purchase of the
stream.
The bad news (for existing shareholders) is that the new
shares are being sold at a large discount to the market price prior to the
announcement. Specifically, the share price closed at C$11.62 on the day
prior to the announcement and the new shares are being issued at C$9.75.
This means that the new shares are being issued at a 16% discount to what
was, in our opinion, already a fairly low price considering the per-share
net asset value (NAV). That's why the share price was down sharply on the
news.
Despite the share dilution caused by the equity financing,
with the share count rising from 52M to 88M, we reckon that the deal
announced last week is strongly accretive to KBLT's NAV. With this deal,
our estimated NAV rises from around C$14.50/share to C$17.80/share.
If we are right to be long-term bullish on cobalt then as a result of
last week's price action KBLT is now one of the best buys in the stock
market on a risk/reward basis.
![]() List
of candidates for new buying
List
of candidates for new buying
From within the ranks of TSI
stock selections the best candidates for new buying at this time, listed
in alphabetical order, are:
1) AAU (last Friday's closing price:
US$0.74)
2) CGT.TO (last Friday's closing price: C$0.28)
3)
EGD.V (last Friday's closing price: C$0.39)
4) KBLT.V (last
Friday's closing price: C$9.61)
5) PRQ.TO (last Friday's closing
price: C$1.14)
The above list is limited to five stocks. It will
sometimes contain less than five, but it will never contain more than five
regardless of how many stocks are attractively priced for new buying.
![]() Summary
of potential additions to the TSI List
Summary
of potential additions to the TSI List
Here is an updated
version of the table originally included in the 12th March Weekly Update
showing potential additions to the TSI Stocks List. The table mentions the
price at which each stock would be automatically added (unless advised
otherwise) and whether the stock would be a long-term position or a
shorter-term trade.
The table originally contained 5 stocks, but
two stocks (CGT.TO and ORA.TO) subsequently hit their buy prices and were
added to the List. Also, the buy price of SBB.TO has been raised from
C$1.45 to C$1.53.
Chart Sources
Charts appearing in today's commentary
are courtesy of:
http://stockcharts.com/index.html
http://www.goldchartsrus.com/