|
-- Weekly Market Update for the Week Commencing
18th November 2013
Big Picture
View
Here is a summary of our big picture
view of the markets. Note that our short-term views may differ from our
big picture view.
In nominal dollar terms, the BULL market in US Treasury Bonds
that began in the early 1980s will end by 2013. In real (gold)
terms, bonds commenced a secular BEAR market in 2001 that will continue
until 2014-2020. (Last
update: 23 January 2012)
The stock market, as represented by the S&P500 Index,
commenced
a secular BEAR market during the first quarter of 2000, where "secular
bear market" is defined as a long-term downward trend in valuations
(P/E ratios, etc.) and gold-denominated prices. This secular trend will bottom sometime between 2014 and 2020.
(Last update: 22 October 2007)
A secular BEAR market in the Dollar
began during the final quarter of 2000 and ended in July of 2008. This
secular bear market will be followed by a multi-year period of range
trading.
(Last
update: 09 February 2009)
Gold commenced a
secular bull market relative to all fiat currencies, the CRB Index,
bonds and most stock market indices during 1999-2001.
This secular trend will peak sometime between 2014 and 2020.
(Last update: 22 October 2007)
Commodities,
as represented by the Continuous Commodity Index (CCI), commenced a
secular BULL market in 2001 in nominal dollar terms. The first major
upward leg in this bull market ended during the first half of 2008, but
a long-term peak won't occur until 2014-2020. In real (gold) terms,
commodities commenced a secular BEAR market in 2001 that will continue
until 2014-2020.
(Last
update: 09 February 2009)
Copyright
Reminder
The commentaries that appear at TSI
may not be distributed, in full or in part, without our written permission.
In particular, please note that the posting of extracts from TSI commentaries
at other web sites or providing links to TSI commentaries at other web
sites (for example, at discussion boards) without our written permission
is prohibited.
We reserve the right to immediately
terminate the subscription of any TSI subscriber who distributes the TSI
commentaries without our written permission.
Outlook Summary
Market
|
Short-Term
(1-3 month)
|
Intermediate-Term
(6-12 month)
|
Long-Term
(2-5 Year)
|
|
Gold
|
Neutral
(04-Nov-13)
|
Bullish
(26-Mar-12)
|
Bullish
|
|
US$ (Dollar Index)
|
Neutral
(24-Dec-12)
|
Neutral
(18-Sep-13)
|
Neutral
(19-Sep-07)
|
|
Bonds (US T-Bond)
|
Neutral
(11-Nov-13)
|
Neutral
(18-Jan-12)
|
Bearish |
|
Stock Market
(DJW)
|
Neutral
(18-Nov-13)
|
Bearish
(28-Nov-11)
|
Bearish
|
|
Gold Stocks
(HUI)
|
Neutral
(04-Nov-13)
|
Bullish
(23-Jun-10)
|
Bullish
|
|
Oil |
Neutral
(30-Jul-12)
|
Neutral
(31-Jan-11)
|
Bullish
|
|
Industrial Metals
(GYX)
|
Bearish
(06-Nov-13)
|
Bearish
(13-Nov-13)
|
Neutral
(11-Jan-10)
|
Notes:
1. In those cases where we have been able to identify the commentary in
which the most recent outlook change occurred we've put the date of the
commentary below the current outlook.
2. "Neutral", in the above table, means that we either don't have a
firm opinion or that we think risk and reward are roughly in balance with respect to the timeframe in question.
3. Long-term views are determined almost completely by fundamentals,
intermediate-term views by
fundamentals, sentiment and technicals, and short-term views by sentiment and
technicals.
US Monetary Inflation
Update
Total US commercial bank credit has shrunk
by about $50B over the past 6 months. Fortunately, from the perspective of those
who believe that the economy is helped by monetary inflation, the Fed is picking
up the slack.
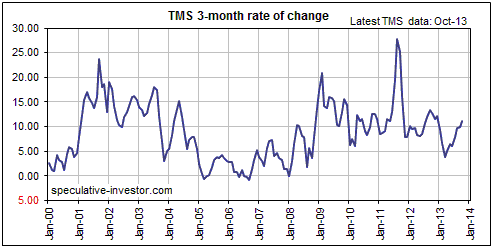
Despite getting no assistance from the private banking industry, the following
chart shows that the Fed has managed to boost the annualised 3-month rate of
growth in the True Money Supply (TMS) from a low of just below 4% at the end of
March to around 11% at the end of October. That's the result of monetising
$85B/month in debt securities.
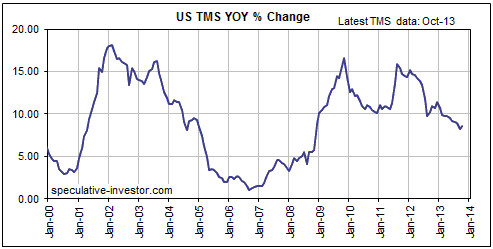
The next chart shows that the year-over-year rate of growth in US TMS has been
trending downward since the third quarter of 2011. However, the recent
acceleration in the shorter-term (3-month) monetary inflation rate has at least
temporarily arrested the decline in the year-over-year rate. This is evidenced
by the uptick in the year-over-year rate from about 8.2% in September to about
8.6% in October.
As we've said in the past, it's possible that the next financial/economic crisis
will begin with the monetary inflation rate at a higher level than it was prior
to the starts of previous crises (the 2000-2002 and 2007-2009 crises began after
the monetary inflation rate dropped below 5%). As we've also said in the past,
it isn't possible for the Fed to put off a crisis indefinitely by maintaining a
high rate of money-supply growth. The reason is that each new round of money
pumping causes distortions that inevitably result in some form of economic bust.
Trying to put off the bust indefinitely via increasingly large monetary
injections will only add to the risk that the next bust will occur in parallel
with a rapidly-rising cost of living rather than a falling cost of living.
The Stock
Market
Stock markets around the world are at
different degrees of 'overbought'. Here's what we mean:
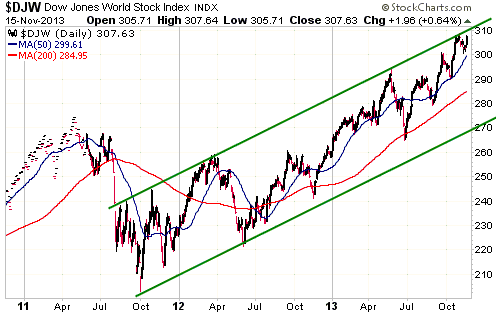
The Dow Jones World Stock Index (DJW) ended last week just below the top of an
upward-sloping channel that has defined its extremes over the past two years. In
particular, every rise by this index to the top of its 2-year price channel has
been followed by a decline to the bottom quartile of the channel.
The DJW is 'overbought', but no more 'overbought' than it was prior to the
May-June 10% pullback.
What is the chance that the DJW will make a solid break above the top of its
intermediate-term upward-sloping channel?
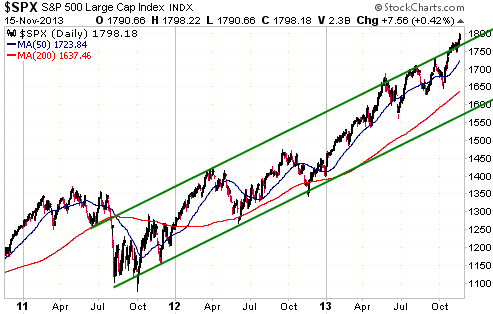
Ordinarily the chance would be very slim, but the following chart shows that the
US S&P500 Index has just broken above the top of a similar upward-sloping
channel. This means that the S&P500 has just joined the NASDAQ100 in upside
blow-off mode and that these are not ordinary times.
A lot of commentators are expecting the upside blow-off to continue and there is
breathless talk of the S&P500 zooming directly to 2000. Even some well-known
bears are acknowledging the possibly that prices could quickly move higher from
here.
Will the stock market accommodate the "melt up" forecasts of the overwhelming
bullish majority?
The odds are against it, but we won't be able to rule out the possibility until
there is clear evidence of a trend reversal. Preliminary evidence of a breakout
failure and a trend reversal would be a daily close below the low of the past
two weeks (1746 for the S&P500).
In recognition of the possibility that the upside blow-off in the US stock
market will continue and take other markets along for the ride, our short-term
stock market outlook, which shifted to "bearish" just two weeks ago, has shifted
back to "neutral".
Before we leave the stock market, there's one more chart we want to show.
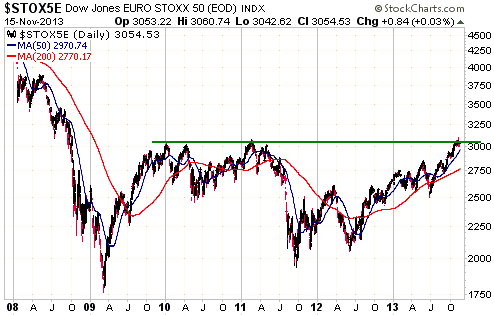
The following chart illustrates that large-cap European stocks, as represented
by the EURO STOXX50 Index (STOX5E), are short-term 'overbought' and at
resistance. However, on an intermediate-term basis and a long-term basis the
STOX5E is not close to being 'overbought'. In fact, it could be in the process
of completing a multi-year base.
This week's
important US economic events
| Date |
Description |
| Monday Nov 18 |
TIC Report
Housing Market Index | | Tuesday
Nov 19 |
Employment Cost Index | | Wednesday
Nov 20 |
CPI
Retail Sales
Business Inventories
FOMC Minutes
Existing Home Sales | | Thursday
Nov 21 |
PPI
Philadelphia Fed Survey
|
| Friday Nov 22 |
No important events scheduled |
Gold and
the Dollar
Gold
The COMEX Stockpile Controversy
We've dealt with this issue before, but based on comments received from our
readers it is worth revisiting. The question is: Does this year's large decline
in the COMEX gold inventory provide any clues about gold's likely future
performance or anything else of importance for those invested in gold? The short
answer is no.
As evidence we present the following long-term chart from the excellent
Sharelynx.com site. The chart is split
into four sections, which, from top to bottom, show the gold price, the COMEX
futures open interest expressed in terms of millions of ounces, COMEX gold
stocks (the total amount of physical gold stored in COMEX-approved warehouses)
expressed in terms of millions of ounces, and the ratio of open interest to gold
stocks. The larger the open-interest/gold-stocks ratio, the smaller the quantity
of physical gold that 'backs' the open futures contracts.
If you compare the first and third sections of the chart you should notice that
major trends in the COMEX stockpile FOLLOW major trends in the gold price, and
that this year's sharp decline in the COMEX inventory is consistent with the
performance of the gold price. The fact is that based on the record of the past
40 years, a major decline in the COMEX inventory should be expected to accompany
a major decline in the gold price.
Our point, in a nutshell, is that large moves in the COMEX inventory are
effects, not causes, of large changes in the gold price. At least, that's the
way the inventory-price relationship has worked up until now. Consequently, it
would have been very strange if this year's price action had NOT gone
hand-in-hand with a substantial decline in the COMEX stockpile.
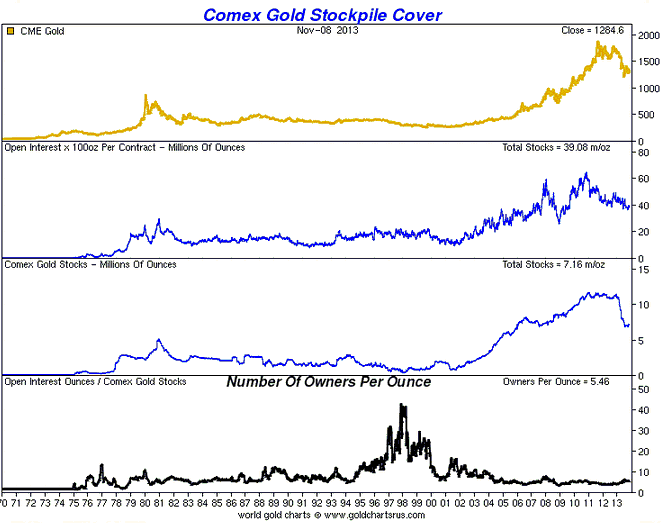
The bottom section of the chart shows that there is presently about 1 ounce of
physical gold in COMEX warehouses for every 5.5 ounces covered by open futures
contracts. This is close to the average for the past 10 years.
Some commentators have pointed out that while the total amount of gold in COMEX
warehouses is at an average level relative to the open interest in gold futures,
the amount of "registered" gold in COMEX warehouses is abnormally low. This is
supposed to be important because only "registered" gold can be delivered against
a futures contract.
We don't have long-term data on "registered" gold inventory, so we don't know
how the quantity of "registered" gold reacted to large price movements prior to
2003. However, we have no reason to believe that this is an important
fundamental development. First, under normal conditions very few 'longs' in the
gold futures market request delivery of the physical, and the speculative
'longs', as a group, would be even less inclined to take delivery when the gold
price is trending downward. Second, there was no consistent correlation between
changes in "registered" gold stocks and the gold price over the 11-year period
for which we do have data. Third, the peak-to-trough change in the "registered"
gold stockpile over the past few years is only about 2.5M ounces, which is a
trivial amount relative to the overall market.
Before leaving this topic it is worth taking a quick look at the behaviour of
the COMEX silver stockpile.
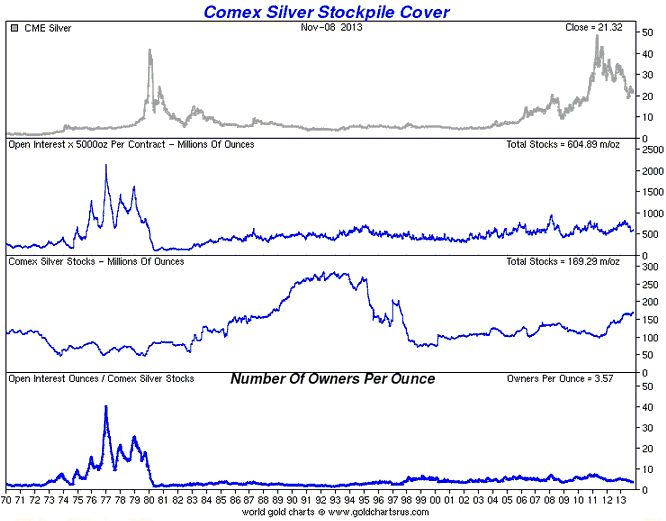
The chart below (also courtesy of Sharelynx.com) is the same as the chart above,
except that it deals with silver instead of gold. Interestingly, unlike the gold
market, where major trends in the COMEX inventory follow major price trends, in
the silver market there has been no consistent historical relationship between
major changes in the COMEX stockpile and major price changes. Just as
interestingly, the COMEX silver stockpile is presently near a 15-year HIGH and
the ratio of silver ounces in COMEX inventory to COMEX open interest is also
near a 15-year high. If, as some commentators claim, the relatively low COMEX
gold inventory is a reason to be bullish on gold, then why isn't the relatively
high silver inventory a reason to be bearish on silver?
Our view is that a relatively low COMEX inventory level is not a good reason to
be bullish on gold or silver and a relatively high COMEX inventory level is not
a good reason to be bearish on gold or silver. The COMEX inventory level is
simply not important.
Current Market Situation
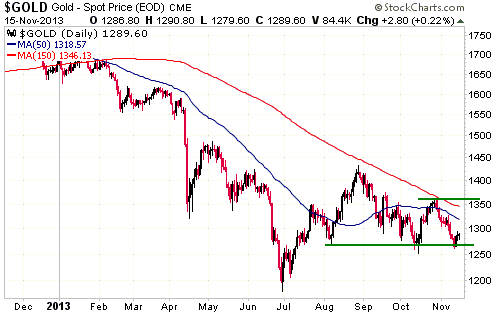
Gold held support at $1270 'by the skin of its teeth' last week.
The short-term parameters are clear. A daily close below $1270 would indicate
that gold was very likely going to drop back to the vicinity of its June low
($1150-$1200) before completing its bear market, whereas a daily close above the
late-October high ($1362) would leave little room for doubt that the bear market
was over.
Gold Stocks
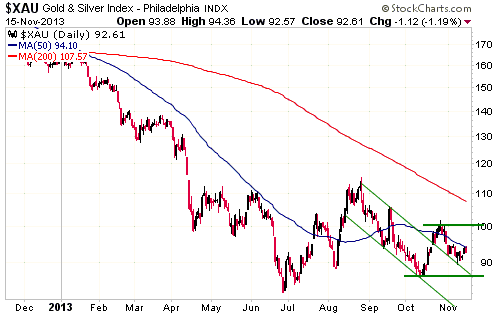
The XAU's price action over the past 6 months can be interpreted as either a
major bottoming pattern or a flat consolidation within a continuing bear market.
Given the length and magnitude of the preceding decline, it's far more likely to
be the former. However, even if we are dealing with the major-bottoming-pattern
interpretation there could still be a final short-lived spike to a new
multi-year low between now and year-end.
Last week's price action was non-committal, but within the coming fortnight we
should have a clear picture as to whether or not the gold-mining bulls will be
forced to endure a spike to a final low. We would now consider a daily close
above the late-October high (an XAU level of just above 100) as persuasive
evidence that THE bottom is in, whereas a daily close below the mid-October low
would tell us that the ultimate bear-market low was not yet in place.
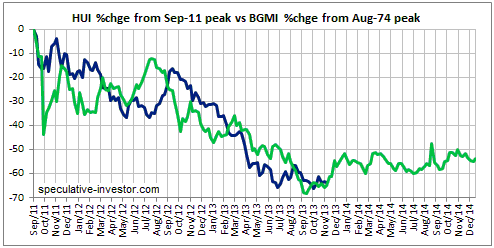
Below is an update of our comparison between the Barrons Gold Mining Index (BGMI)
from its 1974 peak and the HUI from its 2011 peak. Up until early September the
HUI's performance was a better fit with the 1968-1970 major correction than with
the 1974-1976 major correction, but over the past 2.5 months it has more closely
matched the price action of 1976.
For the HUI to continue to closely follow the path of the mid-1970s BGMI, a
rally will have to begin this week.
The lower gold price has forced gold producers to operate smarter, leading to
lower production costs. This will pay dividends during the first two years of
the next cyclical advance in the gold price, just as a similar situation paid
dividends for gold-mining investors during 2001-2003.
Currency Market Update
The following chart shows the tight inverse relationship between the Yen and the
Japanese stock market (represented by the Nikkei 225 Index) over the past two
years. Last week the Nikkei broke out to the upside from a 5-month
consolidation. The Nikkei's upside breakout naturally -- considering the
historical relationship -- coincided was a downside breakout in the Yen. Neither
breakout is supported by valuation, but price is capable of making a large move
counter to valuation.
There is no telling if there will be much follow-through in the directions of
the recent Yen and Nikkei breakouts, although, at a minimum, tests of the
May-2013 extremes are likely.
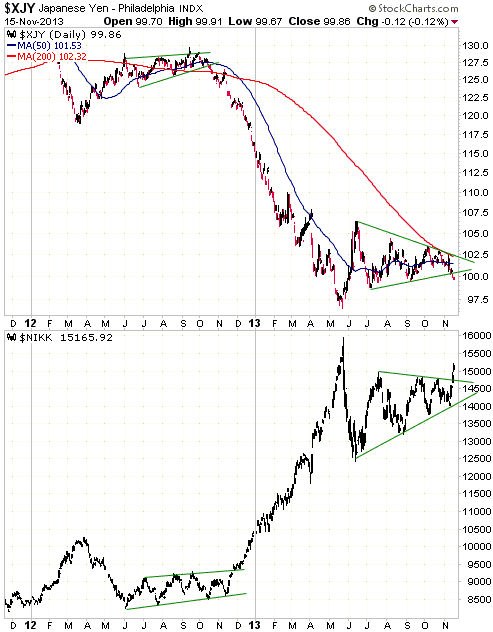
Considering that Yen bounces over the past six weeks ended at or just below the
200-day MA, it would now be reasonable to view a daily close above this MA as a
signal that the Yen's intermediate-term trend had reversed.
We have some long-term exposure to the Yen, in that about 10% of our cash
reserve is Yen-denominated. This is due to our assessment that the Yen will
continue to do a relatively good job of maintaining its purchasing power. We are
retaining this long-term exposure, but have no immediate intention of adding to
it.
The next chart shows the general tendency of the Dollar Index to track the
SPX/STOX5E ratio (large-cap US equities relative to large-cap European
equities). The Dollar Index tends to strengthen when US equities are
outperforming (rising faster than or falling slower than) European equities and
to weaken when US equities are underperforming. Notice that the recent rebound
in the Dollar Index coincided with relative strength in US equities.
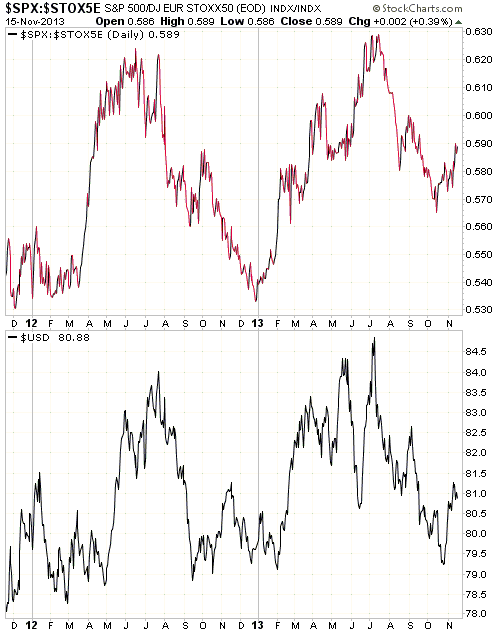
Considering only the price action, the recent rebound in the Dollar Index looks
like it could be the start of an intermediate-term rally. However, US equities
are on average far more expensive than their European counterparts, so for the
US$ rally to be sustained beyond the short-term the US stock market will have to
overcome a strong valuation-related headwind. Also, the recent US$ bottom did
not coincide with an anti-US$ sentiment extreme, and despite the fact that the
price bottom was only two weeks ago speculators, as a group, have already become
optimistic about the dollar's prospects. This matters because intermediate-term
rallies usually begin at sentiment extremes and are initially greeted with
skepticism.
Update
on Stock Selections
Notes: 1) To review the complete list of current TSI stock selections, logon at
http://www.speculative-investor.com/new/market_logon.asp
and then click on "Stock Selections" in the menu. When at the Stock
Selections page, click on a stock's symbol to bring-up an archive of
our comments on the stock in question. 2) The Small Stock Watch List is
located at http://www.speculative-investor.com/new/smallstockwatch.html
 Company
news/developments for the week ended Friday 15th November 2013: Company
news/developments for the week ended Friday 15th November 2013:
[Note: AISC = All-In Sustaining Cost, FS = Feasibility Study, IRR =
Internal Rate of Return, MD&A = Management Discussion and Analysis,
M&I = Measured and Indicated, NAV = Net Asset Value, NPV(X%) = Net
Present Value using a discount rate of X%, P&P = Proven and
Probable, PEA = Preliminary Economic Assessment, PFS =
Pre-Feasibility Study]
*Almaden Minerals (AAU) issued its quarterly reports for the
September quarter. The financial statements showed that the company
had $16.8M of working capital at 30th September. This means that AAU
should be fully funded for at least the next 12 months.
*Endeavour Mining (EDV.TO, EVR.AX) published its results for the
September quarter.
Production during the quarter was 88K ounces (a record-high) at an
AISC of $1,057/oz. This means that EDV is now producing gold at the
rate of about 350K ounces/year, which is at the upper end of the
company's guidance. The production rate is expected to increase to
more than 400K ounces/year in Q1-2014 due to the start-up of the
Agbaou mine.
The financial statements showed that working capital was ample at
$164M and that net debt (long-term debt plus long-term derivative
liabilities minus working capital) increased from $118M at the end
of June to $144M at the end of September, or by $26M. The increase
in net debt was more than fully explained by the $43M that was spent
on growth-related projects (primarily: the new Agbaou mine).
EDV's cash-flow performance was markedly better than its earnings
performance during the latest quarter. This was mainly due to the
fact that there was an amount of about $22M for "depreciation and
depletion" charged against earnings, but the company only spent
about $5M on sustaining capital. This continues a pattern seen over
the past few quarters. For example, over the first 9 months of this
year the company's earnings were reduced by about $70M due to
accounting entries for "depreciation and depletion", but only about
$11M was spent on sustaining capital over the same 9-month period.
This bears watching closely, as it could mean that EDV will have to
ramp-up capital and exploration spending at its existing operations
over the next couple of years.
All in all, it was an OK quarterly performance by EDV.
EDV has the lowest stock market valuation that we know of among the
financially-strong 100K-500K oz/year gold producers.
*Energy Fuels (EFR.TO) published its results for the September
quarter. Production at the company's White Mesa mill totaled 180,000
pounds of uranium during the quarter, bringing 2013 uranium
production up to around 1M pounds.
At 30th September 2013 the company had $32.5M of working capital,
which is down from $33.8M at 30th June 2013. Subsequent to the end
of the quarter the company added $5M to its working capital via an
equity financing.
EFR has long-term uranium contracts with a floor price of about
$58/pound. At the current spot uranium price of around $35/pound it
makes more sense for EFR to purchase uranium on the spot market and
deliver it into the long-term contracts, thus earning a risk-free
profit of about $23/pound, than to produce uranium, especially
considering that its production cost is about $40/pound. Buying on
the spot market for delivery into long-term contracts is exactly
what EFR's management plans to do over the next 12 months.
Specifically, the company is obligated under existing contracts to
supply 800K pounds of uranium to its customers next year at a floor
price of $58/pound. It plans to obtain 300K pounds of this
contracted supply by purchasing uranium on the spot market and to
reduce its production to around 500K pounds.
With at least $35M of working capital at the moment and the ability
to generate significant cash-flow via the spot-contract arbitrage
mentioned above, EFR should be able to weather the storm. However,
it will need a new bull market in the uranium price to start
providing good returns to shareholders.
We continue to anticipate a new uranium bull market, but it is
obviously taking a lot longer than expected to get underway.
Fundamental drivers of the new bull market include the recent end of
the "Megatons to Megawatts" program, reduced mine supply stemming
from the low price, and the re-starting of most of Japan's nuclear
reactors.
*Lydian International (LYD.TO) published its results for the
September quarter.
LYD's working capital was $12.4M at the end of September, which
means that about $6.5M was spent during the quarter. The rate of
spending should be lower during the next 2-3 quarters, so LYD
probably has enough money to complete the revised FS for the Amulsar
gold project (the revised FS is scheduled to be complete in
Q2-2014). However, another financing is likely during the first half
of next year.
*Pilot Gold (PLG.TO) published its results for the September
quarter.
For a mining-exploration company such as PLG, the only useful new
information in the quarterly reports will usually be the working
capital position. The reason is that all other pertinent
developments will usually have been covered in earlier press
releases.
PLG's working capital was $23.6M at the end of September, which
means that about $6M was spent during the quarter. At its current
rate of spending PLG is funded through to around September of next
year.
With its highly regarded management and its high-potential projects,
PLG is unlikely to have trouble getting additional funding as
needed.
*Premier Gold (PG.TO) published its results for the September
quarter. PG's quarterly financial statements showed that working
capital was about $70M at the end of September, down from $82M at
the end of June. PG appears to be fully funded for the next two
years.
*Rio Alto (RIOM, RIO.TO) published its results for the September
quarter.
Production during the quarter was 59K ounces at an AISC of only
$808/oz. With such a low production cost you'd expect that RIO would
be profitable, which it certainly is. During the latest quarter the
company had net income of $15.9M, or $0.09/share. If we annualise
this quarterly result we find if RIO's price doubled from here it
would still be trading at only 10-times earnings.
It was a good quarter for RIO, but if we were intent on nitpicking
we would point out that the company's free cash-flow was a lot less
than its earnings. By comparing the balance sheet at 30th September
with the balance sheet at 30th June, we calculate that RIO generated
about $8M of cash during the latest quarter. The difference between
earnings and free cash flow is primarily due to the company's
spending on property, plant and equipment being about $8M higher
than its amortisation/depreciation charge.
RIO is on track to achieve even better results in the December
quarter, with higher production and even lower costs.
The fact that RIO's stock price continues to languish near
multi-year lows despite its good operational performance is mostly
indicative of the current lousy market for gold mining shares.
However, companies such as RIO and EDV that are performing well on
the ground should be among the first gold miners to recoup their
stock-market losses of the past 2 years.
*Ramelius Resources (RMS.AX) announced bad news and good news last
Wednesday. The good news was obviously announced in an effort to
offset the effect of the bad news. Unfortunately, the bad news was a
lot more significant than the good news.
The bad news is that the electric motor that drives the ball mill at
RMS's Mt Magnet processing plant failed on 9th November and will
take 6-8 weeks to repair. During this period the plant capacity will
be reduced by about 50%, which will naturally cause the
December-quarter production to be materially lower than previously
forecast. According to the company, updated production guidance will
be provided in early December.
The good news relates to some narrow, high-grade gold intercepts
from initial drilling at the newly-acquired Vivien gold project.
This news is not significant.
*Sabina Gold and Silver (SBB.TO) published its results for the
September quarter. SBB's quarterly financial statements showed that
working capital was about $65M at the end of September, which means
that about $25M was spent during the quarter.
The second and third quarters of the year are when SBB does the bulk
of its spending, because this is the only part of the year when the
weather in Canada's far north enables drilling to be carried out.
The rate of spending should be a lot lower over the next two
quarters.
SBB appears to be fully funded until at least the third quarter of
next year.
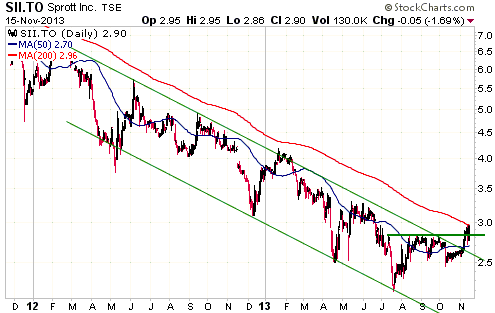
*Sprott Inc. (SII.TO) reported its results for the September
quarter. EBITDA was $6M and the bottom-line profit result was $13M
($0.06/share). In the June quarter the company made a bottom-line
loss of $6.7M. Assets under management rose marginally from $7.1B at
the end of June-2013 to $7.3B at the end of September-2013. The
company maintained its quarterly dividend at $0.03/share.
In the 12th August Weekly Update we wrote that SII's profitability
would probably hit its low for the cycle in either the
just-completed June quarter or the current (September) quarter, and
that the stock price possibly made its cyclical low in July. The
return to profitability during the September quarter is evidence
that the June quarter was the low for the underlying business, and
the recent upside breakout in the stock price (see chart below) is
evidence that the stock did, indeed, make its bottom for the cycle
during July.
 Candidates
for new buying Candidates
for new buying
From within the ranks of TSI stock selections, below is a list of the best
candidates for new buying at this time. Note that for this list of 'best buys'
to be useful we must limit it to 5 stocks or less. This could involve not
mentioning stocks that offer excellent value and are good -- but not among the
best few -- candidates for new buying. Note as well that the stocks included in
this list of 'best buys' do not necessarily offer the best value. In the current
market environment we are placing more emphasis than usual on risk, meaning that
we could view a more expensive stock as a better candidate for new buying due to
its lower risk.
Due to our focus on risk, this week's list contains only three stocks. As well
as being very 'oversold' and offering excellent value, these companies have
relatively low risk by virtue of being very profitable at the current gold price
(in the case of EDV and RIO) or being valued by the market at less than cash in
the bank (in the case of AKG).
1) AKG (last Friday's closing price: US$2.09)
2) EDV.TO/EVR.AX (last Friday's closing price: C$0.61)
3) RIO.TO/RIOM (last Friday's closing price: C$1.78/US$1.72)
Chart Sources
Charts appearing in today's commentary
are courtesy of:
http://stockcharts.com/index.html

|

