![]()
![]()
![]()
![]()
-- Weekly Market Update for the Week Commencing 19th February 2018
Big Picture
View
Here is a summary of our big picture
view of the markets. Note that our short-term views may differ from our
big picture view.
The BULL market in US Treasury Bonds that began in the early 1980s ended in mid-2016, but there will be many years of topping action in bond prices and bottoming action in bond yields before major new trends get underway. A major decline in government bond prices will unfold during the 2020s. (Last update: 11 September 2017)
The stock market, as represented by the S&P500 Index, commenced a secular BEAR market during the first quarter of 2000, where "secular bear market" is defined as a long-term downward trend in valuations (P/E ratios, etc.), gold-denominated prices and inflation-adjusted prices. This secular trend will bottom in 2020 or later. (Last update: 11 September 2017)
A cyclical BEAR market in the US Dollar began in 2016-2017. (Last update: 11 September 2017)
Gold commenced a secular bull market relative to all fiat currencies, the CRB Index, bonds and most stock market indices during 1999-2001. This secular trend will peak in 2020 or later. (Last update: 11 September 2017)
Commodities,
as represented by the CRB Index, commenced a
secular BULL market in 2001 in nominal dollar terms. The first major
upward leg in this bull market ended during the first half of 2008, but
a long-term peak won't occur until 2020 or later.
(Last
update: 11 September 2017)
Copyright
Reminder
The commentaries that appear at TSI
may not be distributed, in full or in part, without our written permission.
In particular, please note that the posting of extracts from TSI commentaries
at other web sites or providing links to TSI commentaries at other web
sites (for example, at discussion boards) without our written permission
is prohibited.
We reserve the right to immediately
terminate the subscription of any TSI subscriber who distributes the TSI
commentaries without our written permission.
True
Fundamentals Summary
[Notes:
1) The date shown next to the current True Fundamentals Model (TFM) signal is
when the most recent change occurred. 2) Charts of the Gold and Equity
TFMs are included in the "Charts and Indicators" section of the TSI web
site]
| Market | True Fundamentals Model (TFM) |
| Gold (US$ Price) | Bearish (12 Jan 2018) |
| US Equity (SPX) | Neutral (12 Jan 2018) |
| Currency (Dollar Index) | Bullish (15 Dec 2017) |
| Commodities (GNX) | Bullish (29 Dec 2017) |
Last week's posts at the TSI Blog
For gold and bitcoin, the cost of mining follows the price
Summary of current
thinking/positioning
1) Thinking that the US$ gold
price will work its way downward over the next few weeks but will go on to
make new highs for the year during the second quarter. However,
acknowledging the possibility that a downside breakout in the Dollar Index
will cause an earlier-than-anticipated upside breakout in the US$ gold
price.
2) Expecting 1-2 more weeks of consolidation in the stock
market followed by another fast decline that tests or breaches the
early-February low. Although not the most likely outcome, there is a
realistic chance that the SPX will trade as low as 2200 before the end of
Q1.
3) Thinking that industrial commodities such as oil and copper
are in downward trends that will end in March.
4) Expecting the
Dollar Index (DX) to rebound for a few weeks before resuming its
longer-term downward trend, but acknowledging that a break below the
recent lows could set in motion a wave of speculative selling that drives
the DX sharply lower. Consequently, not interested in betting on
short-term US$ strength even though it is the most likely outcome.
5) Thinking that the T-Bond's short-term risk and reward are now in
balance, meaning that the best place for short-term traders to be is on
the sidelines.
6) Holding a cash reserve of 25%-30% and looking for
opportunities to increase it.
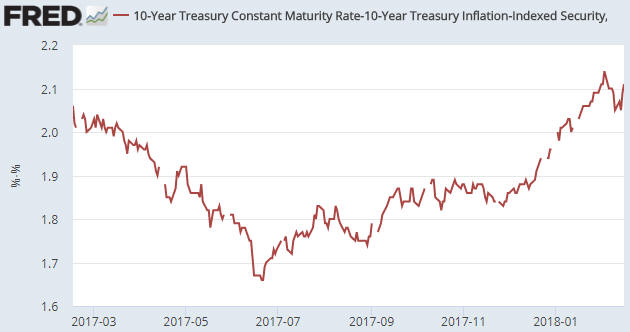
Inflation
expectations peaked with the stock market
The recent rise in long-term US
interest rates does not appear to be related to concerns about increasing
"price inflation". We say this because the 10-year Expected CPI (the
difference between the yields on the 10-year T-Note and the 10-year TIPS)
peaked with the stock market about three weeks ago. The Expected CPI rose
last week, but it remains below its recent high and was declining while
bond yields were rising during the first half of February.
Here is
a chart of the 10-year Expected CPI covering the past 12 months.
Rising inflation expectations will be the primary driver of rising
interest rates over the years ahead, but the recent increase in long-term
interest rates appears to have been driven more by fear of rising bond
supply than fear of currency depreciation.
It seems to have dawned
on bond traders that if there's one thing that the US Republicans and
Democrats agree on it's that government spending should be ramped up. The
only political disagreement is on how the higher rate of spending should
be paid for. The Democrats want to pay for bigger government by trying to
extract more money from 'the rich', whereas the Republicans like to
pretend that no payment is required.
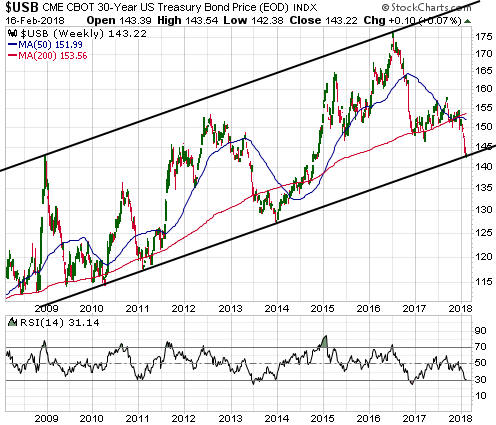
T-Bond Update
The Big Picture
The evidence continues to build that the T-Bond made a secular top in
July-2016, but the evidence is not yet conclusive.
Unless the
T-Bond gains more than 3.5 points over the next 7 trading days, more
evidence of a secular top will arrive at the end of February in the form
of a monthly close below the 84-month moving average (MA). This is
something that hasn't happened in more than 18 years and has happened only
twice since 1990. Refer to the following monthly T-Bond chart for details.
Actually, more evidence of a secular top could arrive as soon as this
coming Friday. This is because the T-Bond ended last week at the bottom of
a 10-year price channel, meaning that a net decline over the course of the
week ahead would break the T-Bond below the bottom of its 10-year channel.
Refer to the following weekly T-Bond chart for details.
But even if the T-Bond breaks below its channel bottom this week and
ends February below its 84-month MA, the evidence of a secular reversal
won't be conclusive. That's because the situation could then be similar to
late-1994 or late-1999.
In late-1994 the T-Bond achieved a single
monthly close below its 84-month MA, but then reversed upward on an
intermediate-term basis. And in late-1999 the T-Bond achieved consecutive
monthly closes below its 84-month MA before reversing upward on an
intermediate-term basis.
There's no magical level that the T-Bond
would have to break below to remove all doubt that the secular trend has
changed from up to down, but if such a change has occurred then what
should happen over the months/years ahead is that the former limits on
intermediate-term declines become limits on intermediate-term rallies. An
example would be the 84-month MA becoming resistance.
Current Market Situation
For two main reasons we think it
makes sense to take profits on bearish T-Bond speculations now.
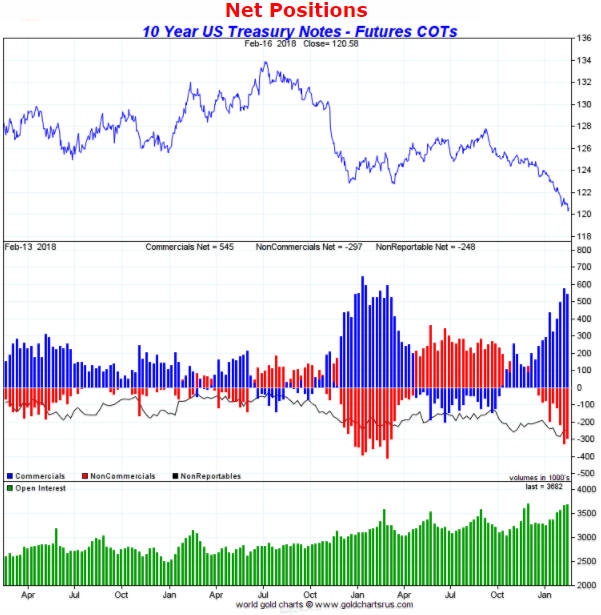
The
first reason is sentiment as indicated by the COT data. Specifically, the
sum of the speculative net-short positions in T-Bond futures and 10-year
T-Note futures is now large enough to fuel something more than a routine
counter-trend bounce.
The COT situation for 10-year T-Note futures
is illustrated by the following weekly chart. Notice that the total
speculative net-short position in this market is now almost as extreme as
it was at the Q1-2017 price bottom.
The second reason is that a further significant decline in the T-Bond
price over the weeks ahead would be the catalyst for a much larger decline
in the stock market. This means that if you are short-term bearish on the
bond market it would make more sense for you to have a bearish stock
market position than a bearish bond market position.
Therefore,
TBT (our current vehicle for betting against the Treasury market) has been
removed from the TSI List. The result of this short-term trade was a gain
of about 12%.
We expect to re-enter TBT within the coming two
months.
The Stock Market
Differentiating a
bull-market correction from the start of a bear market
We
think that the current stock market (basis the S&P500 Index) correction
will run its course over the coming month or so and be followed by a move
to a new high during the second quarter. The stage could then be set for a
larger/longer correction or a bear market to begin during the second half
of the year.
However, there can be a big difference between what we
think the markets are going to do and what they actually do. We must
therefore regularly compare the price action with our expectations to
identify, as soon as practicable, the times when our expectations aren't
in line with reality.
In determining if our broad-brush
expectations of what the stock market will do this year remain in line
with market reality, the monthly performance of the S&P500/euro ratio
should be useful. The reason is that the long-term upward trend in this
ratio has been so consistent that a loss of consistency would be a 'red
flag'.
The consistency we are referring to is performance in
relation to the 24-month moving average (MA). As illustrated by the
following monthly chart, with the exception of the final stage of the
drawn-out correction of 2010-2011 the SPX/euro ratio has not ended a month
below its 24-month MA since 2009. It traded below this MA during the
2015-2016 correction and again during the week before last, but in each
case it managed to avoid a monthly-closing breach of the MA.
The
consistency of SPX/euro's long-term upward trend was also present during
the 2004-2007 cyclical bull market. SPX/euro tested its 24-month MA many
times during this earlier bullish period but didn't end a month below it
until November-2007 -- the month after the nominal SPX made its
bull-market top.

Further to the above, we would view a monthly close by SPX/euro below
its 24-month MA as a sign that the bull market was over. According to our
current view, this won't happen during the first quarter but potentially
will happen during the second half of the year. In other words, if
SPX/euro were to end February or March below its 24-month MA it would
suggest that the decline from the January-2018 peak was the start of a
major bearish trend as opposed to just a steep short-term correction.
The warning shots of 2007
For a market analyst
there is an irresistible temptation to seek out one or more historical
parallels to the current situation. The idea is that clues about what's
going to happen in the future can be found by looking at what happened
following similar price action in the past. Sometimes this method works,
sometimes it doesn't.
Assuming that the decline from the
January-2018 peak is a short-term correction that will run its course
before the end March, we think the recent price action is akin to what
happened in February-March of 2007. In late-February of 2007 the SPX had
been grinding its way upward in relentless fashion for many months. The
VIX was near an all-time low and there was no sign in the price action
that anything untoward was about to happen, even though some cracks had
begun to appear in the mortgage-financing and real-estate bubbles. Then,
out of the blue, there was a 5% plunge in the SPX. On the following daily
chart this plunge is labeled "Warning shot 1".
After the
February-March 'hiccup' the SPX resumed its bull market. Both the stock
market and the economy were believed to be in good shape, with the
problems that had emerged in the realm of sub-prime mortgage lending
generally considered to be contained to that relatively-unimportant part
of the economy. No less of an authority than Ben Bernanke assured us that
the sub-prime lending problems were, indeed, contained.
The upward
trend continued until mid-July, at which point another 'out of the blue'
plunge began. This time the decline lasted 5 weeks and wiped 11% off the
SPX. On the following daily chart it is labeled "Warning shot 2".
The July-August decline was taken more seriously by almost everyone,
including the Fed's senior management. It was taken seriously enough, in
fact, to prompt a reversal in the Fed's monetary policy. The Fed entered
rate-cutting mode.
During the weeks following the August-2007 low
there was still widespread optimism. The overall economy was supposedly
still strong, the Fed was being supportive and, as everyone knows, you
should never fight the Fed.
The SPX went on to make a marginal new
high in October-2007 and then commenced a bear market that over the
ensuing 17 months would result in a loss of almost 60%.
The SPX was more stretched to the upside last month than it was in
late-February of 2007 and the plunge was twice as big, but we could be
dealing with Warning Shot 1. Also, this time around there may not be a
second warning shot.
Current Market Situation
The SPX closed higher every day last week. It has now reached its
50-day MA and recouped slightly more than half of the loss from its
January peak.
If the rebound of the past six trading days is
destined to be followed by another fast decline that tests or breaches the
9th February intra-day low of 2532 then the area near the 50-day MA is the
most likely place for the rebound to end. In other words, if our favoured
scenario is roughly correct then the rebound probably topped on Friday
16th February. Consequently, this is a good time to hedge or establish a
short-term bearish speculation or add to existing positions that are
designed to profit from or hedge against substantial stock market
weakness.
Note that due to the speed of the rebound to the 50-ay MA, even if we
are right to anticipate a second downward leg the SPX could spend 1-2
weeks chopping around in the 2650-2750 range before starting its next
serious decline.
This week's
significant US economic events
[Notes:
1) The most important events
(to the markets) are shown
in bold. 2) A list of global economic events can be found
HERE]
| Date | Description |
| Monday Feb-19 | US markets closed for public holiday |
| Tuesday Feb-20 | No important events scheduled |
| Wednesday Feb-21 |
Existing Home Sales FOMC Minutes |
| Thursday Feb-22 | Leading Economic Indicators |
| Friday Feb-23 | No important events scheduled |
Gold and the Dollar