|
-- Weekly Market Update for the Week Commencing 19th March 2012
Big Picture
View
Here is a summary of our big picture
view of the markets. Note that our short-term views may differ from our
big picture view.
In nominal dollar terms, the BULL market in US Treasury Bonds
that began in the early 1980s will end by 2013. In real (gold)
terms, bonds commenced a secular BEAR market in 2001 that will continue
until 2014-2020. (Last
update: 23 January 2012)
The stock market, as represented by the S&P500 Index, commenced
a secular BEAR market during the first quarter of 2000, where "secular
bear market" is defined as a long-term downward trend in valuations
(P/E ratios, etc.) and gold-denominated prices. This secular trend will bottom sometime between 2014 and 2020. (Last update: 22 October 2007)
A secular BEAR market in the Dollar
began during the final quarter of 2000 and ended in July of 2008. This
secular bear market will be followed by a multi-year period of range
trading. (Last
update: 09 February 2009)
Gold commenced a
secular bull market relative to all fiat currencies, the CRB Index,
bonds and most stock market indices during 1999-2001. This secular trend will peak sometime between 2014 and 2020. (Last update: 22 October 2007)
Commodities,
as represented by the Continuous Commodity Index (CCI), commenced a
secular BULL market in 2001 in nominal dollar terms. The first major
upward leg in this bull market ended during the first half of 2008, but
a long-term peak won't occur until 2014-2020. In real (gold) terms,
commodities commenced a secular BEAR market in 2001 that will continue
until 2014-2020. (Last
update: 09 February 2009)
Copyright
Reminder
The commentaries that appear at TSI
may not be distributed, in full or in part, without our written permission.
In particular, please note that the posting of extracts from TSI commentaries
at other web sites or providing links to TSI commentaries at other web
sites (for example, at discussion boards) without our written permission
is prohibited.
We reserve the right to immediately
terminate the subscription of any TSI subscriber who distributes the TSI
commentaries without our written permission.
Outlook Summary
Market
|
Short-Term
(0-3 month)
|
Intermediate-Term
(3-12 month)
|
Long-Term
(1-5 Year)
|
| Gold
|
Neutral
(22-Feb-12)
|
Neutral
(24-Jan-11)
|
Bullish
|
| US$ (Dollar Index)
|
Neutral
(22-Nov-11)
| Neutral
(09-Jan-12)
|
Neutral
(19-Sep-07)
|
| Bonds (US T-Bond)
|
Bearish
(05-Mar-12)
|
Neutral
(18-Jan-12)
|
Bearish
|
| Stock Market (S&P500)
|
Bearish
(23-Jan-12)
|
Bearish
(28-Nov-11)
|
Bearish
|
| Gold Stocks
(HUI)
|
Neutral
(29-Feb-12)
|
Bullish
(23-Jun-10)
|
Bullish
|
| Oil | Neutral
(31-Jan-11) | Neutral
(31-Jan-11)
| Bullish
|
| Industrial Metals
(GYX)
| Neutral
(22-Nov-11)
| Neutral
(29-Aug-11)
| Neutral
(11-Jan-10)
|
Notes:
1. In those cases where we have been able to identify the commentary in
which the most recent outlook change occurred we've put the date of the
commentary below the current outlook.
2. "Neutral", in the above table, means that we either don't have a
firm opinion or that we think risk and reward are roughly in balance with respect to the timeframe in question.
3. Long-term views are determined almost completely by fundamentals,
intermediate-term views by giving an approximately equal weighting to
fundamental and technical factors, and short-term views almost
completely by technicals.
The Treasury Market and
the "Expected CPI" - Update
We most recently dealt with this subject only 5 weeks ago (in the 8th February Interim Update), but last week's bond market action dictates that we deal with it again.
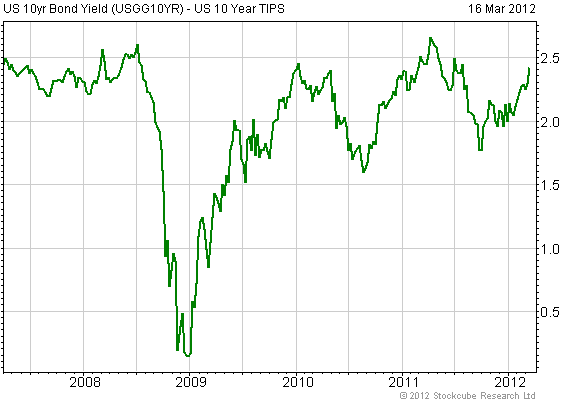
In our 8th February commentary we pointed out the intuitively obvious fact that the prices of long-dated Treasury securities usually trend in the opposite direction to the difference in yield between the 10-year T-Note and the 10-year TIPS (the "Expected CPI", a measure of the market's inflation expectations). Consequently, it is normal for peaks in the "Expected CPI" to roughly coincide with bottoms in the T-Bond price and for bottoms in the "Expected CPI" to roughly coincide with peaks in the T-Bond price. We went on to say:
"Over the past few years there hasn't been any regularity to bottoms in the "Expected CPI", but it has generally made sense to buy (or cover short positions in) T-Bonds when the "Expected CPI" has moved above 2.4%."
And:
"The "Expected CPI" is currently at around 2.2%, which, unless we've forgotten how to do basic arithmetic, means that it is probably only 0.2-0.3 from the next important peak. However, this leaves plenty of scope for bond market weakness, because it can take a big increase in inflation expectations to lift the "Expected CPI" from 2.2% to 2.4-2.5%. The "Expected CPI" is, after all, the amount of dollar depreciation the market thinks the US government will admit to in the future, not the amount of dollar depreciation the market thinks will actually occur in the future.
For the "Expected CPI" to rise to 2.4% within the next two months it will probably be necessary for the US stock market to do no worse than 'chop around' near its high (meaning: experience nothing worse than a pullback of around 5%). If this happens we will potentially get a steep decline in the Treasury market, setting the stage for the third in a sequence of April lows (T-Bonds and T-Notes made intermediate-term lows in April of 2010 and April of 2011)."
Since that time the US stock market has done no worse than chop around near its high (actually, it has gained a few percent), which has a) enabled the "Expected CPI" to rise to 2.4%, b) set in motion a steep decline in the Treasury market, and c) potentially set the stage for the third in a sequence of April T-Bond lows.
As illustrated by the following Fullermoney.com chart, the "Expected CPI" has reached the bottom of the range in which it is likely to peak (assuming that past is prologue). Notice, though, that in mid 2008 and early 2011 the "Expected CPI" peaked at around 2.6%. This means that there is scope for significant additional bond market weakness, although it would clearly be riskier to initiate a bearish bond market speculation now than it was just 1-2 weeks ago.
The Stock
Market
Cash on the Sidelines
All money is held by someone, so every dollar that gets added to the money supply also gets added to the so-called "cash on the sidelines". Consequently, the perennial bullish argument that the stock market is bound to rise because the amount of "cash on the sidelines" is at an all-time high should always be ignored.
The fact is that the amount of cash on the sidelines reaches an all-time every year. Actually, it reaches a new all-time high almost every week. It is at a new all-time high right now and it was at a new all-time high just prior to the stock market crash of 2008. It is solely a function of monetary inflation.
Current Market Situation
There has been almost no change in the senior stock indices since we posted last week's Interim Update. Our expectations therefore remain unchanged, meaning, for one, that we perceive better-than-average potential for a near-term downward reversal.
It is worth pointing out that although the senior stock indices have recently made new multi-year highs, the stocks of most large-cap industrial metal producers are a long way below last year's highs. To show what we are talking about we have displayed, herewith, charts of BHP (the world's largest mining company), Freeport McMoran (the world's largest publicly-traded copper producer), and Vale (the world's largest iron-ore producer and second-largest mining company). These stocks appear to be immersed in cyclical bear markets. VALE, for example, is not far from its lowest level of the past two years.
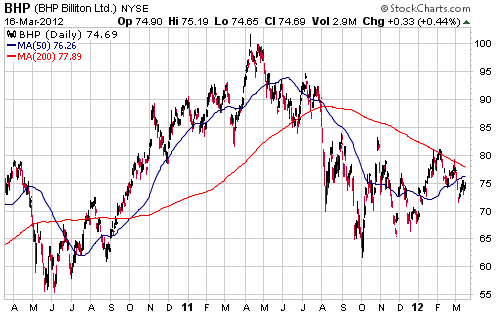
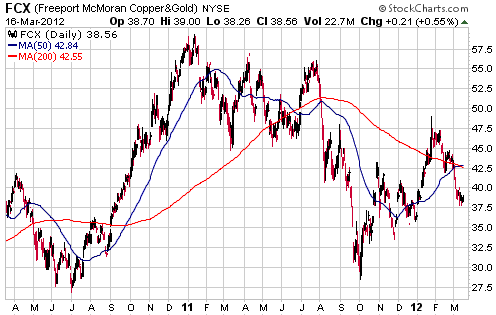
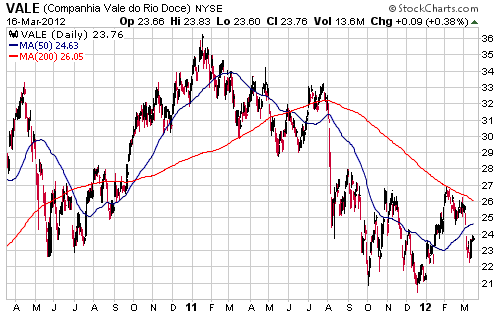
The performances of the major mining-company stocks could be signaling weakness ahead for the industrial metals.
This week's
important US economic events
| Date |
Description |
| Monday Mar 19 | Housing
Market Index
| | Tuesday Mar 20 | Housing
Starts
| | Wednesday Mar 21 | Existing
Home Sales | | Thursday
Mar 22 |
Leading Economic Indicators
|
| Friday Mar 23 | New
Home Sales
|
Gold and
the Dollar
Gold
At least one well-known commentator on the gold market asserted last week that the recent sharp decline in the T-Bond price (rise in long-term interest rates) SHOULD have been accompanied by an increase in the gold price. Therefore, he concluded, the fact that the T-Bond's decline was accompanied by a significant decrease in the gold price is evidence of gold market manipulation.
Let's consider the merits of this assertion in light of the following chart comparison of gold and the T-Bond. The chart shows that gold and the T-Bond have been positively correlated over the past 15 months and that last year's sharp rise in the gold price was accompanied by a sharp rise in the T-Bond. This chart suggests that if the recent parallel price declines of gold and the T-Bond is evidence that the gold price was manipulated downward, then last year's parallel price advances in these markets is evidence that the gold price was manipulated upward.
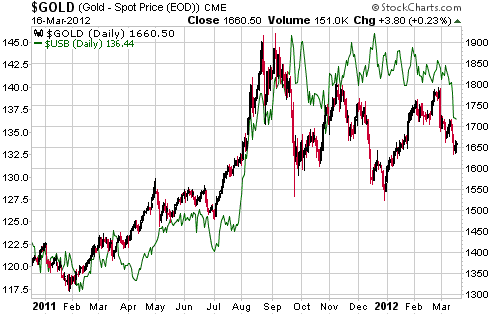
Rather than claim that every price decline is due to manipulation and every price rise is due to the true fundamentals shining through, it is better to try to understand what is really happening.
First, it is important to appreciate that what is really happening could have absolutely nothing to do with manipulation or changing fundamentals, given that it is common for the direction of a short-term price move to be counter to the fundamentals. Short-term price moves are often dominated by shifts in sentiment and technically-oriented trading.
Second, in the particular case of the gold-bond relationship a logical interpretation is that both gold and the T-Bond were bid up during February-September of last year (especially during the third quarter of last year) as part of a 'flight to safety' trade. As the demand for safe havens abated and confidence in the economic recovery theme grew, these markets naturally 'corrected'. We can argue that today's confidence in the recovery theme is totally misguided, but the fact remains that economic confidence is on the upswing.
Perhaps the most clear-cut evidence that economic confidence is now on the upswing is the performance of the BKX/SPX ratio (bank stocks relative to the broad stock market). As illustrated by the following chart, the BKX/SPX ratio began to bottom in September and began to trend upward in November. It reached a 7-month high last Friday.
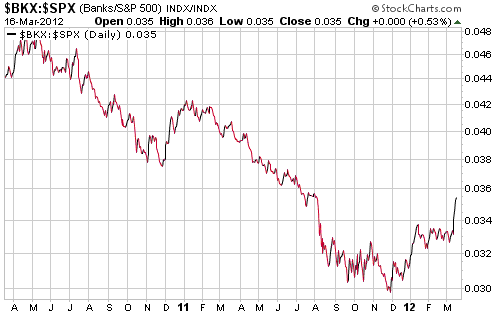
The above chart tells us that economic confidence has been rising, but doesn't tell us anything about the future. It is possible that confidence has just peaked. A second possibility is that confidence will peak within the next month or so. A third possibility is that the upward trend will persist for at least a few more months. Our view is that the second of these possibilities has the highest probability. Our view, then, is that the gold and T-Bond markets are within a few weeks of important price lows.
Silver
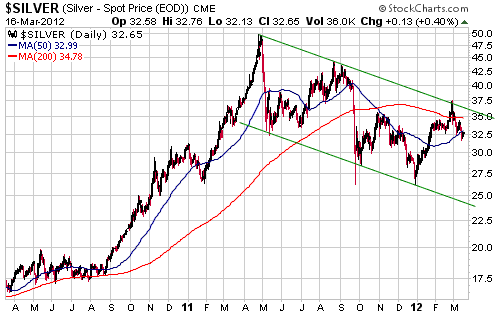
The following chart shows that silver hit its channel top late last month. This was as far as it was likely to rise prior to the start of a significant correction.
The minimum objective for a routine correction would be the 50-day moving average (around $32). This objective was achieved last week, but silver appears to be following gold and is therefore unlikely to bottom until after gold bottoms.
It is possible that gold has already bottomed, but it is more likely that there will be some additional weakness prior to a correction low. If so, silver could drop back to the high-$20s.
Gold Stocks
Current Market Situation
With the HUI having dropped back to its lows of the past 18 months, people are now looking at charts and imagining declines to much lower levels. For example, some people are now worried that the HUI could be on its way to the 300s. This concern about downside risk would have been useful when the HUI was trading at 600 last September, but it is counter-productive today.
The following daily chart of the HUI shows a 15% envelope around the 50-day moving average (MA). Our chart only covers the past 3 years, but if it covered a much longer period it would show that the only time over the past 10 years when the HUI traded well below the bottom of this MA envelope was during the 2008 collapse. The current financial backdrop is totally different to 2008, so there is almost no chance of the HUI plunging a great distance from here.
As far as the coming month is concerned, the realistic worst case is a short-lived downward spike to the 440s. This is not a high-probability outcome, but it is a plausible outcome that could result from some additional weakness in the bullion market combined with a sharp correction in the broad stock market.
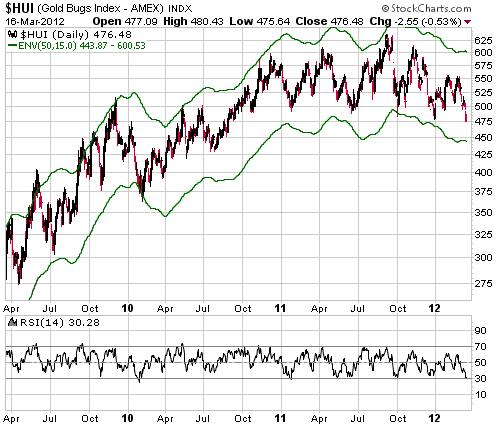
The HUI is probably going to make a short-term bottom within the next three weeks, but speculators who focus on gold and silver stocks should be financially and emotionally prepared for frustrating back-and-forth price action to continue until at least the final quarter of this year.
Market Value of Production and Resources, Part 1
The following table shows the per-ounce values currently being assigned by the stock market to the in-ground resources and production of the TSI gold/silver producers and a few other gold/silver producers (the stocks that are not current members of the TSI List have asterisks next to their names). A similar table (minus the per-ounce production values) covering companies that aren't yet in production will be included in this week's Interim Update.
When deciding which gold/silver stocks to buy, the information in tables such as the one presented below is just a starting point. No gold stock should ever be bought or sold simply because the value being assigned to its ounces is relatively low or relatively high, because there are always other important considerations. Examples of these other considerations are:
a) Growth potential
b) Production cost or expected production cost
c) Deposit size and expected mine life
d) Deposit location
e) For exploration-stage companies, the estimated cost of building a mine and the estimated time to get into production
f) Management
g) Balance sheet
| Company
Name |
Symbol |
Recent
Price (US$) |
Total
Shares (M) |
Mkt
Cap ($M) |
Ent.
Value ($M) |
2012
Prod. (Koz) |
M&I
Res. (Moz) |
Inf'd
Res. (Moz) |
Total
Res. (Moz) |
EV
$ per oz prod. |
EV
$ per oz res. |
| Agnico
Eagle* |
AEM |
33.79 |
171 |
5778 |
6075 |
910 |
28.4 |
9.7 |
33.3 |
6676 |
183 |
| Crocodile
Gold* |
CRK.TO |
0.51 |
390 |
199 |
129 |
70 |
3.2 |
2.1 |
4.3 |
1841 |
30 |
| Dragon
Mining |
DRA.AX |
1.03 |
89 |
92 |
63 |
62 |
0.6 |
0.5 |
0.9 |
1010 |
74 |
| Endeavour
Mining |
EDV.TO |
2.38 |
254 |
605 |
601 |
185 |
3.5 |
1.2 |
4.1 |
3246 |
146 |
| Evolution
Mining |
EVN.AX |
1.97 |
707 |
1390 |
1260 |
350 |
5.6 |
1.4 |
6.3 |
3599 |
200 |
| First
Majestic Silver* |
FR.TO |
16.82 |
106 |
1783 |
1674 |
180 |
3.4 |
3.3 |
5.1 |
9300 |
331 |
| Fortuna
Silver* |
FVI.TO |
5.98 |
125 |
748 |
678 |
92 |
1.4 |
0.9 |
1.9 |
7364 |
366 |
| Gold-Ore
Resources |
GOZ.TO |
0.84 |
170 |
143 |
108 |
45 |
1.2 |
1.7 |
2.1 |
2396 |
53 |
| Golden
Star Resources |
GSS |
1.73 |
262 |
453 |
497 |
350 |
7.1 |
2.2 |
8.2 |
1421 |
61 |
| Jaguar
Mining |
JAG |
5.95 |
84 |
500 |
650 |
200 |
6.3 |
1.8 |
7.2 |
3249 |
90 |
| Kinross
Gold* |
KGC |
9.97 |
1,100 |
10967 |
10278 |
2500 |
88.0 |
20.0 |
98.0 |
4111 |
105 |
| Lake
Shore Gold* |
LSG.TO |
1.22 |
420 |
512 |
447 |
90 |
3.0 |
3.9 |
5.0 |
4971 |
90 |
| Norton
Gold Fields* |
NGF.AX |
0.19 |
862 |
161 |
161 |
150 |
3.3 |
2.6 |
4.6 |
1076 |
35 |
| Oceana
Gold* |
OGC.AX |
2.41 |
265 |
639 |
689 |
260 |
6.7 |
3.6 |
8.5 |
2652 |
81 |
| Orvana
Minerals |
ORV.TO |
0.86 |
137 |
118 |
198 |
80 |
1.5 |
1.5 |
2.3 |
2473 |
88 |
| Resolute
Mining |
RSG.AX |
2.12 |
660 |
1400 |
1330 |
410 |
7.3 |
2.1 |
8.4 |
3245 |
159 |
Table Notes:
1. Enterprise Value (EV) = market capitalisation plus total debt (including hedge-related liabilities) minus cash
2. Silver production and resources have been converted to gold-equivalent values at a ratio of 50:1
3. Total Resource = M&I Resource plus half of Inferred Resource
Here is a brief comment on each of the stocks included in the above table:
1) Agnico Eagle (AEM)
AEM is not a TSI stock selection, but a long-dated AEM call option is in the TSI List.
As a result of the large decline in its stock price over the past 12 months, AEM has gone from being very expensive to being fairly valued. Assuming a gold price of $1600/oz, we estimate that AEM is presently trading at 10-12 times its 2012 cash flow. This is a low cash-flow multiple for this particular stock, but isn't low compared to other large and mid-tier gold producers. One or two quarters of good financial results would likely see it regain its premium rating.
2) Crocodile Gold (TSX: CRK)
CRK is a former TSI stock that ran into operational problems (lower production and higher costs) and then destroyed a lot of value by dramatically expanding its share count. The stock looks cheap at its current price, but there are other companies with less issues/risks that are just as cheap or cheaper.
3) Dragon Mining (ASX: DRA)
DRA is listed in Australia, but operates gold mines in Sweden and Finland. It is very under-valued.
4) Endeavour Mining (TSX: EDV, ASX: EVR)
Fast-growing West-Africa-based gold miner with producing mines in Burkina Faso and Ghana and development-stage projects in Cote d'Ivoire and Mali. It is under-valued considering only its current production, meaning that the market is currently allowing nothing for the company's planned growth.
5) Evolution Mining (ASX: EVN)
Australian gold miner that is slightly under-valued based on this year's forecast production and is significantly under-valued taking into account the production growth scheduled to occur in 2013 (due to bringing the Mt Carlton project into production). EVN has the ingredients to become a 'market darling', but to do so it will have to achieve its production and cost plans. Our valuation-based intermediate-term price target is A$2.50/share.
6) First Majestic Silver (TSX: FR, NYSE: AG)
A former TSI stock selection that we exited way too early. The company is almost a pure silver producer and offers a lot of leverage to changes in the silver price, which allowed to do exceptionally well during the 2010-2011 silver moon-shot. The stock price has come back a long way from last year's peak, but the valuation is still high.
FR will be a good stock to own during the next major silver advance (2013-2014?).
7) Fortuna Silver (TSX: FVI, NYSE: FSM)
FVI is another former TSI stock selection. It produces a combination of silver, gold and base metals from operations in Mexico and Peru, but it markets itself as a silver producer. This makes sense given that silver stocks generally trade at much higher valuations than gold stocks.
FVI is currently not as expensive as FR, but its valuation is still too high for our liking.
8) Gold-Ore Resources (TSX: GOZ)
The figures in the table assume that GOZ's merger with Elgin Resources will be completed. The merger with Elgin makes GOZ's valuation look higher than it is because Elgin's main contribution to the partnership is growth potential. This potential is not reflected in the current per-ounce valuation figures.
GOZ is very under-valued.
9) Golden Star Resources (GSS)
Considering the size of its gold mining business, GSS is dirt cheap. The reason it is dirt cheap is that its production costs are very high and its management has almost no credibility.
If GSS meets or exceeds its own production and cost targets over the next few quarters there will probably be a large rise in its stock price, but that's a big if.
10) Jaguar Mining (JAG)
JAG's stock price rocketed upward last November in response to reports of a proposed US$9.30/share bid for the company, but subsequent developments have made it clear that there was never a genuine takeover bid on the table.
JAG is similar to GSS in the respect that its management has lost credibility due to repeatedly missing its own forecasts. One difference between the two companies is that JAG's production costs are a lot lower than GSS's. This mostly accounts for the higher valuation assigned by the market to JAG's production and in-ground resources. JAG probably also attracts a higher valuation due to having more in-house growth potential courtesy of its exploration-stage Gurupi project.
11) Kinross Gold (KGC)
KGC is not a TSI stock selection, but there is a KGC warrant and long-dated call option in the TSI List.
Assuming a gold price of $1600/oz, we estimate that KGC is presently trading at 6.5-7.5 times its 2012 cash flow. This is very low for a senior gold producer and provides scope for a 50%-70% increase in the stock price just to bring the valuation up to a more normal level.
12) Lake Shore Gold (TSX: LSG)
LSG recently came onto our radar screen due to an investment in the company by Franco Nevada (FNV). Specifically, last month FNV agreed to purchase 10M LSG shares at C$1.50/share and to pay $35M for a 2.25% royalty covering LSG's West Timmins project.
The stock traded above C$4/share early last year, at which time it would have been extremely expensive. However, at Friday's closing price of C$1.22 the valuation looks reasonable considering the existing production, the strong potential for a 50% increase in production next year, and the relatively low-risk location (Ontario).
LSG is a possible future TSI stock selection.
13) Norton Gold Fields (ASX: NGF)
Although not an 'official' TSI stock selection, NGF is part of the TSI Small Stocks Watch List.
Based on the value being assigned to its production and resources, NGF is the cheapest gold mining stock we know of with current annual production of at least 150K ounces. This gives it scope for a large stock market re-rating, but to get this re-rating it will need to either generate a lot of free cash or prove that it will be able to at least sustain its current production rate for many years.
14) Oceana Gold (ASX and TSX: OGC)
OGC currently produces gold from mines located in New Zealand, but its planned production growth stems from the development-stage Didipio project in the Philippines. Its valuation is relatively low, but this is probably due to country risk (Philippines) and uncertainty over the lives of its New Zealand mines.
15) Orvana Minerals (TSX: ORV)
ORV has operating gold/copper mines in Spain and Bolivia as well as an exploration-stage copper project in the US. Its valuation is low, but delays and cost overruns in ramping up its new mines have resulted in a substantial weakening of its balance sheet. Moreover, the balance-sheet weakening was accompanied by some gold-price 'hedging' that probably won't hurt the company this year but creates a substantial long-term risk.
16) Resolute Mining (ASX: RSG)
After years of sub-par performance, RSG has been a relatively strong stock over the past 12 months due to the successful ramp-up of its Syama gold mine in Mali. The current valuation still leaves plenty of room for stock price appreciation.
Currency Market Update
The Australian Dollar
The A$'s performance since May of last year could be a large topping pattern. That's one way to interpret the following
daily chart. Another interpretation is that an intermediate-term correction ended last October and that a (likely final) multi-month rally to a new high is now in progress.
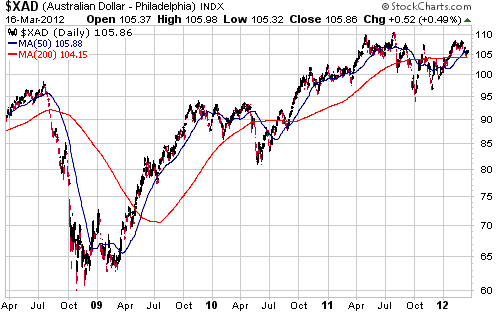
The A$ will potentially hit the financial equivalent of a perfect storm during the second half of this year due to the combination of:
1. Rapid easing of monetary policy by the Reserve Bank of Australia in reaction to accelerating weakness in the property market and rising unemployment
2. Pronounced weakness in China's economy
3. Global downturns in stock and commodity markets
The combined effect would likely be a large decline in a currency that is presently very over-valued on a purchasing-power-parity basis.
We always have a sizeable long position in the A$ and generally attempt to hedge this long exposure via FXA put options when the intermediate-term downside risk becomes unbearably high. We haven't yet purchased such a hedge, but will probably do so within the next three months.
The Yen
The Yen has just fallen for six weeks in a row and according to the weekly RSI is now at its most 'oversold' since 2005. The extent to which the Yen is now 'oversold' creates the potential for a significant rebound, but the recent definitive break below the 70-week moving average (the blue line of the following weekly chart) suggests that the Yen is going to be flat-to-down over the next two years. In other words, any rebound over the months ahead will likely be the counter-trend variety.
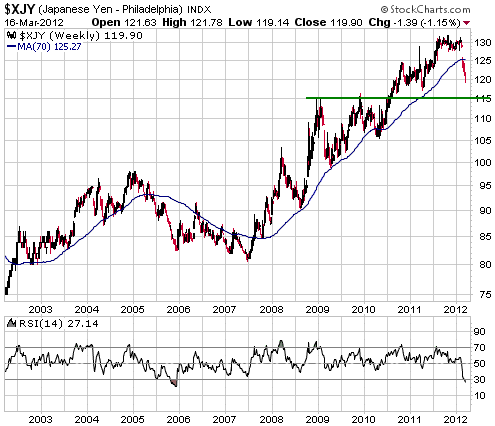
We doubt that this will happen, but if the Yen plunges to around 115 over the next few weeks it could be worth buying it in anticipation of a rebound to the 70-week moving average.
Update
on Stock Selections
Notes: 1) To review the complete list of current TSI stock selections, logon at
http://www.speculative-investor.com/new/market_logon.asp
and then click on "Stock Selections" in the menu. When at the Stock
Selections page, click on a stock's symbol to bring-up an archive of
our comments on the stock in question. 2) The Small Stock Watch List is
located at http://www.speculative-investor.com/new/smallstockwatch.html
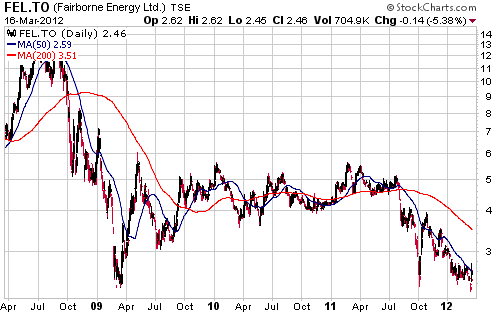
 Fairborne Energy (TSX: FEL). Shares: 102M issued, 109M fully diluted. Recent price: C$2.46 Fairborne Energy (TSX: FEL). Shares: 102M issued, 109M fully diluted. Recent price: C$2.46
The amount of natural gas in underground storage in the US is about 50% higher than its 5-year average for this time of the year. This means that there is a natural gas glut in the US. This glut has led to a very low price for the commodity and a very low stock price for Fairborne Energy, a mid-tier producer that offers considerable leverage to the NG price. Leverage is good to have in bull markets and bad to have in bear markets.
Due to the low valuation currently being assigned to its assets, FEL announced last week that it had
"initiated a process to identify, examine and consider strategic alternatives with the view to enhancing shareholder value. Strategic alternatives may include, but are not limited to: sale of the corporation, merger or other business combination, recapitalization, sale of all or a portion of the company's assets (or any combination thereof), or continued execution as its business plan, among all other alternatives." In other words, FEL has effectively put itself up for sale.
This is a reasonable move. FEL's assets are being valued lowly due to the low NG price in North America, but in other parts of the world the NG price is much higher and NG-producing assets are valued much more highly. The potential therefore exists for FEL to be purchased at a hefty premium by a foreign company (as per the Daylight Energy example from last year).
As FEL pointed out in last week's press release, there is no guarantee that the "strategic review" will lead to a deal.
 Gold-Ore Resources (TSX: GOZ). Shares: 85M issued, 91M fully diluted. Recent price: C$0.84 Gold-Ore Resources (TSX: GOZ). Shares: 85M issued, 91M fully diluted. Recent price: C$0.84
In the 6th February Weekly Update we wrote that GOZ would be a strong buy if it pulled back to the low-C$0.80s. It reached "strong buy" territory late last week.
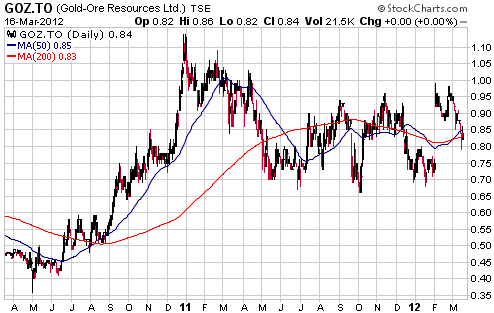
Chart Sources
Charts appearing in today's commentary
are courtesy of:
http://stockcharts.com/index.html
http://www.fullermoney.com/

|

