![]()
![]()
![]()
![]()
-- Weekly Market Update for the Week Commencing 19th March 2018
Big Picture
View
Here is a summary of our big picture
view of the markets. Note that our short-term views may differ from our
big picture view.
The BULL market in US Treasury Bonds that began in the early 1980s ended in mid-2016, but there will be many years of topping action in bond prices and bottoming action in bond yields before major new trends get underway. A major decline in government bond prices will unfold during the 2020s. (Last update: 11 September 2017)
The stock market, as represented by the S&P500 Index, commenced a secular BEAR market during the first quarter of 2000, where "secular bear market" is defined as a long-term downward trend in valuations (P/E ratios, etc.), gold-denominated prices and inflation-adjusted prices. This secular trend will bottom in 2020 or later. (Last update: 11 September 2017)
A cyclical BEAR market in the US Dollar began in 2016-2017. (Last update: 11 September 2017)
Gold commenced a secular bull market relative to all fiat currencies, the CRB Index, bonds and most stock market indices during 1999-2001. This secular trend will peak in 2020 or later. (Last update: 11 September 2017)
Commodities,
as represented by the CRB Index, commenced a
secular BULL market in 2001 in nominal dollar terms. The first major
upward leg in this bull market ended during the first half of 2008, but
a long-term peak won't occur until 2020 or later.
(Last
update: 11 September 2017)
Copyright
Reminder
The commentaries that appear at TSI
may not be distributed, in full or in part, without our written permission.
In particular, please note that the posting of extracts from TSI commentaries
at other web sites or providing links to TSI commentaries at other web
sites (for example, at discussion boards) without our written permission
is prohibited.
We reserve the right to immediately
terminate the subscription of any TSI subscriber who distributes the TSI
commentaries without our written permission.
True
Fundamentals Summary
[Notes:
1) The date shown next to the current True Fundamentals Model (TFM) signal is
when the most recent change occurred. 2) Charts of the Gold and Equity
TFMs are included in the "Charts and Indicators" section of the TSI web
site]
| Market | True Fundamentals Model (TFM) |
| Gold (US$ Price) | Bearish (12 Jan 2018) |
| US Equity (SPX) | Neutral (12 Jan 2018) |
| Currency (Dollar Index) | Bullish (15 Dec 2017) |
| Commodities (GNX) | Bullish (29 Dec 2017) |
Last week's posts at the TSI Blog
There were no blog posts last week.
Summary of current
thinking/positioning
1) A number of markets are set
up for trend reversals or accelerations, with the US$ being the linchpin.
If the DX breaks out to the downside from its recent narrow range then
rallies should begin or accelerate across the commodity world, with silver
bullion and gold-mining stocks leading the way higher. However, if the DX
breaks out to the upside from its recent range then the commodity world
will have a downward bias for the ensuing two months.
2) More
evidence has emerged that the US stock market's decline from its January
peak was nothing more than a short-term correction, although there is
still a chance that some stock indices will revisit their early-February
lows.
3) Downward corrections in oil and copper will end by May,
with the timing dependent upon what happens in the currency market. We've
had March in mind for a correction low, but the turning point will be
delayed if the DX breaks out to the upside.
4) Bond yields are in
long-term upward trends and will go much higher before year-end, but a
counter-trend move is underway. The counter-trend move could end at any
time, although we won't be interested in placing a new bet against the
bond market (a new bet on higher interest rates) until there is a
substantial reduction in the speculative net-short position in 10-year
T-Note futures.
5) Holding a cash reserve of 25%-30%.
Interest Rates
The Fed is set to hike
two more times before mid-year
Unless nuclear war breaks
out in the next two days, the Fed will announce another 0.25% increase in
its targeted interest rates on Wednesday 21st March. This will bring the
target range to 1.50%-1.75%. Also, there's a high probability of another
0.25% hike at the June FOMC meeting (13th June).
Two 0.25% Fed rate
hikes before mid-year will not have a big effect on the financial markets
because the scenario has been almost fully discounted. As evidence we cite
the following chart of the 3-month T-Bill yield (UST3M).
The
pattern over the past two years has been for UST3M to move slightly above
the bottom of the expected new target range a few weeks prior a Fed rate
hike. For example, last November the Fed Funds Rate (FFR) target range was
1.00%-1.25% and there was a general expectation that the target would be
boosted to 1.25%-1.50% in December. To reflect this expectation, UST3M
rose to 1.30% in the second half of November.
A repeat of the
pattern would now see UST3M at about 1.55% (near the bottom of the range
that will come into being on 21st March), but the market is already
pricing the 3-month bill to yield 1.78%. This means that it is pricing in
a near certainty of an increase to 1.75%-2.00% within three months.
A lot will have to go wrong in the stock market and/or the economy
over the next 2-3 months to prevent the Fed from implementing its second
2018 rate hike in June. It's therefore a good bet that the first half of
2018 will contain two rate hikes. However, that might be 'all she wrote',
because it's quite possible that stock market and/or economic weakness
will become serious enough by July-August to put the Fed on hold.
The T-Bond rebound gathers some steam
The 30-year
T-Bond broke out to the downside from a major top formation in
late-January. This breakout provided powerful confirmation of our bearish
outlook for long-term bond prices and bullish outlook for nominal interest
rates.
The T-Bond's breakout suggests that there is scope for
considerable additional downside in the price over the coming two
quarters, but by the third week of February the Treasury market had become
sufficiently 'oversold' to enable a counter-trend rebound to get underway.
The base of the major top formation (146.5-147.0) is an obvious target for
this rebound.
The following chart compares the T-Bond price with
the S&P500 Index (SPX). It isn't a random coincidence that the downside
breakout by the T-Bond was almost immediately followed by a sharp decline
in the stock market (as represented here by the SPX). As we've said
numerous times in the past, the stock market can ignore a rising
interest-rate trend for a long time, but if the trend persists then it
eventually becomes almost the only thing that matters.
It seems that the stock market has become accustomed to a 10-year
yield in the 2.80%-3.00% range. This means that the breakouts to new
multi-year highs in the 10-year yield (see chart below) and new multi-year
lows in the T-Bond price (as discussed above) provoked only a short-term
stock market correction, albeit a sizable one. They didn't bring about a
major stock market decline. For that, the 10-year yield probably will have
to break solidly above 3%.
A new TBT trade opportunity may soon emerge
The ProShares UltraShort 20+ Year Treasury Fund (TBT) trends in the
opposite direction to the T-Bond. We exited a TBT long position at a
profit about a month ago with the aim of re-establishing a position
following a rebound in the T-Bond price. The T-Bond rebound is well
underway and, as a result, soon there may be a good opportunity to buy
TBT.
We hope to be able to re-enter TBT at around $36 in
preparation for another multi-month decline in the bond market, but we'll
take our cues from the COT data and the price action in the Treasury
market. With regard to the former, we'd like for there to be a substantial
shrinkage in the speculative net-short position in 10-year T-Note futures
before we place a new bet against the bond market.
The Stock Market
Current Market Situation
The NASDAQ100 Index (NDX) managed to close lower on each of the past
four days without negating the previous week's upside breakout. Therefore,
the probability that we are dealing with a genuine breakout has increased,
although we still can't rule out the possibility that some stock indices
will test their early-February spike lows before the overall correction
ends.
The Dow Transportation Average (TRAN) is one stock index that is very
much at risk of testing its early-February spike low. This risk will be
greatly reduced by a daily close above 10,800.
We assess the stock market's true fundamentals to be neutral at this
time.
After being at an optimistic extreme during January and being
momentarily fearful when the short-volatility trade was blowing up in
early-February, sentiment also appears to be neutral at this time. On the
minus side there is very little negativity or fear evident in the
sentiment indicators, but on the plus side the speculative 'froth' that
was blatantly obvious two months ago has been removed.
The bottom
line is that the stock market is not yet totally 'out of the woods', but
there's a high probability that the Q1 decline was nothing more than a
short-term correction.
Tesla (TSLA), the world's greatest
story stock
TSLA is a classic story stock, in that it has
a market valuation that could only be justified by creating a story
involving wildly ambitious assumptions about the future. In TSLA's case,
however, the wildly ambitious assumptions seem totally implausible rather
than just unlikely.
Why investors are buying/holding this stock
near its current valuation is therefore something of a mystery to us. In
particular, we can't understand how anyone with any business sense could
expect a car manufacturer that did nothing except hemorrhage cash during a
period when it was benefiting from government assistance and first-mover
advantage to consistently generate large profits after the government
assistance is mostly taken away and the company finds itself in direct
competition with the likes of Mercedes, Porsche, BMW, Audi and Jaguar.
That being said, timing is everything. It seems inevitable that the
price of a Tesla share will drop to a small fraction of its current level,
but we aren't confident that it will happen this year. Also, Tesla CEO
Elon Musk is one of the all-time great promoters -- a modern day PT
Barnum. He seems to be able to whip-up enthusiasm for the stock at will.
With regard to timing, over the past 9 months the TSLA price has
traced out a pattern that has the look of a major top, and within the
larger pattern it has, over the past 3 months, traced out what looks like
a double top. This could mean that we are not far away from the point
where selling pressure finally begins to overwhelm the buying of Musk's
blind followers.
Critical support and resistance lie at $310 and
$360, respectively. A solid close below $310 would warn that a substantial
decline was about to begin whereas a close above $360 would warn that
everything since the June-2017 peak was an intermediate-term consolidation
within an on-going bull market.
The TSI List currently has a bearish TSLA speculation in the form of
the April-2018 $250 put option. There is now only about a month before
this option expires, so unless the downside breakout that we are
anticipating happens in the next week or so we will have to either exit at
a loss or
roll into a later-dated option. Most likely the former, unless we have
a good reason to believe that a large decline has begun.
This week's
significant US economic events
[Notes:
1) The most important events
(to the markets) are shown
in bold. 2) A list of global economic events can be found
HERE]
| Date | Description |
| Monday Mar-19 | No important events scheduled |
| Tuesday Mar-20 | No important events scheduled |
| Wednesday Mar-21 |
Q4-2017 Current Account Balance Existing Home Sales FOMC Policy Statement and Forecasts |
| Thursday Mar-22 | No important events scheduled |
| Friday Mar-23 |
Durable Goods Orders New Home Sales |
Gold and the Dollar
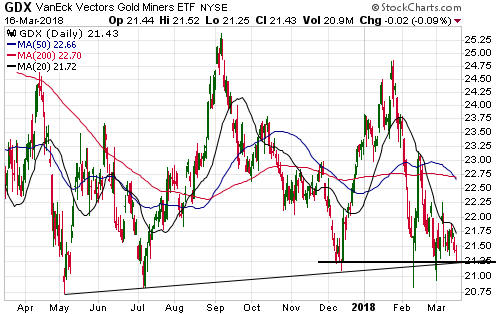
There is still a realistic chance that the gold sector (as represented
by the HUI) will make a multi-month low this month, but only if there is a
sharp decline over the coming 1-2 weeks. The most likely alternative would
be a continuing downward drift to an intermediate-term bottom in May.
The Currency Market
The Euro
The 2-month trading
range in the DX evident on the chart included in the Gold section above is
associated with and similar to the 2-month trading range in the euro
evident on the daily chart displayed below. The difference is that for the
DX it's a potential base and for the euro it's a potential top.
If
the euro breaks below the bottom of its range in the near future then up
to 2 months of additional downside may be in store. The targets would be
1.19 and 1.16 (we think that lateral support at 1.16 defines the euro's
maximum short-term downside risk).
That being said, there's no
guarantee that we are dealing with a topping pattern in the euro. It could
be a mid-trend consolidation, in which case there will soon be a break
above the top of the range followed by up to 2 months of additional
upside.
We put the odds at 60/40 in favour of a near-term downside
breakout in the euro.
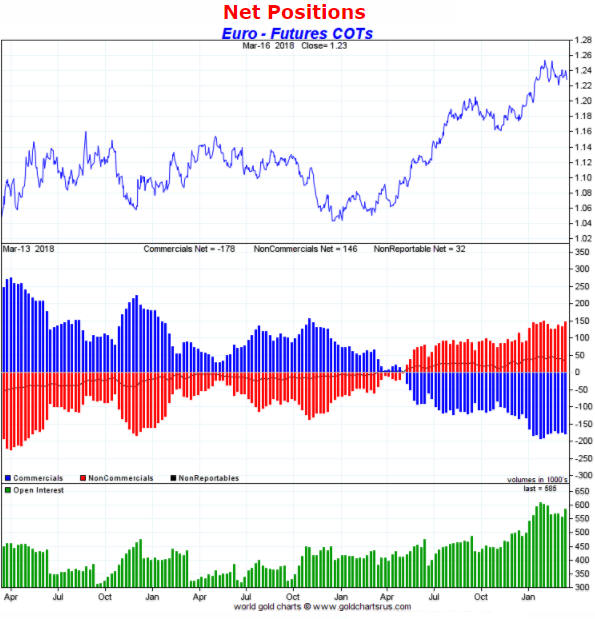
The main reason to favour a downside breakout is that speculative euro
sentiment remains stretched into optimistic territory at a time when
interest-rate and equity-performance differentials constitute a
substantial headwind. The stretched speculative sentiment is indicated by
the following chart of the euro's COT situation. This chart shows that the
range-trading of the past 2 months has done nothing to reduce the
enthusiasm of speculators in euro futures.
The A$
When we posted our 21st February
commentary the A$ was trading at 78, which we had previously cited as a
likely level for a correction low. However, we wrote that taking into
account the overall market situation there could be up to 2 additional
points of downside before the next tradable rally got underway. Our
preference was to wait for a better opportunity before buying.
We
speculated that a better opportunity to buy the A$ would arrive in March,
as this was a likely time for the Dollar Index to reach a short-term top
and for some high-profile commodity markets to reach short-term bottoms.
The A$ is now one point lower, having rebounded to around 79 before
dropping to 77. As illustrated by the following daily chart, the rebound
ended at the 50-day MA.
A decline to 76 appears to be on the cards,
but a lot will depend on whether the DX breaks out to the upside or the
downside from its 2-month range. Even though the A$ is not part of the DX,
if the DX breaks out to the upside and accelerates in that direction then
many high-profile commodities and all the major currencies will come under
pressure.
Updates
on Stock Selections
Notes: 1) To review the complete list of current TSI stock selections, logon at
http://www.speculative-investor.com/new/market_logon.asp
and then click on "Stock Selections" in the menu. When at the Stock
Selections page, click on a stock's symbol to bring-up an archive of
our comments on the stock in question. 2) The Small Stock Watch List is
located at http://www.speculative-investor.com/new/smallstockwatch.html
![]() Company
news/developments for the week ending Friday 16th March 2018:
Company
news/developments for the week ending Friday 16th March 2018:
[Note: AISC = All-In Sustaining Cost, FS = Feasibility Study, FY =
Financial Year, IRR = Internal Rate of Return, ISR = In-Situ Recovery,
MD&A = Management Discussion and Analysis, M&I = Measured and Indicated,
NAV = Net Asset Value, NPV(X%) = Net Present Value using a discount rate
of X%, NSR = Net Smelter Return, P&P = Proven and Probable, PEA =
Preliminary Economic Assessment, PFS = Pre-Feasibility Study]
*Alio Gold (ALO) reported the result of the first deep
hole from its 6-hole surface drilling program at the Ana Paula project in
Guerrero State, Mexico. The purpose of the hole was to get more
information about the high-grade breccia mineralisation below the proposed
open pit and to test a potential source of lower-grade mineralisation that
is much closer to the surface but outside the proposed pit. The hole was
successful on both counts, intersecting 6.45 g/t gold over 19.0m in the
deep, high-grade breccia and 1.3 g/t gold over 55.7m in the
close-to-the-surface lower-grade area.
Two more holes in the 6-hole
program are complete and awaiting assays.
*U.S. Gold
Corp. (USAU) has completed comprehensive geochemical sample
surveys covering the 20-square-mile Keystone district project area. The
sample database now comprises 4,225 soil samples, 2,250 rock samples, 649
fine-sediment stream samples, and 620 altered stream cobble samples. This
is all part of the process of zooming in on target areas for drilling.
*Solitario Zinc (XPL) published its financial
statements for the quarter and year ending 31st December 2017. The
statements revealed that the company had no long-term debt and US$14.5M of
working capital (down about US$0.5M over the final 3 months of the year).
XPL is well positioned with stakes in two attractive exploration-stage
zinc projects. It is also very under-valued at its current price of
US$0.50.
As mentioned in our 19th February report, we are concerned
that it will remain very under-valued for another 6-12 months due to a
lack of market-moving news.
![]() List
of candidates for new buying
List
of candidates for new buying
From within the ranks of TSI
stock selections the best candidates for new buying at this time, listed
in alphabetical order, are:
1) ALK.AX (last Friday's closing price:
A$0.31)
2) ALO (last Friday's closing price: US$2.42)
3)
AOI.TO (last Friday's closing price: C$1.27)
4) PG.TO (last
Friday's closing price: C$3.01)
The above list is limited to five
stocks. It will sometimes contain less than five, but it will never
contain more than five regardless of how many stocks are attractively
priced for new buying.
Chart Sources
Charts appearing in today's commentary
are courtesy of:
http://stockcharts.com/index.html
http://www.goldchartsrus.com/