|
-- Weekly Market Update for the Week Commencing
19th May 2014
Big Picture
View
Here is a summary of our big picture
view of the markets. Note that our short-term views may differ from our
big picture view.
In nominal dollar terms, the BULL market in US Treasury Bonds
that began in the early 1980s ended in 2012. In real (gold)
terms, bonds commenced a secular BEAR market in 2001 that will continue
until 2018-2020. (Last
update: 20 January 2014)
The stock market, as represented by the S&P500 Index,
commenced
a secular BEAR market during the first quarter of 2000, where "secular
bear market" is defined as a long-term downward trend in valuations
(P/E ratios, etc.) and gold-denominated prices. This secular trend will bottom sometime between 2014 and 2020.
(Last update: 22 October 2007)
A secular BEAR market in the Dollar
began during the final quarter of 2000 and ended in July of 2008. This
secular bear market will be followed by a multi-year period of range
trading.
(Last
update: 09 February 2009)
Gold commenced a
secular bull market relative to all fiat currencies, the CRB Index,
bonds and most stock market indices during 1999-2001.
This secular trend will peak sometime between 2014 and 2020.
(Last update: 22 October 2007)
Commodities,
as represented by the Continuous Commodity Index (CCI), commenced a
secular BULL market in 2001 in nominal dollar terms. The first major
upward leg in this bull market ended during the first half of 2008, but
a long-term peak won't occur until 2014-2020. In real (gold) terms,
commodities commenced a secular BEAR market in 2001 that will continue
until 2014-2020.
(Last
update: 09 February 2009)
Copyright
Reminder
The commentaries that appear at TSI
may not be distributed, in full or in part, without our written permission.
In particular, please note that the posting of extracts from TSI commentaries
at other web sites or providing links to TSI commentaries at other web
sites (for example, at discussion boards) without our written permission
is prohibited.
We reserve the right to immediately
terminate the subscription of any TSI subscriber who distributes the TSI
commentaries without our written permission.
Outlook Summary
Market
|
Short-Term
(1-3 month)
|
Intermediate-Term
(6-12 month)
|
Long-Term
(2-5 Year)
|
|
Gold
|
Bullish
(26-Mar-14) |
Bullish
(26-Mar-12) |
Bullish
|
|
US$ (Dollar Index)
|
Bearish
(16-Apr-14) |
Bearish
(27-Jan-14) |
Neutral
(19-Sep-07) |
|
Bonds (US T-Bond)
|
Bullish
(11-Dec-13)
|
Neutral
(18-Jan-12)
|
Bearish |
|
Stock Market
(DJW)
|
Bearish
(07-Apr-14) |
Bearish
(28-Nov-11) |
Bearish
|
|
Gold Stocks
(HUI)
|
Bullish
(03-Mar-14) |
Bullish
(23-Jun-10) |
Bullish
|
|
Oil |
Bearish
(12-Mar-14) |
Neutral
(31-Jan-11) |
Bullish
|
|
Industrial Metals
(GYX)
|
Neutral
(17-Feb-14) |
Bullish
(28-Apr-14) |
Bullish
(28-Apr-14) |
Notes:
1. The date shown below the current outlook is when the most recent outlook change occurred.
2. "Neutral", in the above table, means that we either don't have a
firm opinion or that we think risk and reward are roughly in balance with respect to the timeframe in question.
3. Long-term views are determined almost completely by fundamentals,
intermediate-term views by
fundamentals, sentiment and technicals, and short-term views by sentiment and
technicals.
The "mystery" buyer of
T-bonds
A recent
article at ZeroHedge notes that "Belgium" is now the third-largest foreign
holder of US Treasury paper, with $381B worth at the end of March. The article
correctly points out that neither the government nor the country of Belgium owns
this US government debt, but otherwise leaves open the question of ownership. We
will now tackle the question: Who bought the $381B of Treasury paper that now
shows up in official reports as being held by a Belgian entity?
The answer to this question is unknowable. The ZeroHedge article states that the
owner is not China (meaning: the government of China), but this is not
necessarily true. The reason is that the US Treasury will not always be able to
identify the ultimate foreign owner of a T-Bond and will therefore not always be
able to accurately report the value of bonds held by various governments. For
example, China's government could be buying bonds via an intermediary that uses
Euroclear, a Belgium-based
financial services company.
The Belgium-based Euroclear specialises in the settlement of securities
transactions and the holding of collateral that backs derivatives trades and
other types of financial-market trades. It apparently has more than 20 TRILLION
dollars of assets on deposit, so it wouldn't exactly be shocking if it now held
$381B of the world's most popular collateral.
What we do know for certain is that the $381B of T-bonds that are now reported
as having a "Belgium" location are NOT owned by the US Federal Reserve. The Fed
cannot secretly create new money to buy bonds, as every dollar created by the
Fed shows up as a liability on the Fed's balance sheet and a reserve on the
balance sheet of a commercial bank. Anyone who claims that the Fed has been the
buyer of all or part of the $381B stack of T-Bonds with the "Belgium" location
is either ignorant of how the Fed works or is telling lies in order to promote
an agenda.
As an aside, the Fed has overtly done so many counter-productive and unethical
things that there is no need for Fed critics to make up silly stories about what
is supposedly being done in secret.
It seems to us that some people are coming up with 'kooky' explanations for a
T-bond rally that, from their perspective, is inexplicable. After all, with the
Fed "tapering" its bond purchases the price should -- according to conventional
wisdom -- have been trending downward over the past few months. However, an
objective assessment of the facts reveals that there is nothing strange about
this year's T-bond rally.
It is important to recognise one's biases. For example, we have a bias against
US Treasury debt that causes us to be bearish on this market more often than we
should be. But even with our bearish T-bond bias it became clear to us last
December that this market's short-term risk/reward was definitively skewed
towards reward. Sentiment was 'in the toilet' (evidenced, in part, by a large
speculative net-short position) and the market was almost as 'oversold' as it
ever gets, thus paving the way for a tradable rebound even if the secular trend
was in the process of changing from up to down. Since that time the T-Bond has
worked its way higher and has broken out to the upside from an obviously-bullish
basing pattern, and yet most speculators remain stubbornly bearish. This has
created one of the most blatantly bullish sentiment-price mismatches we have
ever seen, suggesting that significant additional price gains are likely over
the months ahead.
What about fundamentals? Isn't the T-bond's rally in conflict with its bearish
fundamentals?
Well, it is not uncommon for a major financial market to move contrary to its
so-called fundamentals for several months, but in the T-bond's case the short-
and intermediate-term fundamentals have become increasingly bullish over the
past few months. First, inflation expectations are low and the downward
reversals in US equity indices that began to appear in March suggest that
inflation expectations are going to stay low for at least six more months.
Second, long-dated US Treasury securities have become very under-valued relative
to investment-grade corporate bonds, junk bonds, European government bonds,
Japanese government bonds and emerging-market government bonds. If you must own
bonds and you don't mind providing financial support to the world's most
destructive organisation, then T-bonds are clearly now the best option.
In summary, the T-bond rally has been driven by sentiment, a reversion to the
mean from an 'oversold' extreme, short covering, inflation expectations and
relative valuation. These drivers generally remain supportive, and although it
is now 'overbought' on a short-term basis the T-bond market is not yet stretched
to the upside on an intermediate-term basis. Significant additional gains are
therefore a good bet prior to the next multi-month peak.
The bottom line is that no conspiracy/manipulation theories are required to
explain the on-going rally.
Monetary Inflation Update
The year-over-year (YOY) rate of growth in US
True Money Supply (TMS) bottomed at around 7.0% in December and has since ticked
up to around 8.0%. How could this uptick have occurred in parallel with the
Fed's "tapering"?
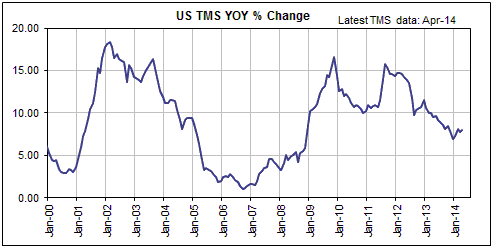
The answer to the above question is that the US commercial banking industry has
recently ramped-up the pace at which it creates credit. US commercial bank
credit has risen by only 3.3% over the past 12 months, but since November of
last year it has expanded at an annualised rate of around 7%.
Up until now, therefore, a faster rate of money creation on the part of
commercial banks has offset the Fed's slower rate of money creation. We doubt
that this will continue to be the case over the months ahead, because a) the
real-estate financing business has begun to contract, b) the relative weakness
of bank stocks suggests that the banking industry is now entering another
stressful period, and c) the recent US economic slowdown will probably turn out
to be more than a weather-related blip. We therefore expect that the US monetary
inflation rate will soon resume its downward trend and that this trend will only
end after there is enough weakness in the stock market and the economic data to
prompt an about-face by the Fed.The Stock
Market
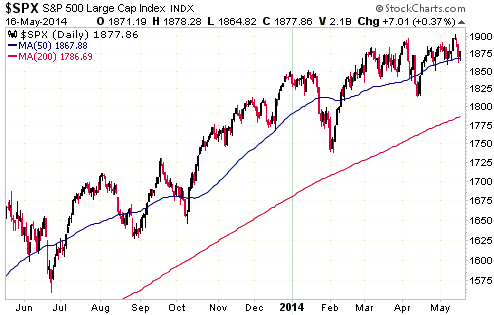
At the most superficial level, very little
has happened in the financial markets since late March. In particular, we note
that the S&P500 Index (SPX), the gold price, the gold-stock indices, the Dollar
Index and the Continuous Commodity Index are all at roughly the same levels now
as they were at the end of March, with minimal intervening volatility. The
following chart illustrates the SPX's recent sideways movement near its all-time
high. Nothing to see here.
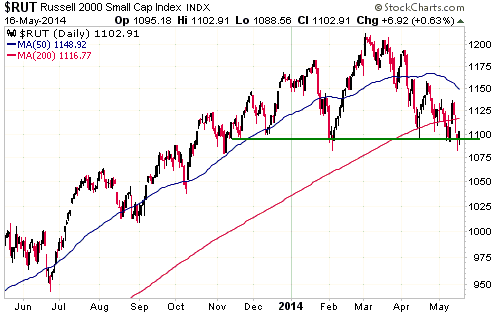
However, if we look just beneath the surface the view gets more interesting. For
one example, the first of the following charts reveals what looks like a
head-and-shoulders topping pattern in the NASDAQ100 Index (NDX), with the 'right
shoulder' having been put in place over the past three weeks. For another
example, the second of the following charts shows that the Russell2000 Small-Cap
Index (RUT) ended last week at critical support defined by its lows of the past
six months.

And if we look further beneath the surface we see two potentially-dramatic
developments. First, we see that after peaking in July of last year and making a
slightly lower peak in late-March of this year, the BKX/SPX ratio (the banking
sector relative to the broad market) fell sharply and broke out to the downside.
The BKX/SPX ratio just hit a 52-week low. Second, we see that the HYG/TLT ratio
(junk bonds relative to T-bonds) peaked at the beginning of this year and just
hit its lowest level since June of last year. The relevant charts are displayed
below.
The recent performances of BKX/SPX and HYG/TLT indicate that a headwind is
gaining force in the stock market and that a tailwind is gaining force in the
gold market.


Well over half of the US stock market has already rolled over to the downside.
The S&P500 should soon follow suit.
This week's
important US economic events
| Date |
Description |
| Monday May 19 |
No important events scheduled | | Tuesday
May 20 |
No important events scheduled | | Wednesday
May 21 |
FOMC Minutes | | Thursday
May 22 |
Existing Home Sales
Leading Economic Indicators
Kansas City Fed Mfg Index
|
| Friday May 23 |
New Home Sales |
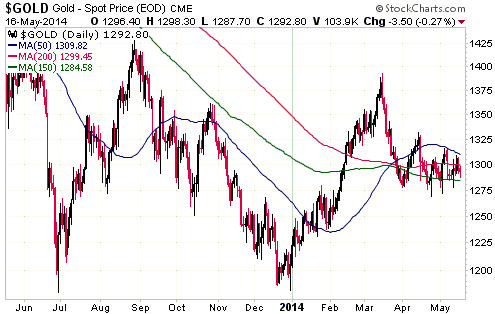
Gold and
the Dollar
Gold
The risk of gold spiking to a new multi-month low before completing its
correction was reduced, but not eliminated, by last week's price action. The
reason for the lowered risk is that gold failed to make a new correction low
despite a marginal new high in the S&P500.
The gold price has essentially gone nowhere for several weeks, which makes
gold's recent performance similar to the recent performances of the currency and
stock markets. Within its narrow trading range, up-swings over the past couple
of weeks have been limited by the 50-day MA. We would therefore view a daily
close above this moving average ($1310) as evidence that the correction was over
and that a new short-term upward trend had begun.
Gold Stocks
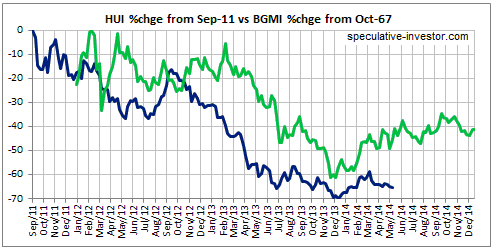
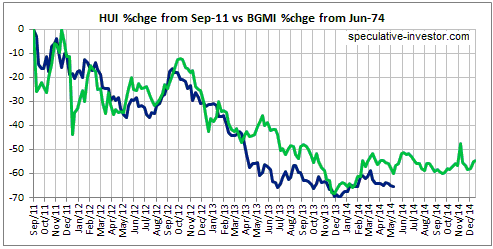
Updated comparisons with the 1970s
Updated charts comparing the BGMI (Barrons Gold Mining Index) from its 1967 and
1974 peaks with the current HUI are displayed below. The current price action
continues to be most similar to 1977 (the second of the following charts).
If the current price action continues to follow the 1977 path then an upward
reversal will occur this week, perhaps following a spike to a new correction
low.
Current Market Situation
Whether or not the HUI broke below short-term support last week depends on how
we draw the support line. Last Friday's low was above the intra-day low reached
in mid-April, but on a daily closing basis the HUI has just made a new
correction low. This suggests that lateral support at 210 will soon come into
play. Refer to the top section of the following daily chart for details.
At the risk of disturbing the dour mood we point out that last Friday's decline
by the HUI to a new daily-closing low for the correction created a bullish
divergence, in that the GDXJ/GDX ratio did not confirm. Refer to the bottom
section of the following chart for details. The recent relative performance of
the HUI and the GDXJ/GDX ratio is similar to their relative performance during
December and suggests that the correction is almost complete.
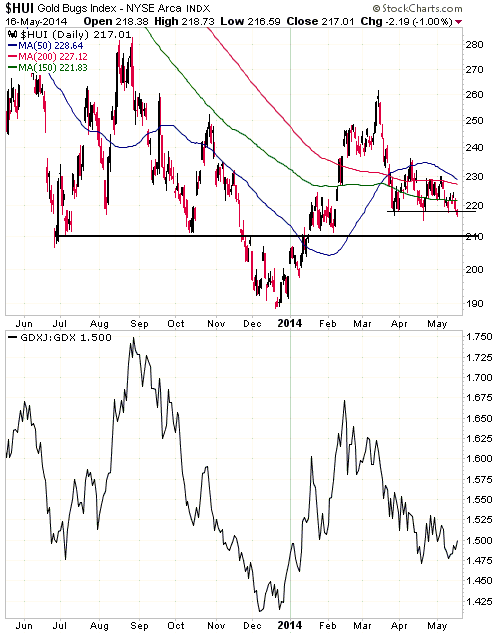
The stage is set for an upward reversal. However, if you are a short-term trader
and were 'long' the gold sector going into last Friday, then for risk management
purposes it would have been reasonable to exit when it became clear that the HUI
was going to close below 219. You can always re-establish your position after a
reversal is signaled.
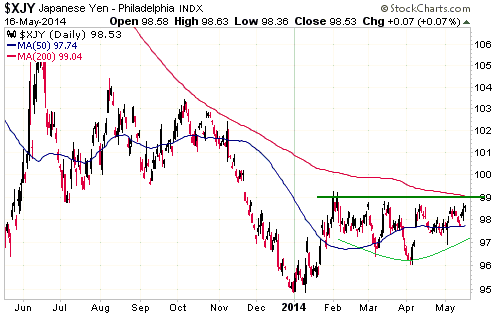
The Currency Market
The Yen's lack of movement epitomises the general financial-market situation.
The Yen and many other markets are 'coiling' in preparation for tradable moves.
For the Yen, the move is likely to be to the upside.
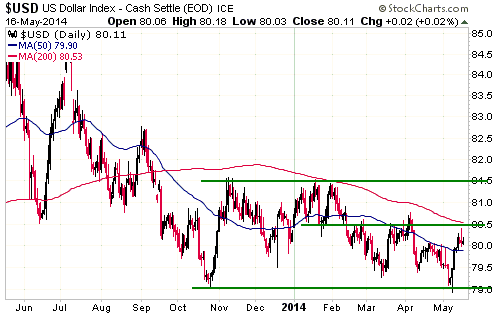
The rebound in the Dollar Index that got underway during the week before last
has eliminated the 'oversold' condition and made it more likely that a break
below support at 79 would have significant follow-through to the downside. Of
course, the Dollar Index still has to break below 79.
The Dollar Index has resistance at 80.5 that was almost tested last week and
more important resistance at 81.5. The most important support obviously lies at
79.
Updates
on Stock Selections
Notes: 1) To review the complete list of current TSI stock selections, logon at
http://www.speculative-investor.com/new/market_logon.asp
and then click on "Stock Selections" in the menu. When at the Stock
Selections page, click on a stock's symbol to bring-up an archive of
our comments on the stock in question. 2) The Small Stock Watch List is
located at http://www.speculative-investor.com/new/smallstockwatch.html
 Company
news/developments for the week ended Friday 16th May 2014: Company
news/developments for the week ended Friday 16th May 2014:
[Note: AISC = All-In Sustaining Cost, FS = Feasibility Study, IRR =
Internal Rate of Return, MD&A = Management Discussion and Analysis,
M&I = Measured and Indicated, NAV = Net Asset Value, NPV(X%) = Net
Present Value using a discount rate of X%, P&P = Proven and
Probable, PEA = Preliminary Economic Assessment, PFS =
Pre-Feasibility Study]
*Almaden Minerals (AAU) published its financial results for the
March quarter. The important number is the working capital, which
fell by $1.5M during the quarter to around $11M. AAU is fully funded
through to at least the end of this year, although we suspect that a
small equity financing will be done during the second half of this
year to top-up the treasury.
*Asanko Gold (AKG) published its financial results for the March
quarter. The financial reports indicate that AKG had $233.6M of
working capital, including $237.7M of cash, at 31st March. It also
has a $150M undrawn credit facility and is therefore fully financed
through to the completion of Phase 1 of the Asanko mine development.
Although AKG still has a very strong balance sheet, its cash reserve
at 31st March was about $17M less than we were expecting. The reason
we thought the company had more cash is that a 3rd April AKG press
release contains the following quote from CEO Peter Breese: "We are
fully funded for phase 1 with $255-million (U.S.) cash...". Shame on
us for thinking that the CEO would know how much cash the company
had.
*Dalradian Resources (DNA.TO) published its financial results for
the March quarter. The TSI Stocks List has exposure to DNA via the
DNA C$0.90 warrants (TSX: DNA.WT) that expire next February. Refer
to the 23rd April Interim Update for further information on DNA and
its warrants.
The financial reports indicate that DNA has about $17M of working
capital, which should be enough to fund the company for another 12
months. Since we expect to exit the warrants within 6 months, it
should also be enough to ensure that we will be out of our position
by the time the next equity financing is arranged.
Our price target for this intermediate-term warrant trade is
C$0.45-C$0.50. For the warrants to trade at this price the shares
will probably have to trade above C$1.30. Considering the stock's
price chart and valuation, this looks achievable.
At Friday's closing price of C$0.91 for the stock, fair value for
the warrants is around C$0.15.
*Energy Fuels (EFR.TO, UUUU) published its financial results for
the March quarter. These results show that the working capital of
this junior uranium producer increased from US$33M to US$42M during
the quarter. Note that the latest quarter included a restructuring
of regulatory bonding that enabled $12M to be transferred from
"restricted cash" to working capital, so while the increase in
working capital is welcome it was not due to operational
profitability.
EFR is a leveraged play on the uranium price that has sufficient
balance-sheet strength and operational flexibility to weather the
current weakness in the uranium market.
*Lydian International (LYD.TO) published its financial results for
the March quarter. The financial reports indicate that LYD had about
$24M of working capital at mid-April, which should be enough to fund
the company for another 12 months.
We are expecting LYD to issue an updated FS for its Amulsar gold
project within the next month.
*Premier Gold (PG.TO) reported its financial results for the March
quarter. As expected, these results show that the company's working
capital was unchanged at around $58M over the course of the quarter,
with an increase in the value of investments held for sale
(Sandstorm Gold shares) offsetting the quarterly spending. It
appears that PG sold most of its remaining investment in Sandstorm
Gold during the quarter, as the company's cash increased by about
$10M while the "investments held for sale" line on the balance sheet
fell to only $8.7M.
We think that PG has enough working capital to fully fund its
operations for at least the next 18 months or until it decides to
move the Hardrock project into the construction phase.
PG also reported that it has commenced the formal Environmental
Assessment (EA) and permitting process at the Hardrock Project,
secured a range of consultants necessary for completion of a
Feasibility Study expected in the first half of 2015, and retained
Mr. Bertho Caron as Engineering & Construction Manager. This means
that PG is progressing Hardrock at a brisk pace given that the
project's PEA was completed less than 4 months ago.
The next market-moving news from PG is expected to be an updated
resource estimate for the Hardrock project within the coming month.
PG is not cheap relative to many other exploration-stage gold mining
stocks, but it has relatively low risk. This is due to its strong
balance sheet, the politically-secure locations of its projects and
the good chance that its largest project will prove to be
economically viable.
*Pretium Resources (PVG) published its financial results for the
March quarter and updated the market on its progress. The company
had $28M of working capital at 31st March, which should be enough to
fund its operations until the final quarter of this year.
The next important milestone for PVG is expected to be the
completion of its amended FS. This is due next month. The economics
indicated by the amended FS are likely to be just as robust as the
economics indicated by the original (June-2013) FS, but the
questions raised by Strathcona regarding the resource estimation
methodology will remain unanswered.
Judging by PVG's recent price action, the stock market has put aside
Strathcona's concerns about the resource. We are referring to the
fact that PVG made a new high for the year in dollar terms last week
(as illustrated by the top section of the following chart) and is
not far from an all-time high relative to its peer group (as
illustrated by the bottom section of the following chart).
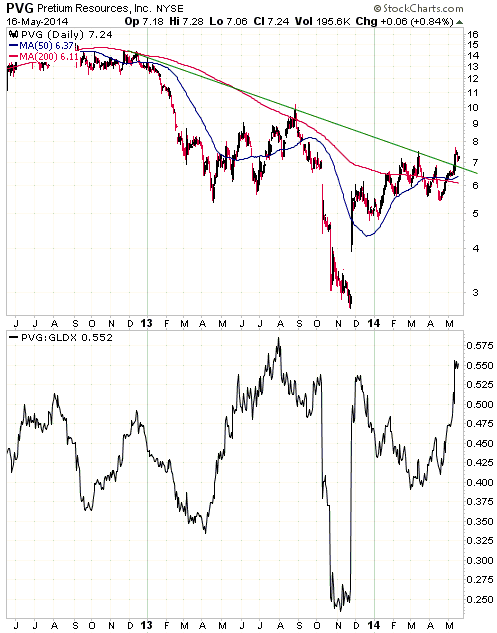
However, the major mining companies that are the most likely
acquirers of PVG probably won't be as quick as the stock market to
dismiss Strathcona's concerns. This could mean that PVG will end up
having to build the mine itself.
*Rio Alto (RIOM) reported some drilling results from its
200K-oz/yr La Arena gold mine in Peru. According to the company's
press release: "The results of the recent drilling program
demonstrate that a large amount of oxide brecciated sandstone
mineralization (the main mineral type at La Arena) lies outside the
2014 Reserve Pit. The results are very encouraging and indicate the
potential to increase oxide gold resources and reserves and the
possibility of extending mine life beyond 2019."
This is good news. Due to its low production costs, every ounce of
gold that gets added to RIOM's reserves has significant value. For
example, whereas a 100K-ounce reserve addition wouldn't necessarily
mean much to an exploration-stage gold miner, based on its current
cost structure a 100K-ounce addition to RIOM's reserves would be
worth $30M at the current gold price and $50M at a gold price of
$1500/oz. To put it another way, at the current gold price and cost
structure, every 100K ounces that gets added to the open-pit oxide
reserves at RIOM's La Arena project adds about $0.17/share of value
to the company.
*Sabina Gold and Silver (SBB.V) published its financial results
for the March quarter. According to these results the company had
about $54M of working capital at 31st March. This compares to $59M
at the end of last year.
As previously advised, SBB's published work programs and budgets
indicate that the company is fully funded through to the end of next
year.
Separately, SBB advised that it has finalised the sale of a small
non-core project to Laurentian Goldfields (LGF.V) for a 6.3% stake
in LGF. This deal was originally announced in January. The financial
value of this deal is not significant for SBB (6.3% of LGF is
presently worth about C$2M), although thanks to the large increase
in the price of LGF shares over the past couple of months the value
is much higher now than it was when the deal was first announced.
List
of candidates for new buying
From within the ranks of TSI stock selections, the best candidates for new
buying at this time are:
1) EDV.TO (last Friday's closing price: C$0.79).
2) EVN.AX at around A$0.80 (last Friday's closing price: A$0.87).
3) PLG.TO (last Friday's closing price: C$1.34).
4) RIOM (last Friday's closing price: US$1.95).
Potential
new TSI stock selection: True Gold Mining (TSXV: TGM). Shares: 398M issued, 483M
fully diluted. Recent price: C$0.37
A few weeks ago we said that despite the weakness in the gold-mining sector, we
were getting frustrated by the resilience of some gold-mining stocks we wanted
to buy. There are exceptions, but during the correction of the past two months
the stocks of gold-mining companies with high production costs or
exploration-stage projects that would need a much higher gold price to become
viable have generally been hit hard, while the stocks of gold-mining companies
with low production costs or exploration-stage projects that would likely be
viable at the current gold price have generally held up well. At this time we
are only interested in buying the latter. Hence, our frustration.
Roxgold (ROG.V) is an example of a stock that hasn't pulled back as far as we
would have liked. In the 23rd April Interim Update we said that we would add ROG,
a company with an economically-robust Feasibility-stage gold project in Burkina
Faso, to the TSI List if it traded at C$0.60 (it was trading at C$0.66 at the
time). Despite a 4% decline in the XAU between then and now, ROG has since
worked its way up to around C$0.70 and no longer has a realistic chance of
trading at our suggested buy price. We will therefore file ROG in the "ones that
got away" category.
True Gold (TGM.V), a company that also has an economically-robust
Feasibility-stage gold project in Burkina Faso, is another example of a stock
that interests us but hasn't yet pulled back far enough for our liking. Although
we have been tracking TGM since last year, this is the first time we've
mentioned it in a TSI commentary. We are mentioning it today because even though
it currently isn't quite cheap enough to warrant inclusion in the TSI List, in
the near future there could be a final downward spike to end the stock's
correction and create the desired buying opportunity.
TGM's Karma gold project has a total resource comprising 2.6M ounces in the M&I
category and 2.4M ounces in the Inferred category (including 1.7M Inferred
ounces at the North Kao target). However, the only part of the deposit that is
economically viable at the current gold price is the leachable oxide portion,
which contains 950K ounces in the main resource and 423K ounces at the North Kao
target. The aforementioned 950K ounces is the only part of the overall deposit
that was considered in the FS completed last December and is the only part of
the resource that interests us at this time, although the remainder has option
value.
The FS revealed a technically simple project with a manageable initial capex of
$131M, a high after-tax IRR of 46.2% at $1300/oz, an after-tax NPV(5%) of $196M
at $1300/oz, and average annual production of 97K ounces at an all-in cost of
$720/oz over a mine life of 8.5 years. These figures certainly justify the
construction of a mine. Furthermore, TGM is almost fully financed through to
production (the company has $70M of cash, which is more than enough to cover the
equity portion of the project financing, and is close to completing the debt
portion of the project financing). Mine construction is expected to begin during
the second half of this year.
TGM offers reasonable value at last Friday's closing price of C$0.37, although
at this price the reward/risk is not quite good enough for us. The current
enterprise value (market cap minus $70M of cash) is only $78M, but we suspect
that the short-term upside could be limited by the 65M C$0.47 warrants that
expire in mid-August of this year. Our view is that the stock would be an
excellent candidate for new buying in the low-C$0.30s and that the reward/risk
would also be sufficiently attractive at C$0.35. A spike down to the low-$0.30s
is possible within the coming fortnight to complete TGM's multi-month
correction, although for TSI record purposes the stock will be bought if it
trades at C$0.35.
TGM's management team is highly regarded. Of particular note, Mark O'Dea, the
company's executive chairman, is the former CEO of Fronteer Gold and the current
non-executive chairman of Pilot Gold.
At this time our 6-month target is C$0.50 and our 12-month target is C$0.70.
Many other junior gold stocks have greater upside potential, but a large part of
TGM's appeal stems from its relatively low risk.
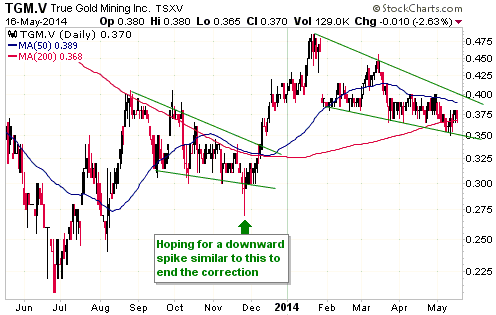
Chart Sources
Charts appearing in today's commentary
are courtesy of:
http://stockcharts.com/index.html

|
