![]()
![]()
![]()
![]()
-- Weekly Market Update for the Week Commencing 19th August 2019
Big Picture
View
Here is a summary of our big picture
view of the markets. Note that our short-term views may differ from our
big picture view.
The BULL market in US Treasury Bonds that began in the early 1980s ended in mid-2016, but there will be many years of topping action in bond prices and bottoming action in bond yields before major new trends get underway. A major decline in government bond prices will unfold during the 2020s. (Last update: 11 September 2017)
The stock market, as represented by the S&P500 Index, commenced a secular BEAR market during the first quarter of 2000, where "secular bear market" is defined as a long-term downward trend in valuations (P/E ratios, etc.), gold-denominated prices and inflation-adjusted prices. This secular trend will bottom in 2020 or later. (Last update: 11 September 2017)
A cyclical BEAR market in the US Dollar began in 2016-2017. (Last update: 11 September 2017)
Gold commenced a secular bull market relative to all fiat currencies, the CRB Index, bonds and most stock market indices during 1999-2001. This secular trend will peak in 2020 or later. (Last update: 11 September 2017)
Commodities,
as represented by the CRB Index, commenced a
secular BULL market in 2001 in nominal dollar terms. The first major
upward leg in this bull market ended during the first half of 2008, but
a long-term peak won't occur until 2020 or later.
(Last
update: 11 September 2017)
Copyright
Reminder
The commentaries that appear at TSI
may not be distributed, in full or in part, without our written permission.
In particular, please note that the posting of extracts from TSI commentaries
at other web sites or providing links to TSI commentaries at other web
sites (for example, at discussion boards) without our written permission
is prohibited.
We reserve the right to immediately
terminate the subscription of any TSI subscriber who distributes the TSI
commentaries without our written permission.
True
Fundamentals Summary
[Notes:
1) The date shown next to the current True Fundamentals Model (TFM) signal is
when the most recent change occurred. 2) Charts of the Gold and Equity
TFMs are included in the "Charts and Indicators" section of the TSI web
site]
| Market | True Fundamentals Model (TFM) |
| Gold (US$ Price) | Bullish (04 Jan 2019) |
| US Equity (SPX) | Bearish (19 Apr 2019) |
| Currency (Dollar Index) | Neutral (15 Mar 2019) |
| Commodities (GNX) | Bearish (01 Jun 2018) |
Last week's posts at the TSI Blog
There were no blog posts last week.
Summary of current
thinking/positioning
1) The performance of the Dollar
Index (DX) could be 'choppy' for 1-3 more months, but the most likely
direction of the next tradable move is down.
2) The US$ gold price
has broken out to the upside on a monthly basis and has confirmed a bull
market (implying the likelihood of significant additional gains over the
coming 1-2 years). However, the short-term risk/reward is no longer
favourable. We expect that a short-term top will be in place by
early-September.
3) As is the case with gold bullion, the
gold-mining sector's short-term risk/reward is no longer favourable.
However, substantial additional gains probably will be made within the
next 6 months.
4) The SPX has signaled a short-term top and
probably has commenced a sizable 1-2 month decline.
5) The start of
a multi-quarter T-Bond decline has been delayed by recent market action.
We guess that a downward trend will get underway during September-October,
but first a short-term top must be signaled. There is a risk that
near-term stock market weakness will lead to additional upside in the
T-Bond.
6) We are holding a cash reserve of about 25%.
Commodities
Expecting a platinum
breakout
First gold broke out to the upside (from a
long-term consolidation) and then silver broke out to the upside (from a
long-term downward trend). Next it should be platinum's turn.
For
platinum, a weekly close above $920 would be a major upside breakout as it
would take out the April-2019 intermediate-term top and the
downward-sloping trend-line dating back to the 2016 top.
Platinum is absurdly cheap relative to palladium, very cheap relative
to gold and moderately cheap relative to silver. This suggests the
potential for a big catch-up move.
As is the case for silver, for
platinum we have the 2016 top in mind as a minimum intermediate-term
upside target. Our maximum upside target is the gold price, that is, our
maximum target for the platinum price is whatever it needs to be to
achieve a platinum/gold ratio of 1. As we first mentioned a few years ago,
we think that 1 has gone from being a long-term floor to being a long-term
ceiling for the platinum/gold ratio.
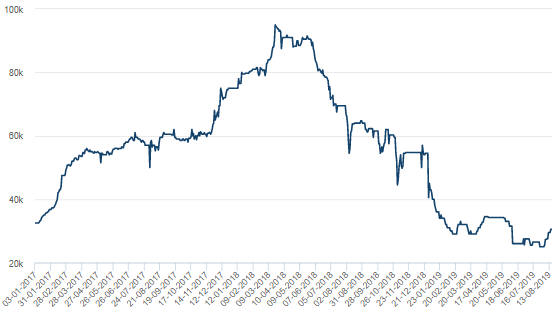
Cobalt makes another
attempt to bottom
The following chart shows that since the
beginning of this month the per-tonne cobalt price has risen from $25,000
to $30,500, or about 20%. This bounce doesn't look meaningful yet, but it
could develop into something significant. After all, cobalt is a useful
commodity that is becoming more useful over time due to the increasing
popularity of electric vehicles (EVs). There's a limit to how cheap it can
get.
The bounce from the early-August multi-year low will begin to
look significant if the price moves above the April-2019 rebound high,
that is, if the price moves above $35,000/tonne.
The surprising nickel rally
Over the past
several weeks most industrial metals markets have been in the doldrums,
but the nickel market has been 'on a tear'. The nickel price has gained
34% since early-July and is now at its highest level in more than four
years.
The most plausible explanation for the rapid rise in the nickel price
is a short-term supply shortage. This is evidenced in part by the
following chart, which shows that the amount of nickel in LME warehouses
has been in a steep downward trend and is now at a very low level. The
amount of an industrial metal in the reported LME inventory is often NOT a
good indicator of the overall physical supply-demand situation, but in
this case it is because a short-term tightness of physical supply is also
indicated by the LME futures curve (the nickel futures curve reveals a
slight backwardation over the remainder of this year).
We are long-term bullish on nickel due to the increasing demand for
this metal from the EV industry, but we didn't anticipate the recent price
surge and we have no opinion on what will happen to the price over the
next few months.
No evidence of a copper bottom, yet
The chart displayed below shows that the copper price is testing
intermediate-term support at $2.55-$2.60/pound. The support probably will
be breached before a sustainable low is in place, but there is at least
one reason to think that a breach of support will not be followed by a
substantial decline. The reason is sentiment.
The total speculative
net-short position in Comex copper futures is larger than it has ever
been. This limits the scope for additional short selling and creates a
set-up for a strong rebound.
Our guess is that the copper price
will bottom in the $2.40s within the next two months.
Oil: Short-term uncertain
Over the past two
months oil has traded in a choppy manner with a downward bias. It tested
its early-June low a couple of weeks ago and has since rebounded to a
confluence of resistance at $55-$57.
The futures curve tells us that the supply-demand situation in the
physical market is supportive for the price. We are referring to the fact
that the futures curve covering the next two years has a slight downward
slope. This indicates a market in slight backwardation, that is, a market
in which physical supply is a little tight (due to the cost of storage, if
the market were well supplied the futures curve would have an upward
slope).
Also, sentiment is constructive. Of particular relevance,
the "NonReportable" category of traders in NYMEX oil futures (the 'dumb
money') has built up its largest net-short position in almost three years.
The biggest short-term risk is linked to the positive correlation
between the oil price and the US stock market. Due to this relationship,
the oil price probably will come under irresistible downward pressure if
the US stock market does roughly what we expect and drops by 5%-10% within
the next few weeks.
Currently we are intermediate-term bullish on
oil and expect to become short-term bullish after we see evidence that the
stock market has made a multi-month bottom.
The Stock Market
The past as prologue
When the US stock market, as represented by the S&P500 Index (SPX),
makes a July high there is a strong tendency for it to fall by at least
10% to an August low and to reach an important turning point in October.
Most of the time the October turning point is a reversal from down to up.
This historical pattern is relevant at the moment, because the SPX
recently reversed downward from a July high.
Here are five examples
of the pattern described above:
1) 1998 contained the most common
version of the pattern. As illustrated below, the SPX plunged from a
mid-July high to an August low. It then rebounded to moving-average
resistance before dropping sharply to test its August low in
early-October. The October low marked the end of a multi-month correction.
2) In 1999, a mid-July high was followed by a sharp drop to an August
low. There was then a quick rebound that retraced about 70% of the initial
down-move followed by a choppy decline to a new 6-month low in
mid-October. The October low marked the end of a multi-month correction.
3) In 2007, a plunge from a mid-July high to a mid-August low was
followed by a rally to a marginal new all-time high in early-October. A
bear market then got underway.
4) 2011 was similar to 1998, with an October spike below the August
low proving to be a successful test of the low. As was the case in 1998
and 1999, the October low marked the end of a multi-month correction.
5) 2015 was similar to 1998 and 2011, but in this case the October low
did not mark the end of the correction. There was a strong rebound from
the October low to a secondary high in November, and then the
intermediate-term correction resumed. The correction low was in February
of the next year.
Turning to the 2019 year-to-date performance, the following chart
shows that we have a July high followed by a sharp pullback into August.
For the July-August decline to achieve the minimum magnitude suggested by
the pattern described above, this month's low will have to be 2725 or
lower. That is, at some point over the next two weeks the SPX will have to
trade at least 160 points (5.5%) below Friday's closing price. This is not
a forecast; it's an indication of what's possible in the near future given
what happened from a similar set-up in the past.
Current US Market Situation
The chart
displayed above shows that the SPX has oscillated in a fairly wide range
over the past two weeks, with plunges ending at around 2825 and rebounds
capped by the 50-day MA at around 2940. It ended last week near the
mid-point of this range.
The well-worn July-October pattern
discussed above suggests that the SPX will plunge to the low-2700s or
lower within the coming fortnight, but there is always more than one
possible outcome. Another possibility -- with a lower probability, in our
opinion -- is that a short-term correction ended last Thursday when the
early-August low was tested and that the SPX is now on its way to a new
all-time high. This lower-probability outcome likely would create an
excellent opportunity next month to purchase stock-index put options with
about 6 months to expiry, but we'll cross that bridge if we come to it.
The NASDAQ100 Index (NDX) has been stronger than the SPX, but its
chart position is similar. As with the SPX, the NDX was capped by its
50-day MA over the past two weeks.
Some US stock indices are positioned very differently than the SPX and
the NDX, however. For example, the following charts show that the Dow
Transportation Average (TRAN) and the Russell2000 SmallCap Index (RUT)
tested their 6-month lows last week. If the TRAN and the RUT soon take out
last week's lows it will confirm that the above-described July-October
pattern is in play for the SPX.

At the risk of muddying the waters, after being dangerously-optimistic
during the second half of June and the bulk of July, stock market
sentiment is now supportive. This is evidenced by the bottom section of
the following chart, which shows that late last week the 10-day MA of the
equity put/call ratio reached its second-highest level of the past three
years. The only time it was higher was near the December-2018 price
bottom.
The TSI Put/Call Indicator is not close to a buy signal,
but the recent surge in the equity put/call ratio suggests that the 'dumb
money' has become fearful very quickly. Sentiment being a contrary
indicator, this is bullish.
Summing up, other outcomes are certainly possible, but the following
comments from last week's Interim Update still reflect our assessment of
the highest-probability short-term outcome:
"...the short-term
downside target we have in mind for the SPX is the early-June low (around
2730). We expect this target to be reached within the next three weeks.
Given the bearish fundamental backdrop the SPX ultimately could drop a lot
further than that, but it should at least drop as far as its early-June
low before a multi-month bottom is reached."
Hong Kong
Anyone who hasn't been asleep for the past several weeks would know
that the people of Hong Kong (HK) have been protesting en masse and that
some of the protests have involved violent clashes with the police. The
protests initially were focused on a new law that would enable China's
government to extradite people from HK to the Mainland, but the demands of
the protesters have expanded to include an inquiry into police violence,
the granting of amnesty to everyone arrested during the protests to date,
the resignation of HK's current Chief Executive (Carrie Lam) and a change
to the political system to enable HK residents to elect their own Chief
Executive. For its part, China's government has made it clear that if the
large-scale civil disobedience continues then a branch of the Mainland
armed forces will be sent to HK to restore order.
Economically, the
biggest risk to HK is the possibility that China's military will intervene
to quell the protests. This would cause confidence to collapse and capital
to flee HK. It also would cause economic confidence to plunge globally, so
don't be thinking that what's happening in HK won't affect you
financially.
Military intervention from the Mainland is not the
most likely outcome, because it would be a reputational disaster for
China's government and an economic disaster for China. However, at this
point it is not clear how the conflict will end in the absence of military
intervention, because some of the protesters' demands are impossible
dreams. In particular, there is no way that China's government will allow
HK's Chief Executive to be elected via a true democratic process.
Our best guess at this time is that the HK government will make some
concessions to the protesters, including rescinding the extradition bill,
establishing an independent inquiry into the events of the past few months
and granting amnesty to many of those who were detained. This could be
enough to placate most of the protesters and enable order to be restored
peacefully. However, things could turn out much worse.
The
following chart of HK's Hang Seng Index (HSI) shows two 10%+ plunges over
the past four months. The first plunge was in May and was set in motion by
the rekindling of the US-China trade war. The second plunge began late
last month and was a reaction to the economic risks created by the
protests. A rebound began last week after the early-January low was
tested.
If the protests continue then the current rebound almost
certainly will be followed by a decline to new multi-year lows.
This week's
significant US economic events
[Notes:
1) The most important events
(to the markets) are shown
in bold. 2) A list of global economic events can be found
HERE]
| Date | Description |
| Monday Aug-19 | No important events scheduled |
| Tuesday Aug-20 | No important events scheduled |
| Wednesday Aug-21 |
FOMC Minutes Existing Home Sales |
| Thursday Aug-22 | No important events scheduled |
| Friday Aug-23 |
New Home Sales Jerome Powell speech at Jackson Hole |
Gold and the Dollar
As is the case with gold, the short-term risk/reward for the gold
mining indices/ETFs is now slightly bearish. There is a realistic chance
of a final surge to new highs for the year within the next couple of weeks
in dollar terms, but there's a high probability that the gold-mining
sector made a multi-month peak relative to gold bullion a few weeks ago.
Anyone with substantial exposure to gold (or silver) stocks should be
looking for opportunities to take money off the table or hedge in some
other way, for example by purchasing put options on ETFs such as GDX and
GDXJ. In particular, any strength over the next two weeks should be viewed
as a chance to hedge long positions.
The Currency Market
The week before last and early last week the Dollar Index (DX) tested
support at 97.2. After support held firm, the DX rose to test resistance
at 98.1.
We can't glean anything from this price action. The next
1-2 week move could be a rise to test the more important resistance at
around 98.7 or it could be continued 'choppiness' in the 97.2-98.1 range.
The Yen-gold relationship is interesting again.
As illustrated
by the following chart, there is a strong tendency for the Yen and the US$
gold price to trend in the same direction, but one generally leads the
other at short-term turning points. The Yen has been the leader since the
beginning of this year, having turned down before gold in Q1 and turned up
before gold in Q2.
At the moment the two markets are in synch, but
we are on the lookout for a divergence or non-confirmation. For example,
it would be significant if gold were to make a new high for the year
within the next two weeks while the Yen stayed below last week's high.
This would warn that a gold-price top was near.
Updates
on Stock Selections
Notes: 1) To review the complete list of current TSI stock selections, logon at
http://www.speculative-investor.com/new/market_logon.asp
and then click on "Stock Selections" in the menu. When at the Stock
Selections page, click on a stock's symbol to bring-up an archive of
our comments on the stock in question. 2) The Small Stock Watch List is
located at http://www.speculative-investor.com/new/smallstockwatch.html
![]() Company
news/developments for the week ending Friday 16th August 2019:
Company
news/developments for the week ending Friday 16th August 2019:
[Note: AISC = All-In Sustaining Cost, EBITDA = Earnings Before
Interest, Tax, Depreciation and Amortisation (a measure of cash flow), EV
= Enterprise Value or Electric Vehicle, FS = Feasibility Study, FY =
Financial Year, IRR = Internal Rate of Return, ISR = In-Situ Recovery, JV
= Joint Venture, MD&A = Management Discussion and Analysis, M&I = Measured
and Indicated, NAV = Net Asset Value, NPV(X%) = Net Present Value using a
discount rate of X%, NSR = Net Smelter Return or Net Smelter Royalty, P&P
= Proven and Probable, PEA = Preliminary Economic Assessment, PFS =
Pre-Feasibility Study]
*Alita Resources (A40.AX)
has requested (and been granted) the suspension of trading in its shares
pending an update regarding the previously announced Strategic Review,
offtake arrangements, operations at the Bald Hill Mine and discussions
with the Company's lenders. The voluntary suspension will remain in effect
until the earlier of an announcement to the market or 3rd September 2019.
We don't have any non-public information regarding what the company is
planning/negotiating and don't expect to know more until the
above-mentioned announcement is made.
*Alkane
Resources (ALK.AX) reported the initial results from a 60,000m
resource definition drilling program undertaken at the San Antonio and
Roswell targets, which are located within easy trucking distance of the
company's Tomingley Gold Operation (TGO). The initial 5,000m of drilling
included these significant gold intercepts from the San Antonio prospect:
36 metres grading 5.09g/t, 39 metres grading 3.59g/t and 9.7 metres
grading 8.01g/t.
There's a good chance that ore from the
aforementioned prospects eventually will enable a multi-year extension to
the TGO's life.
*Africa Oil (AOI.TO)
published its financial results for the June-2019 quarter.
At 30th
June the company had no long-term liabilities to speak of, US$312M of
working capital and US$67M of equity investments (a 34.5% stake in Africa
Energy Corp (AFE.V), an 18.8% stake in Eco (Atlantic) Oil and Gas (EOG.C),
and a 30.1% stake in private company Impact Oil and Gas), that is, the
company had US$379M of working capital plus equity investments (WC+EI).
This compares to US$393M of WC+EI at the end of the preceding quarter and
$407M of WC+EI at the end of last year.
Note that AOI accounts for
its equity investments at cost rather than current market value.
Currently, the market value of these investments adds up to about US$118M,
or US$51M more than the amount included on AOI's balance sheet.
The
company's main operating costs are expenditures associated with appraisal
activities and developments studies at the 25%-owned South Lokichar Basin
oil project in Kenya. It is expected that over the next few years South
Lokichar will be developed into a producing oil field with output of
around 100K barrels of oil per day (bopd).
In addition to its 25%
stake in South Lokichar and its equity investments, AOI is in the process
of acquiring 12.5% of a company that holds interests in multiple offshore
oil fields in Nigeria. This is a major acquisition that when complete will
immediately transform AOI from an oil explorer/developer to a profitable
oil producer. However, the completion time is unknown.
Accounting
for AOI's equity investments at market value and converting USD to CAD,
the WC+EI amount is C$573M. This equates to C$1.22/share, meaning that if
you buy AOI at the current price of C$1.12/share you effectively get the
company's South Lokichar stake for free.
*Cobalt 27
(KBLT.V) advised that the meeting of shareholders to vote on the
proposed takeover by Pala Investments has been scheduled for 12th
September.
More information regarding the takeover was provided in
a Management Information Circular (MIC) filed by the company on 14th
August. Here are two of the most interesting pieces of new information:
1) According to the MIC, when determining the value of the cobalt
assets to be acquired by Pala the current very-depressed market value was
used, whereas the other (mainly nickel) assets that would go into the new
company called Nickel 28 have been valued at cost or above cost. This
explains how management can claim that Nickel 28 is worth C$2.18/share at
the same time as the market is implying a value of only about
C$0.40/share.
2) We noted in the 15th July Weekly Update that if
the takeover is successful then KBLT's existing managers will receive
change-of-control payments and will manage the spin-out company (Nickel
28), that is, they will receive financial bonuses for having sold near an
all-time low AND continue to draw their salaries. We now know the
magnitudes of the change-of-control payments. According to page 46 of the
MIC, Anthony Milewski (CEO and Chairman) will receive a US$7.7M bonus and
Justin Cochrane (COO and President) will receive a US$5.3M bonus.
Also worth mentioning is that the press release that announced the meeting
date and the MIC filing contained the following statement: "Cobalt 27
is expected to have up to $48.5-million (U.S.) of net corporate debt on
closing of the arrangement ... [that] will be repaid by Pala. Absent the
transaction, Cobalt 27 would need to service and repay the majority of the
aforementioned debt using its own resources."
This creates the
impression that KBLT could be under financial pressure due to the US$48M
of outstanding debt if the Pala takeover is not approved, which absolutely
is not the case. First, repayment of the debt is not due for three years.
Second, KBLT has a US$100M credit facility plus a US$50M accordian
facility, meaning that it still has more than US$100M of unused credit.
Third, the company has cobalt in storage with a current market value of
about US$90M, or almost double the current amount of debt.
The
proposed takeover is a very bad deal for shareholders (other than Pala) so
we strongly suggest voting AGAINST it.
*Golden Arrow
Resources (GRG.V) advised that the meeting of shareholders to
vote on the proposed sale of GRG's 25% stake in the Pirquitas-Chinchillas
mining operation in Argentina has been scheduled for 16th September.
We aren't as 'anti' this deal as we are the KBLT deal mentioned above.
Unfortunately, it seems that the silver rally started about three months
too late for GRG and the company found itself in a difficult financial
situation.
If the sale is approved then GRG will end up with liquid
financial assets (cash plus SSRM shares) worth about C$0.24/share and a
portfolio of exploration-stage assets in Argentina, Chile and Paraguay. In
other words, the stock should be worth C$0.24 even if no value is assigned
to the exploration portfolio. We think it's fair to assign an option value
of at least C$10M to the exploration portfolio, resulting in a minimum
total value per share of C$0.33. This is double the current stock price.
*Peyto Exploration & Development (PEY.TO)
confirmed its monthly 0.02/share dividend. At the current share price the
annual dividend yield is about 8%.
The stock has been trading as if
the dividend is under threat. Up until now the company has been generating
more than enough cash to fund the dividend, so we expect it to be
maintained and eventually increased. However, we can't rule out the
possibility that the dividend will be reduced in the short term for risk
management purposes.
*Sabina Gold and Silver
(SBB.TO) published its financial statements for the June-2019
quarter. They show that the company had C$27.7M of working capital (and no
long-term debt) at 30th June, which is down from C$34.5M at the end of the
preceding quarter. During the June quarter the company raised C$5.2M to
fund an exploration program designed to expand the existing resource, so
cash consumption during the quarter was C$12M.
SBB's Back River
gold project is fully permitted and construction ready, but up until now
the company has been unable to raise the equity portion of the US$330M
needed to fund the pre-production capex on reasonable terms. It therefore
has focused on reducing project risk and growing the high-grade resource
pending an improvement in market conditions. Market conditions clearly
have improved over the past two months, but probably not by enough to
enable construction financing to be arranged at an acceptable cost.
We expect that SBB eventually will be taken over by a larger company
such as Agnico Eagle, but ideally the takeover bid won't come until after
the stock price has moved above C$2.00. In the meantime, the biggest
company-specific short-term threat to the stock price is an equity
financing to top-up the treasury. The company has enough cash to fund
itself until year-end, but management probably won't want the working
capital to drop below about C$15M. Therefore, it's likely that C$10M-C$20M
of new shares will be issued within the next three months.
![]() List
of candidates for new buying
List
of candidates for new buying
From within the ranks of TSI
stock selections the best candidates for new buying at this time, listed
in alphabetical order, are:
1) ALK.AX (last Friday's closing price:
A$0.41)
2) GRG.V (last Friday's closing price: C$0.16)
3)
KBLT.V (last Friday's closing price: C$3.86)
4) PEY.TO (last
Friday's closing price: C$3.18)
5) PG.TO in the low-C$2 area (last
Friday's closing price: C$2.16)
The above list is limited to five
stocks. It sometimes will contain less than five, but it never will
contain more than five regardless of how many stocks are attractively
priced for new buying.
Chart Sources
Charts appearing in today's commentary
are courtesy of:
https://stockcharts.com/
https://www.lme.com/
https://www.kitco.com/