|
-- Weekly Market Update for the Week Commencing 19th December 2005
Big Picture
View
Here is a summary of our big picture
view of the markets. Note that our short-term views may differ from our
big picture view.
Bonds commenced a secular BEAR market in
June of 2003. (Last
update: 22 August 2005)
The stock market, as represented by the S&P500 Index, commenced a secular BEAR market during the first quarter of 2000. The rally
that
began in October of 2002 will end by the first quarter of 2006 and will
be followed by a substantial decline to a higher low (above the
Oct-2002 bottom) during the second half of 2006. The ultimate bottom of
the secular bear market won't occur until the next decade. (Last update: 12 December 2005)
The Dollar commenced a secular BEAR market during the final quarter of 2000. The
first major downward leg in this bear market ended during the first
quarter of 2005, but a long-term bottom won't occur until 2008-2010. (Last update: 28 March 2005)
Gold commenced a secular BULL market during 1999-2001. The first major upward leg in this bull market ended in December of 2004, but a long-term
peak won't occur until 2008-2010. (Last update: 28 March 2005)
Commodities, as
represented
by the CRB Index, commenced a secular BULL market in 2001. The first
major upward leg in this bull market ended during the first quarter of
2005, but a long-term
peak won't occur until 2008-2010. (Last update: 28 March 2005)
Copyright
Reminder
The commentaries that appear at TSI
may not be distributed, in full or in part, without our written permission.
In particular, please note that the posting of extracts from TSI commentaries
at other web sites or providing links to TSI commentaries at other web
sites (for example, at discussion boards) without our written permission
is prohibited.
We reserve the right to immediately
terminate the subscription of any TSI subscriber who distributes the TSI
commentaries without our written permission.
Outlook Summary
Market
|
Short-Term
(0-3 month)
|
Intermediate-Term
(3-12 month)
|
Long-Term
(1-5 Year)
|
Gold
|
Neutral
(5-Dec-05)
|
Neutral
(6-Dec-04)
|
Bullish
|
US$ (Dollar Index)
|
Neutral
(12-Dec-05)
| Bullish
(31-May-04)
|
Bearish
|
Bonds (US T-Bond)
|
Bullish
(16-Nov-05)
|
Neutral
(20-Jul-05)
|
Bearish
|
Stock Market (S&P500)
|
Bullish
(7-Nov-05)
|
Bearish
(05-Jan-05)
|
Bearish
|
Gold Stocks (HUI)
|
Neutral
(30-Nov-05)
|
Neutral
(12-Dec-05)
|
Bullish
|
General Commodities (CRB)
|
Neutral
(14-Nov-05)
|
Bearish
(23-Mar-05)
|
Bullish
|
Notes:
1. In those cases where we have been able to identify the commentary in
which the most recent outlook change occurred we've put the date of the
commentary below the current outlook.
2. "Neutral", in the above table, means that we either don't have a
firm opinion on which way the market will move or that we expect the
market to be trendless during the timeframe in question.
3. Long-term views are determined almost completely by fundamentals,
intermediate-term views by giving an approximately equal weighting to
fundmental and technical factors, and short-term views almost
completely by technicals.
TSI Xmas and New Year Schedule
There will be no Weekly
Market Update on Sunday 25th December, but all other commentaries over
the Xmas and New Year holiday period will be posted at the usual times.
Hope you have a wonderful Christmas and a happy, healthy and prosperous 2006!
The Stock
Market
Airline Stocks and Oil
A
drop in the oil price to at least the low-50s will probably have to
happen for the XAL to move substantially above its current level.
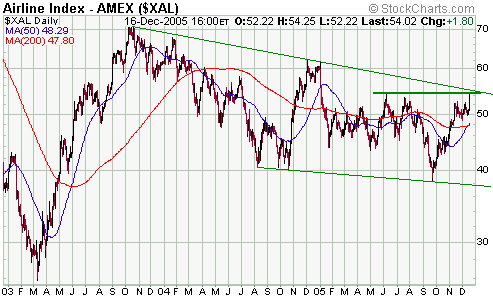
Below is a daily chart of the AMEX Airline Index (XAL) covering the past three years.
The XAL rocketed upward between March and October of 2003, after which
it embarked on a lengthy decline that MIGHT have ended in September of
this year. Given that it took the XAL almost 2 years to partially
retrace the gains made during the space of 7 months, we suspect that
the October-2003 through to September-2005 decline was a consolidation
within an on-going cyclical bull market (the airline sector is in a
secular bear market that we expect will continue into the next decade,
but secular bear markets generally contain one of two cyclical bull
markets).
A sustained move above 56 would signal that the consolidation of the
past two years was over and that a test of the October-2003 peak (70)
was probably in store.
The Airline Index
could also be called the Anti-Oil Index due to the inverse correlation
between airline stocks and the oil price. Whether or not the XAL is
able to break above resistance at 56 and push-on upward to test its
October-2003 peak will therefore be determined, to a large extent, by
what happens to the oil price. A drop in the oil price to at least the
low-50s will probably have to happen for the XAL to move substantially
above its current level.
Oil is in a secular bull market, but we don't think the peak reached in
the immediate aftermath of Hurricane Katrina will be exceeded anytime
soon. Oil will probably trade in the low 50s and possibly trade as low
as the mid-to-high 40s before it trades above its August-2005 peak.
At this stage we are comfortable holding the long position in the
airline sector originally mentioned in the 17th October Weekly Update
and would consider a near-term pullback in the XAL to around 50 as an
opportunity for new buying. However, this is not a position we will
retain if it begins to move against us in a meaningful way. We will
therefore exit if the XAL closes below 47.5.
Current Market Situation
The huge rallies in the energy and homebuilding stocks grabbed much of
the limelight over the past few years, but the sector of the US stock
market with the most consistent upward trend has been the utility
sector.
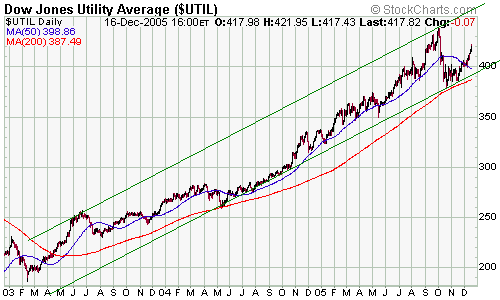
The following chart shows that the Dow Jones Utility Average (DJUA) has
trended higher within a well-defined channel from February of 2003 to
the present day. It also shows that this index has not traded below is
200-day moving average since April of 2003. However, notice that the
DJUA has not yet confirmed the recent moves to new recovery highs by
some other important stock indices by moving to a new bull-market high
of its own. This is the first non-confirmation of this type since the
beginning of the cyclical bull market in early 2003. The utility sector
is often a leading indicator, so confirmation of a downward reversal in
this sector's intermediate-term trend would have bearish implications
for the overall market.
If our intermediate-term bearish view on the broad stock market is
correct then at some point over the next few months the DJUA should
drop below its October-2005 low. In so doing it would close below the
bottom of its 3-year channel, break its sequence of higher highs and
higher lows, and move decisively below its 200-day MA.
We are anticipating
an ugly stock market outcome as far as the final three quarters of next
year are concerned, but in the short-term we remain bullish.
This week's
important US economic events
| Date |
Description |
Monday Dec 19
| No significant events scheduled
|
| Tuesday Dec 20
| PPI
Housing Starts
| | Wednesday Dec 21
| Q3 GDP (final)
| | Thursday Dec 22
| Personal Income and Spending
Leading Economic Indicators
| | Friday Dec 23
| Durable Goods Orders
New Home Sales
|
Gold and
the Dollar
Gold and Silver
The Japanese Influence
...substantial strength in the US$ relative to the Yen became a major positive for gold and gold stocks.
Below is a chart that compares the performances of the HUI and the Yen
over the past three years (the blue line on the chart is the Yen).
Notice that prior to September of this year the trends in the HUI and
the Yen were very similar, but that everything suddenly changed at the
beginning of September. If the strong positive correlation between the
two markets that had been evident prior to September of this year had
persisted then the Yen's relentless slide over the past
three-and-a-half months would have been accompanied by weakness in the
gold sector. However, what actually happened was that Japanese
investors, looking to insulate themselves from the weakness in the Yen
relative to the US$, began to buy gold; and this buying became one of
the main driving forces behind the rally in the US$ gold price.
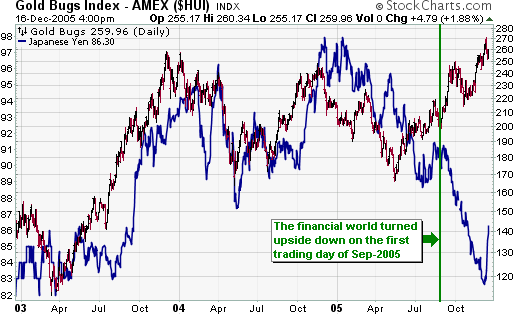
The above chart does
a good job of showing why 2005 has been quite a challenging year. For
example, we had anticipated the weakness in the gold sector during the
first 5 months of the year as well as the rebound from the May low, but
had expected the rebound from the May low to end within 2-3 months and
be followed by a decline to an important low during either the final
quarter of this year or the first quarter of 2006. Our thinking was
that this decline would be driven, in part, by US$ strength, and that
it would set the scene for the next major upward leg in the HUI's
long-term bull market. As things turned out, substantial strength in
the US$ relative to the Yen became a major POSITIVE for gold and gold
stocks.
If our long-term views are correct then the strong inverse relationship
between gold-related investments and the Yen that leapt to centre stage
on the first trading day of September will not be long-lived. This is
because we are long-term bulls on gold AND the Yen. In the short-term,
however, it's reasonable to expect that additional strength in the Yen
would prove to be a negative for gold whereas a resumption of the Yen's
decline would be a positive.
Current Market Situation
...the
best we can reasonably expect [from gold] over the next few months is
for Monday's intra-day high to be tested. ...Although silver, like
gold, has just experienced an 'outside down' reversal week we continue
to think it has a good chance of making new highs during the first
quarter of 2006.
In the 12th December Weekly Update we said that a 2-4 week pullback in
the gold market at this time would potentially extend the advance into
the first quarter of next year, whereas a continuation of the advance
into year-end would probably create an intermediate-term peak. Monday's
large upward spike and the plunge that subsequently occurred have,
however, altered our outlook.
When we said that a pullback at this time might extend the overall
advance the sort of thing we had in mind was gold easing back from the
520s to support at 500-510 over the ensuing few weeks. What we didn't
have in mind -- but what actually happened -- was a major reversal with
gold spiking higher at the beginning of the week and then falling far
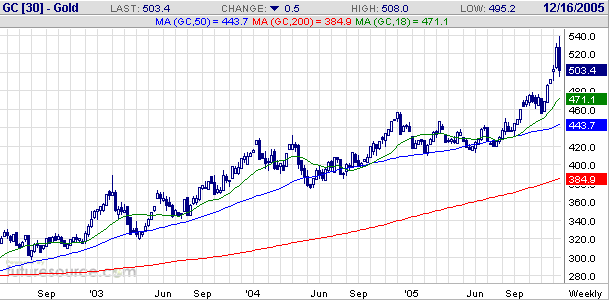
enough to close below the LOW of the preceding week. Refer to the
following weekly chart of gold futures for details. The way gold traded
over the past week suggests to us that an intermediate-term peak is now
in place and that the best we can reasonably expect over the next few
months is for Monday's intra-day high to be tested.
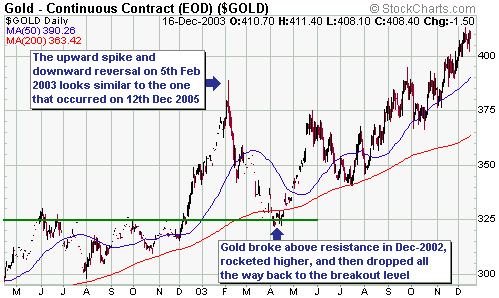
Interestingly, gold's
recent rally appears to have ended in the same way as the rally that
occurred between April of 2002 and February of 2003 -- with a large
upward spike during Asian trading. The below chart shows that the
February-2003 peak was followed by a 2-month decline that took the gold
price back to its breakout point. A similar outcome this time around
would result in the gold price falling to around $460 within the next
two months.
We expect that gold
will drop back to the mid-400s at some point over the coming 6 months,
but for a number of reasons -- including the fact that there was a lot
of public participation in the late-2002 through to early-2003 surge in
the gold price whereas the public has been largely absent during the
most recent surge -- we would be surprised if gold fell anywhere near
that far over the next two months. A more likely outcome, in our
opinion, would be a move up to 'test' the 12th December peak at some
point over the next two months followed by a multi-month decline to the
mid-400s.
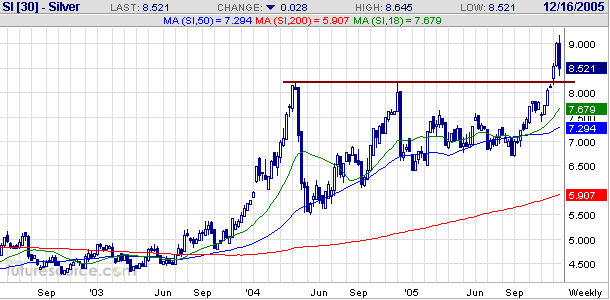
Although silver, like gold, has just experienced an 'outside down'
reversal week (refer to the weekly chart below) we continue to think it
has a good chance of making new highs during the first quarter of 2006.
There are three reasons for this. Firstly, silver has only just broken
out to the upside from a lengthy consolidation pattern. In this
respect, silver is presently in a similar position to where gold was in
early October; that is, after having broken out it appears to be
pulling back to 'test' the breakout. Secondly, in order for silver to
achieve what gold has just achieved (exceed its 1987 high) it will need
to trade above $10. (Note: over the past two months we've said that
$9-$10 was a reasonable short-term target range for silver, but that
was based on the assumption that the gold rally would end at around
$500). Thirdly, silver tends to perform better than gold when the
broad stock market is strong and we expect the stock market's rally to
extend into the first quarter of next year.
Gold Stocks
Gold Stocks versus Oil Stocks
...what
is really needed to set the scene for the next multi-year advance in
the gold sector relative to the oil sector is a major trend reversal in
the yield-spread.
The XAU/XOI ratio, a chart of which is included below, is a measure of
how gold stocks are performing relative to oil stocks. The yield-spread
-- the difference between long-term interest rates and short-term
interest rates -- is the dominant influence on this ratio's
intermediate-term trend, with the gold sector usually trending higher
relative to the oil sector when the yield-spread is widening and the
oil sector usually out-performing when the yield-spread is contracting.
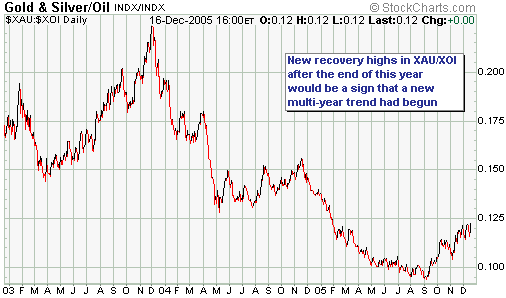
There was a major
advance in gold stocks relative to oil stocks as the yield-spread
widened between the final quarter of 2000 and the final quarter of 2003
and a major decline in gold stocks relative to oil stocks as the
yield-spread contracted between the first quarter of 2004 and August of
this year. The gold sector then began to out-perform in September of
this year, but at this stage there's scant evidence to suggest that the
September-December rebound in XAU/XOI is the start of a new major
trend. In particular, the yield-spread hasn't yet begun to widen and
there is nothing to differentiate the recent rally in XAU/XOI from the
counter-trend rebound that occurred during the second half of last year.
Our thinking is that the post-Katrina upward spike in oil stocks and
downward spike in gold stocks created THE bottom for the XAU/XOI ratio.
New recovery highs in the ratio during the first quarter of 2006 would
differentiate this year's rebound from last year's rebound and
substantiate this view, but what is really needed to set the scene for
the next multi-year advance in the gold sector relative to the oil
sector is a major trend reversal in the yield-spread. This is something
that probably won't happen until after the Fed has made its final rate
hike.
Gold Stocks and the CRB Index
A rise in the general level of commodity prices is not bullish for gold
or gold stocks. The CRB Index (a proxy for the general level of
commodity prices) and gold sometimes rise and fall together, but that's
just because some of the monetary forces that drive the gold market are
also drivers of other prices. However, it is important to keep in mind
that gold is counter-cyclical -- it tends to do best when economic
growth is weak -- whereas all other commodities are cyclical. And as
far as gold stocks are concerned, a rise in the CRB Index is downright
bearish because higher prices for commodities such as oil and copper
mean lower profit margins for gold miners. For example, a flat gold
price accompanied by 10% declines in oil and steel prices creates a
better situation for the average gold producer than a 10% rise in the
gold price accompanied by 20% rises in the prices of oil and steel.
Friday's commodity-market action was therefore bullish for gold stocks
because there was a sharp drop in the oil price in parallel with a flat
gold price.
Current Market Situation
...an
intermediate-term peak in the HUI is already in place or will be put in
place via a final upward spike over the next two weeks.
The gold stocks pretty much ignored the surge in the gold price from
$500 to $540 and also pretty much ignored gold's plunge from $540 to
$500.
As mentioned in the 12th December Weekly Update, since the beginning of
the secular bull market in gold stocks in Q4 2000 no intermediate-term
advance has lasted longer than 9 months. On this basis it is reasonable
to expect that an intermediate-term peak will be in place by the middle
of February next year (9 months from the May-2005 low). Our guess is
that an intermediate-term peak in the HUI is already in place or will
be put in place via a final upward spike over the next two weeks.
However, we continue to expect that many exploration-stage gold/silver
stocks will make new 52-week highs during the first quarter of next
year.
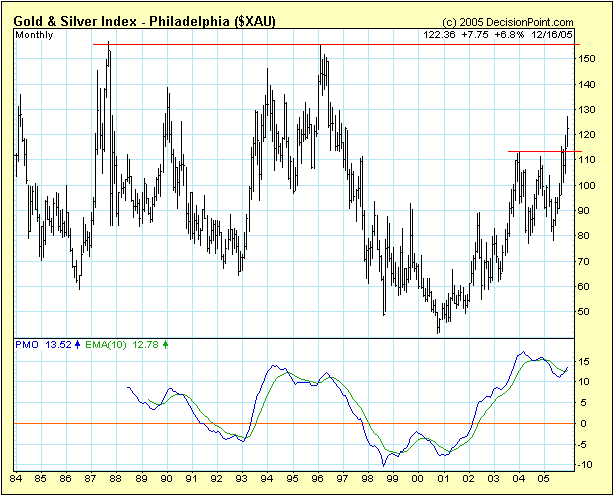
Following is a long-term monthly chart of the XAU. The bullish
crossover by the XAU's monthly Price Momentum Oscillator (PMO) shown at
the bottom of the chart suggests that the next correction will retrace
some, but not all, of the gains made since the May low. There is,
however, a more bearish alternative worth mentioning.
Notice the similarities between what happened to the XAU and the XAU's
monthly PMO from the first quarter of 1994 through to the first quarter
of 1996 and what has happened during 2004-2005. In particular, notice
that the XAU experienced a large enough correction during 1994-1995 to
turn its monthly PMO down and then experienced a huge rally that
resulted in a) the index making new highs at the beginning of 1996, and
b) a bullish crossover in the monthly PMO; all of which is remarkably
similar to what has transpired over the past two years. However,
shortly after the XAU exceeded its 1994 peak a multi-year decline got
underway.
Although we think it
is reasonable to expect the gold sector to soon embark on an
intermediate-term decline, we are confident that a repeat of 1996-2000
is NOT in store. This is because the financial world is very different
now to what it was in early 1996. The following chart shows one
of the main differences.
Currency Market Update
Over the past year the relationships between gold and some of the major
fiat currencies have taken some rather dramatic turns, but throughout
this period there has been a consistent positive correlation between
gold and the Canadian Dollar. Therefore, if gold has just made an
intermediate-term peak then there's a good chance that the C$ has just
done the same thing.
At this stage there isn't any real sign of a peak the C$'s chart
pattern (see chart below). A move below 85 would, however, suggest to
us that a substantial correction had begun.
Relative to the US$
we are short-term neutral, intermediate-term bearish and long-term
bullish on the C$. Relative to gold we are neutral on the C$ as far as
the next few months are concerned and bearish over every other
timeframe.
Update
on Stock Selections
 On
Friday, exploration-stage nickel miner Crowflight Minerals (TSXV: CML)
issued an update on its progress. The company's press release can be
read at http://biz.yahoo.com/ccn/051216/200512160302462001.html?.v=1, but here is a summary of the main points: On
Friday, exploration-stage nickel miner Crowflight Minerals (TSXV: CML)
issued an update on its progress. The company's press release can be
read at http://biz.yahoo.com/ccn/051216/200512160302462001.html?.v=1, but here is a summary of the main points:
1. The preliminary Feasibility Study just completed by CML for
the Bucko nickel deposit indicates that the project would have an
Internal Rate of Return (IRR) of 23.9% and Net Present Value (NPV) of
US$22.6M assuming a long-term nickel price of US$5.00/pound and a 10%
discount rate. At the current nickel price of around US$6.00/pound the
IRR and NPV would be 41.6% and US$53.1M, resp.
Note: CML has the right to earn a 100% stake in the Bucko project from
Falconbridge and a 50% stake in Falconbridge's surrounding exploration
claims in the Thompson Nickel Belt by spending money to explore and
develop the projects in accordance with a milestone schedule.
2. CML has re-negotiated its earn-in agreement with Falconbridge
in order to substantially reduce the amount of money it is required to
spend on exploration during 2006. This is very significant because it
should alleviate the need to issue a lot more shares over the coming
year and allow the company to focus its resources on developing a mine
at Bucko.
3. CML intends to complete a full (bankable) Feasibility Study
for the Buck project by Q2 2006 and is planning to fund this work --
$2M-$3M will be needed -- via debt.
4. The Bucko project is expected to have annual production of 12.5M pounds of nickel and to be in production by Q3 2007.
5. A significant increase in project resources is likely as a
result of the completed 2005 drilling program and the drilling planned
for the first half of 2006. This resource expansion, as well as cost
optimisation, will be incorporated into the full Feasibility Study.
6. CML expects that the full Feasibility Study will show Bucko to be profitable at a nickel price of only US$4/pound.
Based on Friday's closing price of C$0.195 CML's market cap is only
US$23M, which is extremely low given the amount of in-ground metal the
company controls and the advanced stage of the Bucko deposit. We
suspect that the company's poor share structure is one reason for its
depressed stock price (a lot of low-cost shares are in the hands of
non-committed investors). As a result, sellers come out of the woodwork
every time the stock price bounces and even the announcement of very
good news has little effect.
Our view is that if the company's management does what it says it will
do and gets Bucko into production as per the current plan without
substantially diluting the interests of existing shareholders, then the
stock price will move to a multiple of its current level. CML is not
investment-grade and is therefore not the sort of stock in which a
large position should be taken, but at the current price the
reward/risk ratio appears to be very high. It is, we think, a good
speculation.
 In
the 12th December Weekly Update we mentioned a few TSI stocks that were
potential victims of tax-loss selling and, therefore, that might bounce
once this source of selling pressure came to an end later this month.
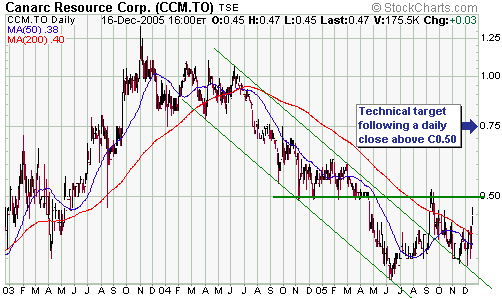
Canarc Resource (TSX: CCM) was one of the stocks mentioned, but due to
some good drilling results and a buy recommendation from another
newsletter the stock has already begun to bounce. In
the 12th December Weekly Update we mentioned a few TSI stocks that were
potential victims of tax-loss selling and, therefore, that might bounce
once this source of selling pressure came to an end later this month.
Canarc Resource (TSX: CCM) was one of the stocks mentioned, but due to
some good drilling results and a buy recommendation from another
newsletter the stock has already begun to bounce.
With reference to the following chart, C$0.75 will become a reasonable
short-term target once resistance at around C$0.50 has been overcome.
CCM probably has
greater long-term upside potential than any other stock in the TSI list
because it has two world-class gold projects in its stable, a reputable
and experienced management team, a good share structure, and a market
cap of only US$24M. It has struggled, however, because it doesn't have
the funding necessary to push ahead aggressively with either of its
main projects. Management is, quite rightly, not keen on doing a
sizeable equity financing with the stock price at such an under-valued
extreme, but without money the company can't generate the sort of news
flow that would grab the stock market's attention. The solution being
pursued by management is to bring-in a large gold mining company as a
partner on one of its two main projects.
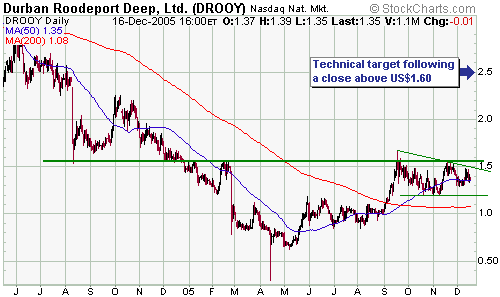
 The Sep-Dec consolidation in DRDGold (NASDAQ: DROOY) looks similar to
the Jun-Aug consolidation (see chart below). The Jun-Aug consolidation
was followed by a 50% gain in three weeks.
 Western Silver (AMEX: WTZ, TSX: WTC) has a huge silver resource and a
huge gold resource at its Penasquito project in Mexico. This makes it a
potential takeover target for a mid-tier or major mining company
looking to increase exposure to either silver or gold. Ideally, as far
as we are concerned, there won't be a takeover attempt until after the
stock price has moved much higher.
TSI subscribers interested in the WTZ story have hopefully taken
initial positions at lower levels because we suggested buying the stock
a number of times over the past three months when it was trading in the
US$8.00-$8.40 range. If not, it would still be OK to take an initial
position near the current price. This is a stock that should do
extremely well if the silver price is able to move above last week's
high. Note that a close above US$11.00 would constitute an upside
breakout and create a technical objective of around US$15.

 As of Monday 19th December the merger between Aflease (Pink Sheets:
AFLUY) and Southern Cross Resources (TSX: SXR) will be complete and
Aflease shares will no longer trade. We've therefore replaced Aflease
in the TSI Stocks List with the company created by the merger. Note
that the new company -- SXR Uranium One (TSX: SXR) -- has just
undergone a 1:5 share consolidation and should therefore begin trading
on Monday at approximately 5-times Friday's closing price (for SXR) of
C$1.20.
Chart Sources
Charts appearing in today's commentary
are courtesy of:
http://stockcharts.com/index.html
http://www.futuresource.com/
http://www.decisionpoint.com/

|

