![]()
![]()
![]()
![]()
-- Weekly Market Update for the Week Commencing 19th December 2016
Big Picture
View
Here is a summary of our big picture
view of the markets. Note that our short-term views may differ from our
big picture view.
The BULL market in US Treasury Bonds that began in the early 1980s ended in early-2015, but there will be many years of topping action in bond prices and bottoming action in bond yields before major new trends get underway. (Last update: 29 June 2015)
The stock market, as represented by the S&P500 Index, commenced a secular BEAR market during the first quarter of 2000, where "secular bear market" is defined as a long-term downward trend in valuations (P/E ratios, etc.) and gold-denominated prices. This secular trend will bottom sometime between 2018 and 2020. (Last update: 29 June 2015)
A secular BEAR market in the US Dollar began during the final quarter of 2000 and ended in July of 2008. This secular bear market will be followed by a multi-year period of range trading. (Last update: 09 February 2009)
Gold commenced a secular bull market relative to all fiat currencies, the CRB Index, bonds and most stock market indices during 1999-2001. This secular trend will peak sometime between 2018 and 2020. (Last update: 29 June 2015)
Commodities,
as represented by the CRB Index, commenced a
secular BULL market in 2001 in nominal dollar terms. The first major
upward leg in this bull market ended during the first half of 2008, but
a long-term peak won't occur until 2018-2020.
(Last
update: 29 June 2015)
Copyright
Reminder
The commentaries that appear at TSI
may not be distributed, in full or in part, without our written permission.
In particular, please note that the posting of extracts from TSI commentaries
at other web sites or providing links to TSI commentaries at other web
sites (for example, at discussion boards) without our written permission
is prohibited.
We reserve the right to immediately
terminate the subscription of any TSI subscriber who distributes the TSI
commentaries without our written permission.
Outlook Summary
|
Market |
Short-Term (1-3 month) |
Intermediate-Term (6-18 month) |
Long-Term (2-5 Year) |
| Gold | N/A |
Neutral (21-Nov-16) |
Bullish |
| US$ (Dollar Index) | N/A |
Neutral (17-Aug-16) |
Neutral (19-Sep-07) |
| US Treasury Bonds (TLT) | N/A |
Neutral (21-Nov-16) |
Bearish |
| Stock Market (DJW) | N/A |
Neutral (14-Nov-16) |
Bearish |
| Gold Stocks (HUI) | N/A |
Neutral (21-Nov-16) |
Bullish |
| Oil | N/A |
Neutral (26-Oct-15) |
Bullish |
| Industrial Metals (GYX) | N/A |
Neutral (10-Oct-16) | Bullish |
4. Long-term views are determined almost completely by fundamentals and intermediate-term views
are determined by a combination of fundamentals, sentiment and technicals.
Last week's posts at the TSI Blog
The second most overbought market since 1980
How the fundamental backdrop could turn bullish for gold
Summary of current
thinking/positioning
1) Continuing to expect that the
overall corrections/downturns for gold and the associated mining indices
will extend into Q1-2017, but anticipating an intervening rebound. The
rebound could get underway immediately, but it looks more like being
delayed until early-January.
2) Expecting that 2017 will be a
bullish year for commodities. Maintaining long-term exposure to non-gold
commodities while acknowledging that the early-2016 lows could be tested
in Q1-2017 prior to the start of the aforementioned bullish period.
3) Expecting a decline in the oil price to a January-February bottom
and positioned for this outcome via USO put options expiring in February.
In addition to being a speculation, these options have been purchased as a
hedge against short-term weakness in commodity-related equities.
4)
Thinking that government bonds have commenced a long-term bear market, but
that the US Treasury Bond is close to a short-term price bottom.
5)
Expecting a 6-12 month extension of the equity bull market and looking for
opportunities to add to general non-US equity exposure.
6) Thinking
that the Dollar Index is close to a 1-2 month top, but that it won't reach
a major top before the second quarter of 2017.
7) Maintaining a
large cash reserve in recognition of the short-term downside risk in most
equities (current cash percentage is about 35%), but putting some cash to
work in small-cap gold stocks that could rebound strongly within the next
6 weeks.
Reminder about
TSI Christmas schedule
As advised last week, there will
be no Interim Update this week and no Weekly Update next weekend. However,
we will send out a brief market update via email at the end of this week.
What is the US
Treasury up to?
A week ago we mentioned that the
US Treasury had just 'injected' $66B into the US economy and that this
monetary injection could have been partly responsible for the preceding
week's stock market surge. For ease of reference, here's what we wrote:
"The explanation [for the surprising recent stock market strength]
revolves around the US government's account at the Fed, called the US
Treasury General Account. When money goes into this account (due to tax
receipts and borrowing), the money is temporarily removed from the
economy. The money is then returned to the economy when it is spent by the
government.
As discussed in two blog posts (HERE
and
HERE) over the past few months and in the 17th October
Weekly Update, the government has been holding an unusually-large amount
of money in its Fed account and therefore causing monetary conditions to
be a little tighter than would otherwise be the case. Specifically, from
November of 2015 through to November of this year the US government
effectively removed almost $400B from the US economy.
During the
week ending Wednesday 7th December they 'returned' $66B to the economy.
It's possible that this sudden monetary injection had a positive effect on
the stock market."
During the latest week the Treasury
released another $19B of cash into the economy, bringing the two-week
total to $85B.
Before we hazard a guess as to why this happened
it's worth taking a step back and quickly reviewing the shifts over the
past year in the amount of money held by the Treasury in its account at
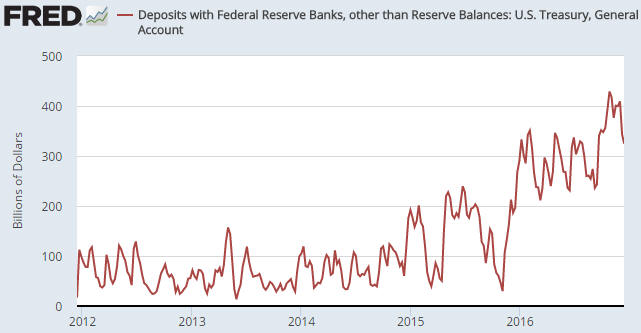
the Fed. These shifts are illustrated below.
With reference to the
following chart, notice that there was a dramatic rise in the amount of
money held in the Treasury's account during the 3-month period beginning
in early-November of last year. Over this period the government added
about $320B to its cash deposit and therefore effectively removed this
amount from the economy and the financial markets. It's not a fluke that
this withdrawal of money occurred in parallel with a steep stock-market
decline.
The amount of money held in the Treasury's account then
oscillated within a $100B range for a few months before embarking on
another large rise in mid-September. Specifically, from mid-September
through to late-October the Treasury removed about $190B from the economy
and the financial markets.
The monetary value of the account peaked
in late-October at around $430B and has since declined to $325B, with the
bulk of the decline happening over the past two weeks.
The swings in the Treasury's account are strange, for two reasons.
First, they would have tended to reduce economic activity during the
months leading up to the election and boosted economic activity after the
election. This is strange because we are taking about an incumbent
Democratic administration taking actions that could only have hurt
Clinton's chances in the Presidential election and that fueled the
financial-market celebrations in the wake of the Trump victory. Second,
the main reason for the cash build-up was supposedly to provide a buffer
that could be used during the next 'debt ceiling stand-off' (the period of
inter- and intra-party haggling that occurs when the current federal debt
limit is reached or expires). With the next debt ceiling stand-off due to
begin by March-2017, this would seem to be an inopportune time to be
reducing the cash buffer.
The explanation for why the Treasury
added about 400 hundred billion dollars of cash to its Fed deposit -- and
therefore removed the same amount from the economy -- between November of
last year and October of this year appears to be relatively
straightforward. It was a response to a recommendation by the
Treasury Borrowing Advisory Committee (TBAC) to accumulate a $500B
emergency cash reserve. That establishing this reserve would dampen
economic activity during the 12 months leading up to the Presidential
election probably wasn't considered important, because it was probably
believed that a Clinton victory was 'a lock'.
The explanation for
why the Treasury is now disgorging cash and giving both the stock market
and the economy a TEMPORARY boost is less straightforward and relies on
guesswork. Our guess is that with a Republican moving into the White House
and with the Republican Party in control of both legislative chambers (the
Senate and the House of Representatives), the Obama Administration has
decided to spend whatever money it can before it departs. Having very
little cash in reserve prior to an imminent 'debt ceiling standoff' will
potentially create a substantial problem for the Trump Administration to
deal with. Also, the superficial impression will be created that the
Democrats left the economy in good shape.
The probability that our
guess is correct will increase if the Treasury's General Account continues
to be drawn down prior to Trump's 20th January Inauguration.
Lastly, we emphasised the word "temporary" above because injecting money
into an economy can never cause real progress and because we are talking
about a fixed amount of money that will soon be depleted if the injections
continue.
Commodities
Copper
The copper price made a double top in the $2.70s during November and has
pulled back to the mid-$2.50s. A normal correction could take the price as
far down as the low-$2.30s to 'test' the early-November upside breakout.
Despite no longer being 'overbought' in momentum terms there is still
significant short-term downside risk in the copper market. The risk stems
in part from the recent weakness in the gold price, in that gold could be
leading other metals to the downside just as it led to the upside a year
ago. It also stems from the fact that the speculative net-long position in
Comex copper futures hit an all-time high last week.
With
short-term speculators in copper futures now rampantly bullish about
copper's prospects there could soon be another surge to a new 12-month
high in the copper price, but this would only increase the risk. The
problem is that if/when it starts to look like copper's upward trend is
over, a lot of long-positioned speculators are bound to rush for the exit
at the same time.
Oil
The oil price broke
above its June and October highs early last week in response to the
re-cycling of the same old (irrelevant) OPEC news. It then reversed
course. This price action has altered the chart pattern and has possibly
defined a new price channel.

The breakout that happened early last week hasn't yet been negated and
suggests the potential for the oil price to rise to the low-$60s before
the start of the next tradable decline. However, if the channel we've
drawn on the above chart is valid then a) the entire rally from the
early-August low is probably a counter-trend move within an
intermediate-term correction/consolidation that began in June, and b) a
decline to below the August low has probably just begun.
The
divergence between the Canadian Dollar (C$) and the oil price was
magnified by last week's market action. As illustrated below, the C$ made
a clear-cut downward reversal from its channel top and its 200-day MA
during the first half of last week.
The divergence will most likely
be closed by the oil price making a catch-up move to the downside,
although the possibility that it will be closed by the C$ making a
catch-up move to the upside cannot be ruled out. In the financial markets
there are no guarantees, only probabilities.
The Stock Market
The US
The NASDAQ100 Index (NDX) broke above resistance near 4900 last week and
in doing so removed a short-term bearish non-confirmation. The breakout
projects a rise to at least 5100 over the weeks ahead.
In the TSI List there is a bearish NDX speculation in the form of QID
(a leveraged bear fund) $30 call options expiring in January. The same
options are in our own account*. There is still a chance that something
will happen to inject significant value into these options prior to their
20th January expiry date (a quick decline of about 15% would do it), but
the chance is now so small that we have assumed that they will expire
worthless and written them down to zero.
We expect that there will
be meaningful (8%-12%) declines in the senior US stock indices from
whatever highs are in place by early-January, but at this stage we don't
know if it will be appropriate to attempt a new short-term bearish trade
given that the market's overall upward trend looks set to extend into the
second half of next year.
Before leaving the US stock market we
want to point out that the Dow Jones Utility Average (UTIL) has broken
upward from the downward-sloping channel that began to develop at this
index's early-July peak. The utility sector is primarily a dividend play
that is influenced by the bond market and/or expectations regarding future
bond yields, so UTIL's up-turn is consistent with our view that the T-Bond
will soon begin to rebound.
*It's worth reiterating that while we will
generally have positions in most (not all) of the stocks/warrants/options
included in the TSI List, the TSI Stocks List is not a reflection of our
portfolio and neither is it supposed to be a recommended or model
portfolio. It is a list of speculating/investing ideas that TSI
subscribers can draw from.
Europe
Prior to the surge in the US money-supply growth rate over the past two
months, the main thing in the US stock market's favour was the major
basing patterns evident in European and Japanese stock indices. For
example, since July it has looked like the EURO STOXX 50 Index (STOX5E)
completed a double bottom during the first half of this year.
The
basing-pattern interpretation of the STOX5E's 2016 performance was
recently confirmed via a decisive break above resistance at 3150 (the top
of the base). There could be a pullback to around 3150 to 'test' the
breakout within the next two months, but the price pattern suggests that
STOX5E will challenge its 2015 high during 2017.
This week's
significant US economic events
[Notes:
1) The most important events
(to the markets) are shown
in bold. 2) A list of global economic events can be found
HERE]
| Date | Description |
| Monday December 19 | No important events scheduled |
| Tuesday December 20 | No important events scheduled |
| Wednesday December 21 | Existing Home Sales |
| Thursday December 22 |
Durable Goods Orders Q3 GDP (2nd revision) Personal Income and Spending Leading Economic Indicators |
| Friday December 23 | New Home Sales |
Gold and the Dollar