|
-- Weekly Market Update for the Week Commencing 20th June 2011
Big Picture
View
Here is a summary of our big picture
view of the markets. Note that our short-term views may differ from our
big picture view.
In nominal dollar terms, the BULL market in US Treasury Bonds
that began in the early 1980s ended in December of 2008. In real (gold)
terms, bonds commenced a secular BEAR market in 2001 that will continue
until 2014-2020. (Last
update: 4 April 2011)
The stock market, as represented by the S&P500 Index, commenced
a secular BEAR market during the first quarter of 2000, where "secular
bear market" is defined as a long-term downward trend in valuations
(P/E ratios, etc.) and gold-denominated prices. This secular trend will bottom sometime between 2014 and 2020. (Last update: 22 October 2007)
A secular BEAR market in the Dollar
began during the final quarter of 2000 and ended in July of 2008. This
secular bear market will be followed by a multi-year period of range
trading. (Last
update: 09 February 2009)
Gold commenced a
secular bull market relative to all fiat currencies, the CRB Index,
bonds and most stock market indices during 1999-2001. This secular trend will peak sometime between 2014 and 2020. (Last update: 22 October 2007)
Commodities,
as represented by the Continuous Commodity Index (CCI), commenced a
secular BULL market in 2001 in nominal dollar terms. The first major
upward leg in this bull market ended during the first half of 2008, but
a long-term peak won't occur until 2014-2020. In real (gold) terms,
commodities commenced a secular BEAR market in 2001 that will continue
until 2014-2020. (Last
update: 09 February 2009)
Copyright
Reminder
The commentaries that appear at TSI
may not be distributed, in full or in part, without our written permission.
In particular, please note that the posting of extracts from TSI commentaries
at other web sites or providing links to TSI commentaries at other web
sites (for example, at discussion boards) without our written permission
is prohibited.
We reserve the right to immediately
terminate the subscription of any TSI subscriber who distributes the TSI
commentaries without our written permission.
Outlook Summary
Market
|
Short-Term
(0-3 month)
|
Intermediate-Term
(3-12 month)
|
Long-Term
(1-5 Year)
|
Gold
|
Neutral
(19-Apr-11)
|
Neutral
(24-Jan-11)
|
Bullish
|
US$ (Dollar Index)
|
Neutral
(07-Mar-11)
| Bullish
(02-May-11)
|
Neutral
(19-Sep-07)
|
Bonds (US T-Bond)
|
Neutral
(20-Sep-10)
|
Bearish
(21-Mar-11)
|
Bearish
|
Stock Market (S&P500)
|
Neutral
(13-Jun-11)
|
Bearish
(11-Oct-10)
|
Bearish
|
Gold Stocks (HUI)
|
Neutral
(24-Apr-11)
|
Bullish
(23-Jun-10)
|
Bullish
|
| Oil | Neutral
(31-Jan-11)
| Neutral
(31-Jan-11)
| Bullish
|
Industrial Metals (GYX)
| Bearish
(03-Jan-11)
| Bearish
(25-May-09)
| Neutral
(11-Jan-10)
|
Notes:
1. In those cases where we have been able to identify the commentary in
which the most recent outlook change occurred we've put the date of the
commentary below the current outlook.
2. "Neutral", in the above table, means that we either don't have a
firm opinion or that we think risk and reward are roughly in balance with respect to the timeframe in question.
3. Long-term views are determined almost completely by fundamentals,
intermediate-term views by giving an approximately equal weighting to
fundamental and technical factors, and short-term views almost
completely by technicals.
Bank Reserves and Money Supply
The relationship between bank
reserves and money supply is widely misunderstood. Some analysts
believe that the Fed dictates the US money supply by controlling the
reserves of the US banking system, but, as we'll explain, this is only
partly correct. Other analysts believe that if commercial banks are
collectively unable or unwilling to lend then the Fed won't be able to
increase the economy-wide money supply, regardless of how much it
increases bank reserves. As we'll explain, this view is completely
wrong.
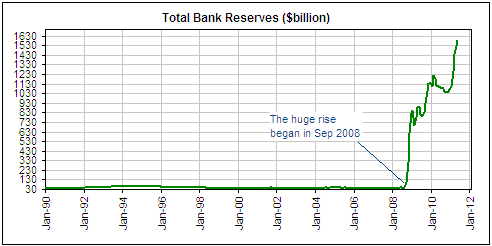
With regard to the relationship between US bank reserves and money
supply, the period since 1990 can logically be split in two:
September-2008 onwards and everything prior to September-2008. From the
early 1990s up to and including August of 2008, changes in bank
reserves had almost no influence on the money supply. We say this
because there were large oscillations in the money-supply growth rate
and a massive net increase in the economy-wide money supply during this
period, and yet the total amount of reserves in the banking system
barely moved (bank reserves were about $45B in August-1991, August
1998, and August 2008). However, from September-2008 onwards the change
in bank reserves has been so important as to totally swamp all other
influences on the money supply. The sudden shift in September-2008 is
illustrated below.
We have a three-part
explanation for what has transpired on the US monetary front since
1990. First, regulatory changes implemented by the Fed during the
early-1990s effectively broke the link between bank reserves and bank
lending. From then on the banks could use the practice known as
"sweeping" to effectively enable any amount of bank reserves to support
any amount of deposit money. Second, during the booms of the 1990s and
2000s there was huge private-sector demand for loans, which the
commercial banks were willing and able to meet despite the fact that
their reserves hadn't increased (due to the first part of our
three-part explanation, reserves were no longer a limiting factor). The
result was a large increase in the money supply driven by commercial
bank lending. Third, whether it was due to the widespread impairment of
bank balance sheets or a major trend change in private-sector loan
demand or a combination of the two (our view is that it was a
combination of the two), the banking system's collective loan book
began to contract in late-2008. This would/should have resulted in
deflation, except that the Fed stepped in and began creating new money
at a rapid rate. Due to the way the Fed went about its money pumping,
bank reserves and bank deposits were simultaneously boosted.
In summary, almost all the money created in the US from the early-1990s
through to August of 2008 was created by the private banks,
independently of changes in bank reserves. This, we suspect, is why
some analysts concluded that the US would necessarily experience
deflation once the private banks became unwilling to expand their loan
books or private-sector borrowers became 'tapped out'. However, the
world changed in September of 2008. From that time forward, the Fed has
been solely responsible for net additions to the US money supply.
A secular trend change in the credit market
We
disagree with the main conclusion of the analysts who are forecasting
deflation for the US economy, but our assessment of the
inflation/deflation situation also differs from that of most analysts
who are forecasting more inflation.
As far as we can tell, most analysts who are convinced that a lot more
inflation lies in store for the US economy believe that it's just a
matter of time before the long-term upward trends in commercial bank
lending and private sector indebtedness resume. Our view, however, is
that the aforementioned long-term trends ended in 2008 and that future
inflation will rely on the Fed's creation of new money.
Growth in the federal government's debt burden will probably ensure
that the economy-wide volume of debt continues to increase, but in any
case the Fed has proven beyond any doubt that it is capable of
expanding the supply of money at a fast pace regardless of what is
happening on the debt front. The fact is that while almost all new
money is borrowed into existence during normal times (normal, that is,
for the type of monetary system we have today), the Fed is able to
create new money independently of demand for loans. It can do this
because it is capable of monetising ANYTHING.
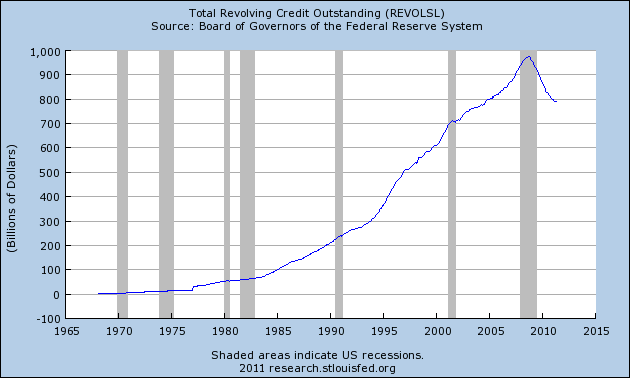
Evidence of a change in the US credit market's long-term trend is
provided by the following chart of revolving credit. The post-2008
downturn does not look like an interruption to a long-term upward
trend; it looks like the start of a new long-term downward trend.
Oil Update
Last
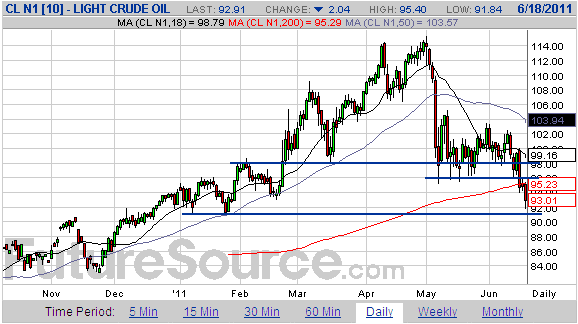
week's price action removes any remaining doubt that an
intermediate-term peak was put in place in the oil market at the
beginning of May. This, however, doesn't imply that the market has a
lot of additional downside potential. Also of consideration is that
while the attention of the financial world has drifted away from
political instability in the Middle East and North Africa (MENA), the
situation in that part of the world does not appear to have stabilised. It's likely just a matter of a few months until the next MENA-related oil supply scare.
The following daily chart shows that the July crude futures contract
has support just below Friday's low. If this support gives way then a
drop to $80-$85 is probably on the cards.
We expect to see plenty of evidence of a weakening global economy
during the second half of this year and will not be surprised if the
oil price drops to around $80/barrel in response, but given the
geopolitical backdrop we will be surprised if drops much lower than
that.
The coming crash in US municipal debt?
Late last year,
banking analyst Meredith Whitney 'created a storm' by forecasting that
there would be hundreds of billions of dollars of defaults in the US
municipal bond market during 2011. Is there a chance that she could be
right?
In a word: no. During the year to date there have been less than $1B of
"muni" defaults, and the way things are going it is very unlikely that
there will even be $10B of defaults this year (note that the worst year
on record was 2008, when "muni" defaults totaled about $8B). This means
that Whitney's default prediction is almost certainly going to be wrong
by orders of magnitude.
At least, her timing is going to be wrong. It is possible that there
will ultimately be hundreds of billions of dollars of defaults in
"munis" spread over several years. We don't have a strong opinion on
that, as we are not experts on the US municipal bond market.
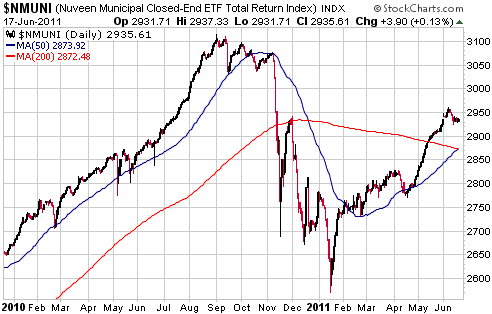
In any case, the potential exists for large declines in municipal bond
funds, as represented on the following chart by the Nuveen Municipal
Closed-End ETF Index (NMUNI), almost regardless of how many actual
defaults occur. The reason is that fear of default will probably
mushroom once it becomes obvious to all that the US economy has moved
back into recession. For example, fear of default, rather than actual
default, was the main reason for the 40% peak-to-trough decline in
NMUNI during 2007-2008. Also, fear of default was solely responsible
for the 16% decline in NMUNI that occurred between September of 2010
and January of 2011.
Quotes of the week
"President
Obama said he's not concerned about a double-dip recession. He's more
concerned the recovery we're in is not creating enough jobs. Do you
know what you call a recovery that isn't creating enough jobs? A
recession."
-- Jay Leno
"You have to be prepared
and disciplined in order to trade right. Investors respond to
volatility in predictable, but strange, ways. When the market goes up
30% for no reason other than volatility, investors tend to become
aggressive and want to buy more. By contrast, they panic and sell when
the market goes down 30%. Most investors respond to volatility by
selling low and buying high, panicking the wrong way in both
directions."
-- Rick Rule (from the interview posted HERE)
The Stock
Market
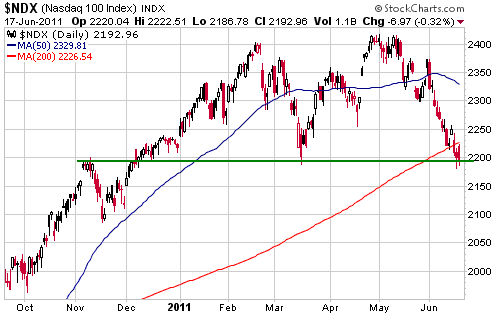
The following daily chart
shows that the NASDAQ100 Index (NDX) declined a little further last
week, but still hasn't broken below support defined by its March low.
We'd prefer that it broke below this support before commencing a
multi-week rebound, but the overall market is certainly 'oversold'
enough to enable such a rebound to begin immediately. In particular, we
note that the 10-day moving average of the equity put/call ratio ended
last Friday at 0.90, which is close to the highs reached during the
2008 market crash. This is extraordinary considering that the senior
stock indices have pulled back by less than 10% from their early-May
highs.
Sentiment is now a
definitive short-term positive, but it is not a positive beyond the
short-term. In fact, that sentiment has become so pessimistic in
response to such a small decline reveals a market with a strong
tendency to panic at the first sign of trouble. This adds to the
downside risk.
On an intermediate-term basis, the ONLY positive we can come up with is
the continuing strong growth in the money supply. The supportive
monetary backdrop means that a 2008 repeat is almost certainly not on
the cards, but sizeable intermediate-term declines can occur in
parallel with strong growth in the money supply.
The last point we'll make before leaving the stock market is that the
price action of the past few weeks has constituted a marked divergence
from the Presidential Cycle Model. According to this Model, the US
stock market is supposed to be strong during the first three weeks of
June in the third year of the cycle.
When a market is weak during a seasonally strong period, it should be taken as a 'warning shot across the bow'.
This week's
important US economic events
| Date |
Description |
Monday Jun 20
| No important events scheduled
| Tuesday Jun 21
| Existing Home Sales
| | Wednesday Jun 22
| FOMC Announcement
| | Thursday Jun 23
| New Home Sales
| | Friday Jun 24
| Durable Goods orders
Q1 GDP
|
Gold and
the Dollar
Gold and Silver
Silver's decline: a normal reaction to the preceding advance
When a major commodity market experiences a parabolic rise of the
magnitude experienced by the silver market during the final four months
of last year and the first four months of this year, the result is
always a crash. Students of financial market history know how such
episodes inevitably end, but they generally can't pinpoint the timing
of the ending.
When the inevitable happens there is never a good reason to look for
explanations that involve nefarious antics, but this hasn't prevented
Eric Sprott from doing exactly that. As discussed in the article posted
HERE,
the Canadian billionaire claims that market manipulation caused the
early-May crash in the silver price. Naturally, he offers no evidence
to support his claim.
In the above-linked article, Mr. Sprott also claims that the
introduction of "QE3" would quickly send silver back to $50/oz. This is
probably a correct assessment, but it is not reasonable to expect that
"QE3" will be introduced within the next few months given that a) "QE2"
has been an obvious failure and b) the Fed would justifiably be
attacked from almost all directions if it instituted a new round of
aggressive money pumping in the near future. There will probably have
to be a lot more evidence of economic weakness and an intervening
deflation scare before "QE3" -- or something similar under a different
name -- becomes politically feasible, which could mean that silver
visits the low-$20s before resuming its long-term upward trend.
Current Market Situation
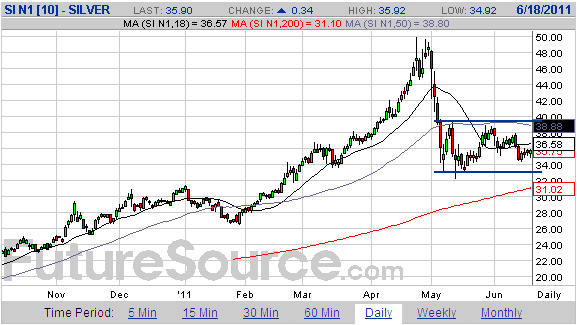
Not much happened in the gold and silver markets last week. For
example, the following daily chart shows that the July silver futures
contract lost about $1.50 last Monday and then spent the rest of the
week recouping these losses. The net effect was that it went nowhere
over the course of the week.
July silver has resistance just below $40 and support at around $33. We
suspect that a break below $33 would be quickly followed by a decline
to $28 or lower.
If gold and silver
futures can continue to hold above support ($1520 for gold, $33 for
silver) this week then the risk of a sharp near-term decline will
subside. As mentioned in the last two TSI commentaries, the most likely
alternative to a sharp near-term decline is several more weeks of
'choppy' range trading. We suspect that this extended period of range
trading would be followed by declines to below the May lows for both
gold and silver.
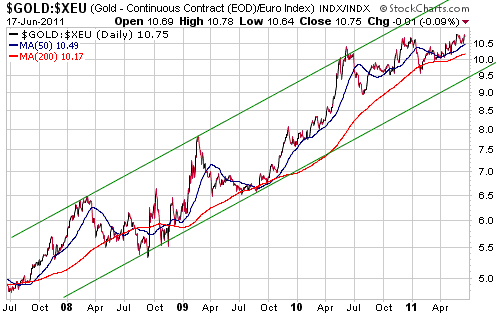
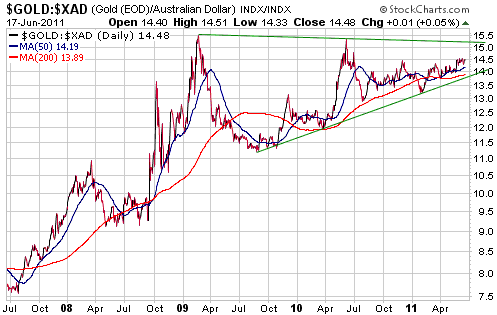
Displayed below are charts showing gold in euro terms (gold/euro) and gold in A$ terms (gold/A$).
Gold/euro is testing its all-time high and is roughly in the middle of
its long-term upward-sloping channel. We are bullish on gold/euro over
all timeframes, as we expect that any decline in the US$ gold price
over the months ahead will at least be matched by a decline in the
EUR/USD exchange rate.
For a similar reason, we are also bullish on gold/A$ over all timeframes.
Gold Stocks
Unlike the HUI, the XAU failed to make a new high in April of this
year. Consequently, the XAU's chart pattern makes it clearer that the
gold sector of the stock market has been in correction mode since early
December of last year.
The following daily chart shows that the XAU made a new low for the
year late last week, so at this stage there is obviously no evidence
that the intermediate-term correction is complete.
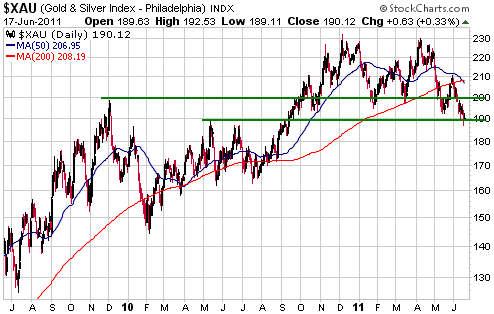
Even if the overall
correction is not complete, at the end of last week the gold-stock
indices were at important support levels and were sufficiently
'oversold' in both nominal currency terms and gold terms to enable a
multi-week rebound. There's a good chance that such a rebound will
begin within the next seven trading days.
In our opinion, investors and longer-term speculators should be
gradually averaging into high-potential gold and silver stocks.
However, the idea of 'going long' for a short-term trade doesn't appeal
to us at this time. The potential short-term reward is simply not
attractive enough relative to the downside risk.
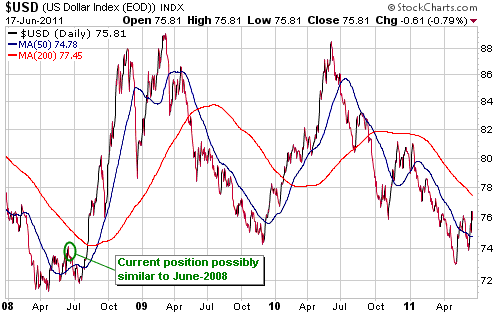
Currency Market Update
The Dollar Index moved to a new 2-month high last week before pulling
back on Friday. As noted on the following daily chart, this is similar
to what happened in June of 2008.
If the dollar's current bottoming process evolves in similar fashion to
its 2008 bottoming process then we will see a pullback to around 74
over the next few weeks. That being said, there is no assurance that
today's market will continue to track the 2008 pattern.
One alternative to the 2008 pattern is that the bottoming process is
already complete. This would be signaled by consecutive daily closes
above the 200-day moving average. Another alternative is that the
Dollar Index's early-May low was only the short-term variety. This, we
think, has the lowest probability of the three possibilities and would
be signaled by consecutive daily closes below the May low.
Update
on Stock Selections
(Notes: 1) To review the complete list of current TSI stock selections, logon at http://www.speculative-investor.com/new/market_logon.asp
and then click on "Stock Selections" in the menu. When at the Stock
Selections page, click on a stock's symbol to bring-up an archive of
our comments on the stock in question. 2) The Small Stock Watch List is
located at http://www.speculative-investor.com/new/smallstockwatch.html)
 Clifton Star Resources (TSXV: CFO). Shares: 36M issued, 40M fully diluted. Recent price: C$2.13 Clifton Star Resources (TSXV: CFO). Shares: 36M issued, 40M fully diluted. Recent price: C$2.13
In last week's Interim Update we said that the questions surrounding
OSK's continuing involvement in the Duparquet project joint venture
(JV) with CFO would be resolved, one way or the other, within the next
four weeks. As it turned out, CFO's management brought the situation to
a head by halting the stock last Thursday pending clarification of
OSK's intentions. This essentially forced OSK's hand. The result: it
was announced on Friday that OSK had terminated the JV agreement, thus
removing the uncertainty that has been swirling around CFO.
CFO's stock price dropped on heavy volume following this news, but the
magnitude of Friday's reaction was clearly mitigated by the weakness
that had already occurred in anticipation of the news. Also, Friday's
heavy volume and rebound from an intra-day low of C$1.86 indicates that
the panicked liquidation of some traders was largely offset by the
accumulation of others.
OSK's decision to exit the project is a short-term negative and a
longer-term positive for CFO. The short-term negative is the damage to
market sentiment stemming from the event. This damage is now fully
reflected in the stock price. The longer-term positive is that CFO
picks up a few million ounces of gold in Quebec at a cost of $10-$15
per ounce, by virtue of the fact that it ends up with 100% of the asset
but has to fund future exploration.
Also of note is that even though OSK has decided to exit the JV, it is
still obligated to provide CFO (at CFO's option) with up to $22.5M of
unsecured debt financing on favourable terms. With this financing
commitment and about $15M in the bank, CFO is well positioned to
advance the project on its own.
Whether it will advance the project on its own or seek a new JV partner
is unknown at this time. Our preference would be for CFO to 'go it
alone' unless offered an attractive JV deal by Agnico Eagle.
With regard to CFO's valuation, here are our 'back of the envelope'
calculations (the only type of value calculation feasible for
exploration-stage miners):
- Based on the current 5.2M-oz resource and drilling results,
there is almost no doubt that CFO will establish a total resource of at
least 7M ounces for the Duparquet project by this time next year. A
7M-oz resource in Quebec would typically be valued by the market at
more than $100/oz, but due to the deposit's complexity we will assume
that it attracts a valuation of only $50/oz. Assuming an increase in
the share count to 45M and allowing $50M for payments to the original
project vendors, we arrive at a valuation of $6.70 per CFO share. This,
we think, is the moderately pessimistic case.
- Allowing for an increase in the resource to 8M ounces and
assigning $75 to each of these ounces results in a valuation of $12.20
per CFO share. This could be classified as the moderately optimistic
case.
When a stock plunges in response to news, the stock price will often
rebound and then decline to test or breach the news-related low. A test
of last Friday's low is therefore a possibility, but we think it's more
likely that the bottom is already in place.
 Candidates for new buying Candidates for new buying
Due to the market action of the past several weeks, every gold and
silver stock that we follow at TSI is now at a level where new buying
could be appropriate. However, in the current financial-market
environment it makes sense for most new buying to be directed towards
relatively low-risk situations. Along these lines, two TSI stocks that
spring to mind are Northgate Minerals (NXG) and Orvana Minerals (TSX:
ORV).
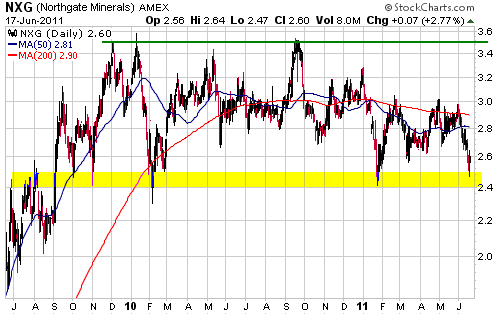
NXG should generate significant cash flow from its Australian
operations during the second half of this year and will be bringing its
Canada-based Young-Davidson project into production next year. It is
now testing support near the bottom of its 20-month price range, which
is a reasonable area for new buying.
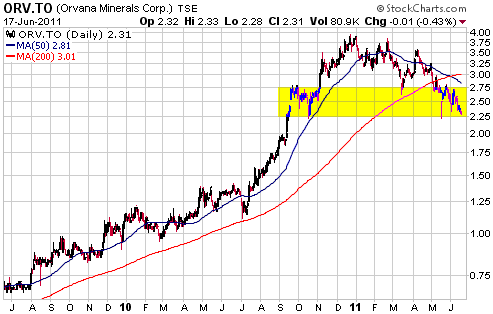
ORV is in the process
of commissioning a 100K-oz/yr mine in Spain and a 20K-oz/yr mine in
Bolivia. Unforeseen problems often emerge during the first few months
of a mine's life, but in ORV's case the risk is mitigated by
management's track record of successfully bringing new mines into
production. ORV ended last week at support.
 Energy Fuels Inc. (TSX: EFR). Shares: 124M issued, 142M fully diluted. Recent price: C$0.34 Energy Fuels Inc. (TSX: EFR). Shares: 124M issued, 142M fully diluted. Recent price: C$0.34
Due to the size, location and uncommonly-high grade of its deposit,
Hathor Exploration (TSX: HAT) provides the lowest-risk exposure to
in-ground uranium within the world of junior uranium stocks. However,
HAT's price has moved back to where it was prior to the Fukushima
disaster, so it is now expensive relative to many other junior uranium
stocks.
At current prices, the best value that we know of within the ranks of
junior uranium miners is offered by EFR. Due partly to negative
sentiment associated with a legal challenge to the license for its
proposed Pinon Ridge uranium mill, but mostly due to a general decline
in demand for uranium-mining shares, EFR has continued to trend
downward over the past two months and has now given back almost all of
the gains made during the powerful 7-month rally that culminated in
February.
With the exception of the aforementioned legal issue, the EFR story is
progressing well on the ground. The stock should eventually reflect
this progress, but a lot of patience is obviously required.
If you currently don't own any EFR shares then it would be reasonable
to take an initial position near Friday's closing price of C$0.34.
Chart Sources
Charts appearing in today's commentary
are courtesy of:
http://stockcharts.com/index.html
http://www.futuresource.com/

|

