


-- Weekly Market Update for the Week Commencing 20th June 2016
Big Picture
View
Here is a summary of our big picture
view of the markets. Note that our short-term views may differ from our
big picture view.
The BULL market in US Treasury Bonds
that began in the early 1980s ended in early-2015, but there will be many years
of topping action in bond prices and bottoming action in bond yields before
major new trends get underway. (Last update: 29 June 2015)
The stock market, as represented by the S&P500 Index,
commenced
a secular BEAR market during the first quarter of 2000, where "secular
bear market" is defined as a long-term downward trend in valuations
(P/E ratios, etc.) and gold-denominated prices. This secular trend will bottom sometime between 2018 and 2020.
(Last update: 29 June 2015)
A secular BEAR market in the
US
Dollar
began during the final quarter of 2000 and ended in July of 2008. This
secular bear market will be followed by a multi-year period of range
trading.
(Last
update: 09 February 2009)
Gold commenced a
secular bull market relative to all fiat currencies, the CRB Index,
bonds and most stock market indices during 1999-2001.
This secular trend will peak sometime between 2018 and 2020.
(Last update: 29 June 2015)
Commodities,
as represented by the CRB Index, commenced a
secular BULL market in 2001 in nominal dollar terms. The first major
upward leg in this bull market ended during the first half of 2008, but
a long-term peak won't occur until 2018-2020.
(Last
update: 29 June 2015)
Copyright
Reminder
The commentaries that appear at TSI
may not be distributed, in full or in part, without our written permission.
In particular, please note that the posting of extracts from TSI commentaries
at other web sites or providing links to TSI commentaries at other web
sites (for example, at discussion boards) without our written permission
is prohibited.
We reserve the right to immediately
terminate the subscription of any TSI subscriber who distributes the TSI
commentaries without our written permission.
Outlook Summary
Market
|
Short-Term
(1-3 month)
|
Intermediate-Term
(6-18 month)
|
Long-Term
(2-5 Year)
|
|
Gold
|
N/A |
Bullish
(26-Mar-12) |
Bullish
|
|
US$ (Dollar Index)
|
N/A |
Bullish
(29-Feb-16) |
Neutral
(19-Sep-07) |
|
US Treasury Bonds (TLT)
|
N/A |
Bearish
(19-Oct-15)
|
Bearish |
|
Stock Market
(DJW)
|
N/A |
Bearish
(30-Dec-15) |
Bearish
|
|
Gold Stocks
(HUI)
|
N/A |
Neutral
(04-May-16) |
Bullish
|
|
Oil |
N/A |
Neutral
(26-Oct-15) |
Bullish
|
|
Industrial Metals
(GYX)
|
N/A |
Neutral
(09-Nov-15) |
Bullish
(28-Apr-14) |
Notes:
1. Our short-term expectations are discussed in the commentaries, but except in
special circumstances we won't attempt to assign a "bullish", "bearish" or
"neutral" label to these expectations.
2. The date shown below the current outlook is when the most recent outlook change occurred.
3. "Neutral" means that we think risk and reward are roughly in balance with respect to the timeframe in question.
4. Long-term views are determined almost completely by fundamentals and intermediate-term views
are determined by a combination of fundamentals, sentiment and technicals.
Last week's posts at the TSI Blog
Four charts that invalidate the gold-price suppression story
I don't love
charts!
Reversals
Summary of current
thinking/positioning
1) Concerned about short-term
downside risk in gold, silver and the associated mining stocks, but
comfortable maintaining substantial 'core' exposure in anticipation of
large additional gains over the next two years. Will possibly buy some GDX
calls for a short-term trade if the gold-mining indices close above the
tops of their recent ranges.
2) Maintaining relatively small
exposure to non-gold commodity-related stocks and positioned for
short-term weakness via XME put options, but getting more bullish about
intermediate-term prospects.
3) Thinking that the US stock market
has commenced a significant multi-week decline, but support levels must
soon be breached to validate this view. Betting (via QID call options) on
additional short-term weakness.
4) Thinking that a 20%+ decline in
the oil price has begun, but, as is the case with the US stock indices,
support levels must soon be breached to validate this view.
5)
Speculating on a British Pound rally as outlined in TSI commentaries. This
trade will be closed-out within the next two weeks if Britain votes to
stay in the EU (as currently appears likely).
6) Thinking that the
days around the 23rd June "Brexit" vote could be a pivot point for the
currency, gold and bond markets (potentially a top for gold, the Yen and
the 'safe haven' government bonds).
7) Maintaining an
unusually-large cash reserve of around 50% in recognition of the downside
risk in almost all equities.
Four reasons to
be bearish on the T-Bond
We took a loss on a bearish
T-Bond speculation last month. It was our first attempt in several years
to bet against the government bond market and we obviously got the timing
wrong. Having just been bitten, perhaps we should now be shy about making
a bet against this market. However, it is important to judge each
opportunity on its merits and to not be unduly swayed by previous
successes or failures. When we consider the merits of the T-Bond market we
come up with good reasons to believe that an important top is nearby and
that the coming decline could be worth trading.
The opportunity to
enter a bearish T-Bond speculation -- possibly via TBT or TBT call options
-- is better now than it was following the early-February price spike in
this market. Here are the four reasons:
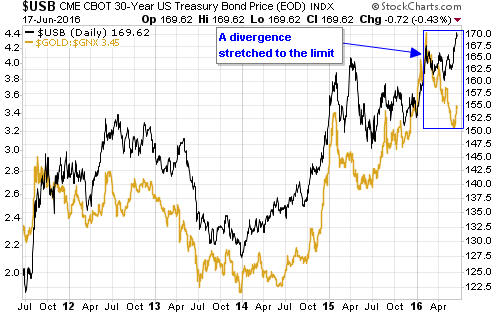
1) The relationship between
bonds, gold and commodities
For more than two decades there has
been a consistent positive correlation between the gold/commodity ratio
and the T-Bond price, which was discussed in some detail in the 23rd May
Weekly Update under the heading "An age-old relationship between interest
rates and prices". An aspect of this relationship is that 12-month (or
longer) tops for the gold/commodity ratio and the T-Bond occur within a
few months of each other.
At this stage we can't be sure that a
12-month or longer top is in place for the gold/commodity ratio, but the
ratio has been trending downward for about four months so what we now have
is a divergence that, based on the historical record, is stretched to the
limit. Refer to the following chart for details. This divergence could be
removed via a sudden increase in risk aversion that quickly drives the
gold/commodity ratio to a new high or via a sizable decline in the T-Bond.
It therefore seems that something dramatic will have to happen to prevent
the T-Bond from falling into line with the gold/commodity ratio.
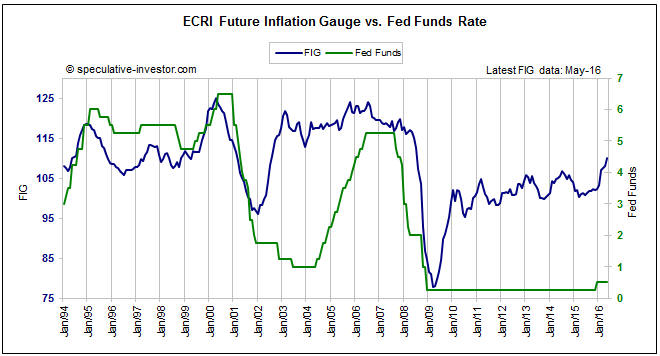
2) Increasing "price inflation"
Despite all the handwringing
about the threat of deflation (wouldn't it be terrible if money gained
purchasing power over time), the following chart shows that ECRI's Future
Inflation Gauge (FIG) began an upward trend more than a year ago and began
to accelerate upward early this year. Furthermore, the FIG hit a 7-year
high in May. This indicates that the CPI is likely to have an upward bias
over the next 12 months, which should put downward pressure on bond
prices.
3) Pushback against negative interest rate policy NIRP
The main
factor in the T-Bond's favour is the proliferation of negative bond yields
in Europe and Japan. Compared to the yields available on supposedly
low-risk government bonds elsewhere, the yields currently offered by US
Treasury notes and bonds look positively lucrative. However, there is now
considerable pushback against NIRP due to the costs being incurred by
banks and the impossibility of pension funds achieving their required
returns on investment. Therefore, this trend is probably close to
reversing. When it does, European government bond prices will tank.
4) Sentiment
While our first three reasons to be bearish could
have short-term importance, they are more intermediate-term than
short-term in nature. Sentiment is the main reason to be short-term
bearish.
Due to the upcoming Brexit vote and other perceived risks,
US government bonds have recently become very popular with short-term
speculators. This is evidenced by sentiment surveys and the Commitments of
Traders (COT) data. According to the latter, speculators are now the most
optimistic they've been on long-dated US government bonds (30-year T-Bonds
and 10-year T-Notes) since December of 2012.
The biggest current threat to a bearish T-Bond speculation is the
possibility of an increasingly-urgent flight to safety over the next few
weeks. The risk is that even if our view is correct in terms of time, the
combination of the Brexit vote and stock-market weakness could bring about
a trend-ending blow-off to the upside in 'safe haven' investments.
However, this risk could be managed by scaling into a bearish position.
Commodities
Copper
There's a lot of pessimism about copper's prospects. This is evidenced in
articles we have read but more importantly it is evidenced in the COT
data. In particular, despite the fact that the copper price remains above
its January low and has been trading sideways in a narrow range over the
past few weeks, speculators in copper futures have been adding to their
short exposure and collectively now have close to their largest net-short
position ever.
The idea that copper should be sold is related to
the idea that T-Bonds should be bought. These positions (long T-Bonds,
short copper) will pay off if there's an increasingly-urgent shift away
from risk over the next few weeks, but we think they will result in
sizable losses if maintained for at least a few months.
Based on the lead-lag relationship between gold and copper and the
high probability that the US$ gold price made a multi-year bottom last
December, it's likely that the US$ copper price reached a multi-year
bottom in January. We won't be surprised if the copper price tests its
January bottom within the coming few weeks, but we expect that it will be
much higher a year from now. Consequently, we will be looking for
opportunities to add to our copper exposure.
The simplest way to
obtain some leveraged exposure to copper is via the
Global X Copper Miners
ETF (COPX). Hopefully there will be sufficient short-term weakness to
create an opportunity to buy COPX near support at US$12.50.
Oil
The oil price has remained above its
50-day MA since breaking above it in February. To signal that something
more than a routine 1-3 week pullback is underway it will have to close
below this moving average.
The oil price dropped to its 50-day MA
last Thursday and then rebounded strongly on Friday, so something more
than a 1-3 week top has not yet been signaled. However, the divergence of
the past six weeks between the currency and oil markets points to a lot
more downside in the oil price than occurred over the past two weeks.
The Stock Market
The US
Last week the S&P500 Index (SPX) broke below its 50-day MA. This is a
small piece of evidence in favour of our bearish outlook, but the 50-day
MA is not an important support level for the SPX. The reason is that the
SPX routinely pulls back to just below this MA during upward trends.
To signal that something more than a routine pullback is happening the
SPX will have to close below lateral support at 2040. This support level
was breached on an intra-day basis during last month's decline, but held
on a daily-closing basis. Closing below it would signal that a
larger-degree decline was underway.
The NASDAQ100 Index (NDX) has closed below its 50- and 200-day moving
averages. This should be viewed as a warning that more weakness is coming,
but to clearly differentiate the current decline from last month's decline
the NDX will have to close below lateral support at 4300. A daily close
below 4300 would potentially be followed by the sort of plunge that
occurred last August and again in January.
The Dow Transportation Average (TRAN) traded below important lateral
support last Thursday, but then recovered. It, too, has therefore not yet
done enough on the downside to confirm that a serious decline has begun.
The bottom line is that while the US stock market moved in the right
direction (from our perspective) last week, it hasn't yet signaled that
something more than a routine pullback is underway. What needs to happen
is a daily TRAN close below 7500, a daily NDX close below 4300 and a daily
SPX close below 2040.
The UK
Due to this
week's Brexit vote, the UK is the focal point of global attention at the
moment. It is therefore appropriate to consider the situation of London's
FTSE100 Index.
The following chart shows that the FTSE broke below
short-term support last week and then rebounded to test its breakdown. The
chart suggests that a decline to intermediate-term support at 5500-5700 is
underway. However, it's possible that anticipation related to the Brexit
vote is distorting the market and that the true trend won't become evident
until the week commencing Monday 27th June.
Over the past couple of days the betting odds have shifted further in
favour of Britain voting to stay in the EU. How people bet with their
money is always a better indication of sentiment than what they say in
opinion polls, so the probability is now high that the 'stay' side will
win on 23rd June. This could result in a relief rally in the UK stock
market and most other stock markets, but, as mentioned in last week's
Interim Update, the surprise could be that stock markets briefly rebound
in response to a 'stay' result and then decline to below their pre-vote
lows.
This week's
significant US economic events
[Notes:
1) The most important events
(to the markets) are shown
in bold. 2) A list of global economic events can be found
HERE]
| Date |
Description |
| Monday
Jun 20 |
No important events
scheduled |
| Tuesday
Jun 21 |
No important events
scheduled |
| Wednesday
Jun 22 |
Existing Home Sales |
| Thursday
Jun 23 |
New Home Sales
Leading Economic Indicators
Brexit vote in the UK |
| Friday Jun 24 |
Durable Goods Orders
Consumer Sentiment |
Gold and the Dollar
Gold
The
US$ gold price spiked above important resistance defined by last year's high
($1308) on Thursday 16th June, but was unable to close above it. However, it
avoided generating a clear-cut bearish signal by subsequently holding above
support at $1280.
A weekly close above $1308 would be more evidence that
a cyclical bull market began last December. Also, there is a realistic
possibility that a close above $1308 would lead to a quick rise to as high as
$1400.
Going the other way, a daily close below $1280 would establish an
upside breakout failure and would probably be followed by a decline to $1200 or
lower over the ensuing few weeks.
In other words, it looks like we are
going to get a 7%-10% move in the US$ gold price within the next few weeks, with
the direction of the move indicated by a close outside the $1280-$1308 range.
Like the US$ gold price, the euro-denominated gold price broke above
important resistance (at 1160-1164 euros) last week on an intra-day basis but
was unable to close above the resistance. It ended the week within 1% of this
resistance.
Due to the on-going downward trend in real interest rates and the recent
reversal (from increasing to decreasing) in the banking sector's relative
strength, gold's true fundamentals currently have a bullish skew. This is
obviously supportive. However, speculative sentiment continues to create
significant short-term downside risk. We are referring to the fact that the
speculative net-long position in COMEX gold futures is near an all-time high.
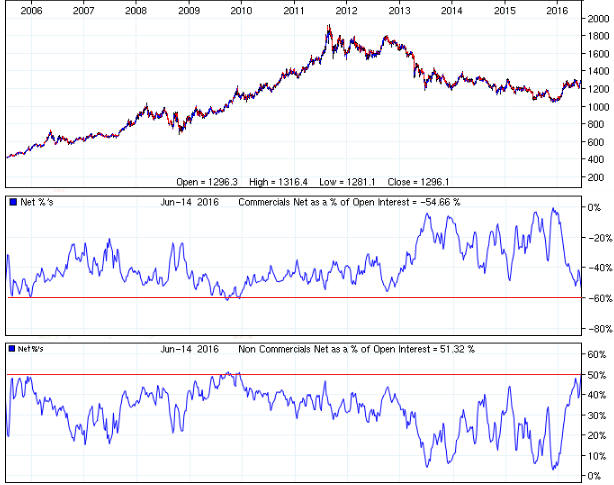
The following chart from Sharelynx.com
illustrates the sentiment-related risk. The top section of the chart shows the
gold price, the middle section of the chart shows the net position of commercial
traders (the inverse of the total net speculative position) relative to open
interest, and the bottom section of the chart shows the net position of large
speculators relative to open interest. As a percentage of open interest, the net
positioning in the gold futures market is at or near the all-time extremes
reached during 2006-2010.
The net positioning warns that a sizable
decline is coming, but it doesn't rule out the possibility of an upside blow-off
over the coming fortnight.
Silver
Like the US$ gold price, the US$ silver price
spiked upward last Thursday and then reversed course. But unlike the US$ gold
price, the US$ silver price did not trade above either its 2015 or 2016 highs
last Thursday.
$18.50 is the equivalent in the silver market of $1308 in
the gold market. This is the price level that silver must exceed on a weekly
closing basis to clearly signal a new bull market.
The fact that silver made a lower high while gold made a higher high last
Thursday is a bearish divergence, but we will only know that this divergence was
important if gold soon closes below $1280.
Gold Stocks
Based on the historical record, the 200-week MA was thought to be a
reasonable upside target for the HUI in 2016. The following weekly chart shows
that this target has been reached. It also shows that there is long-term lateral
resistance at 250-260.
The HUI's price action and resulting chart pattern have generally differed
from gold's since around mid-February. The difference, at the moment, is that
while gold looks stretched to the upside on a short-term basis, the HUI most
definitely doesn't. As illustrated by the following chart, the HUI has
essentially traded sideways over the past six weeks. On a much shorter-term
basis it has also essentially traded sideways over the past seven trading days.
The HUI's chart pattern opens up the possibility of another surge prior
to an intermediate-term top, with resistance at 250-260 being a likely target.
For this possibility to remain intact the gold price must remain above $1280.
By the way, the abnormally-high trading volumes in some gold-mining stocks
last Friday were due to the quarterly index and ETF changes that were scheduled
to take effect at the end of the week.
The Currency Market
The Yen
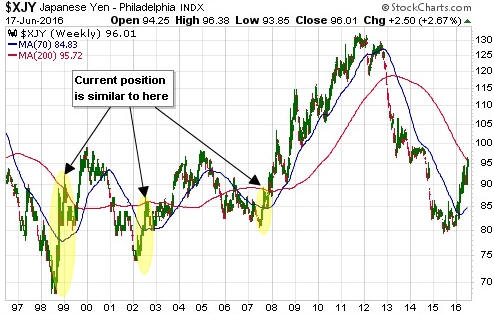
In the 18th April Weekly
Update, we wrote:
"Based on the performance of Yen futures during
previous rallies from multi-year bottoms (the shaded areas on the following
weekly chart), the 200-week MA (the red line on the chart) is the most realistic
target for an intermediate-term peak. This implies a 2016 upside target for Yen
futures of around 97."
Below is an updated version of the
aforementioned weekly Yen chart. The chart shows that the Yen has reached its
200-week MA.
Although the current price is near the most plausible target
for an intermediate-term peak, the big round number (100) could act like a
magnet. That will especially be the case if there's a further shift away from
risk over the next couple of weeks.
The upshot is that we think the Yen
is in a similar position to the T-Bond and the gold-mining indices. It is
probably close to an important top in terms of time, but there could still be a
significant upward spike to end the intermediate-term trend.
Note that
after the Yen makes an intermediate-term top, the 70-week MA (the blue line on
the following chart) will be a reasonable target for the low of the ensuing
correction. If the 70-week MA holds during the coming multi-month correction
then the stage will be set for another large Yen rally.
The Pound
The Pound plunged to
support at 1.40 last week and then rebounded to resistance near 1.44. The
elevated volatility is likely to persist this week, because although it is clear
that British voters are far more likely to collectively opt to stay in the EU
than to leave the EU, there will be greater uncertainty than usual until the
outcome is known.
The Pound has resistance at 1.44 and then at 1.47. A
weekly close above the higher of these resistance levels would project a rise to
the mid-1.50s.
Updates
on Stock Selections
Notes: 1) To review the complete list of current TSI stock selections, logon at
http://www.speculative-investor.com/new/market_logon.asp
and then click on "Stock Selections" in the menu. When at the Stock
Selections page, click on a stock's symbol to bring-up an archive of
our comments on the stock in question. 2) The Small Stock Watch List is
located at http://www.speculative-investor.com/new/smallstockwatch.html
 Company
news/developments for the week ending Friday 17th June 2016:
Company
news/developments for the week ending Friday 17th June 2016:
*Almaden Minerals (AAU) provided an update on the progress of
work at its Tuligtic gold-silver project in Mexico. The press release contained
a lot of detail about the work that was being conducted to complete the PFS and
expand the resource, but was vague about the timeline. However, the impression
we get is that completion of the PFS will happen much later than we were
expecting prior to last week.
We had been led to believe that the PFS
would be completed in the middle part of this year, but the following excerpt
from last week's press release suggests that it might not happen until early
next year:
"The related geotechnical, geomechanical, and hydrologic
field programs will be completed to a PFS level this year, allowing for the
completion of a PFS and submittal of environmental permits shortly afterwards."
This could mean that AAU's news vacuum will continue for at least six more
months.
AAU's price action has been very choppy over the past two months
(see chart below). It rallies for a few days, but just when it appears to be
ready for an upside breakout it reverses downward. It then declines for a few
days, but just when it looks ready to break out to the downside it reverses
upward.
To create the next buying or selling opportunity it will have to
break-out one way or the other. At this stage we would view a break above the
top of the range and a quick move up to resistance at US$1.50-$1.60 as an
opportunity to do some selling and a break below the bottom of the range and a
decline to the low-US$0.80s as an opportunity to do some buying.
*Endeavour Mining (EDV.TO) is raising C$125M via a "bought
deal" equity financing priced at C$20/share. Given the huge run-up in the
company's share price over the past few months, this is a sensible move. Issuing
new shares at a relatively high price (in this case within 10% of the 3-year
high reached earlier in the week) is a relatively-low-cost way of financing a
business.
*Energold Drilling (EGD.V) is raising
C$5M by issuing new shares at C$1.00. Even though the company doesn't need
additional cash, it makes sense to take advantage of the share-price strength of
the past 5 months to top-up the treasury. That being said, the company did a
poor job of negotiating the terms of the equity financing. In the current
environment it should not have been necessary for EGD to emit new shares at a
20% discount to the market price.
*Pilot Gold (PLG.TO)
has purchased the Mineral Gulch project located in southeastern Idaho. This
exploration-stage project is similar to PLG's Kinsley (Nevada) and Goldstrike
(Utah) projects, in that it is a past-producing Carlin-style oxide gold mine.
The cost of the purchase was $800K in cash plus 300K PLG shares.
This
looks like a reasonable deal, because for a relatively small sum it
significantly increases the probability of PLG discovering an economic gold
deposit.
Due to its large (by junior gold-explorer standards) portfolio
of assets and its top-notch exploration team, PLG has a much better than average
chance of discovering an economic gold deposit. However, while drilling results
achieved on some of its projects reveal great potential, the main risk with this
stock is that it hasn't done so yet.
*Ramelius Resources
(RMS.AX) updated the market on its progress. Of particular importance,
the company confirmed that it had produced about 20K ounces of gold during the
first two months of this quarter and was therefore on track to meet its
quarterly guidance of 28K-32K ounces. Also, the company advised that development
of the new Vivien gold mine was meeting or exceeding expectations and that this
new mine was set to achieve full (design) annual production during the coming
financial year (mid-2016 through to mid-2017).
RMS's management has shown
itself to be adept at extracting value from small-scale, short-life gold mines.
This type of asset tends to be valued lowly by the stock market, which is
reasonable. However, if RMS can continue to add to its sizable cash reserve then
the stock market will be forced to assign a higher value to the shares.
We think that RMS's stock price has intermediate-term upside potential of around
100% at the CURRENT gold price, but achieving this potential will depend on a
number of things going right at an operational level. The upside potential is
sufficient relative to the downside risk to keep us interested/involved, but we
view the stock as more of a hold than a buy at this time.
*Sabina
Gold and Silver (SBB.TO) had by far the most important company news of
the week. Unfortunately, the news was very bad. It was also completely
unexpected.
The Nunavut Impact Review Board (NIRB) issued its Final
Hearing Report related to SBB's Back River Gold Mine Project Proposal, and the
recommendation was that the project NOT proceed. More specifically, this is what
the NIRB wrote:
"After a thorough review of the potential ecosystemic
and socio-economic impacts of the proposed project, the Board has concluded that
on the basis of the potential for significant adverse ecosystemic and
socio-economic effects in Nunavut and also in the Northwest Territories that, in
the Board's view, cannot be adequately managed and mitigated, the proposed Back
River Gold Mine Project should not proceed at this time."
And:
"Over the course of the approximately four (4) year review process and
during the many meetings, comment periods, and the Final Hearing associated with
the Board's review of the Project, the Board heard that although the area
proposed for development has been subject to significant exploration activity
for decades, it remains relatively pristine and untouched by large scale and
potentially permanent impacts. The Board heard there is a high level of concern
about the potential for this Project to have impacts on caribou herds with
ranges in Nunavut and the Northwest Territories that have recently experienced
significant declines. In addition, the Board heard of the devastating effects
that harvesting bans and other management measures are having on communities in
the Northwest Territories. The Board also heard that there remains considerable
uncertainty regarding the extent to which efforts to monitor, manage, and
mitigate any additional adverse effects on caribou would be effective."
In its press release reporting the NIRB recommendation, SBB wrote:
"We
are studying the report and reviewing the NIRB's recommendations as we seek to
continue to move the project forward," said Bruce McLeod, president and chief
executive officer of Sabina. "The report is over 300 pages long and it will take
some time for us to review and analyze the report in detail," said Mr. McLeod.
"We remain confident that the concerns of the board can be addressed and
resolved through further consultation and collaboration with stakeholders."
And:
"Under the provisions of the Nunavut land claim agreement,
the next step in the project review process is for the minister to review the
NIRB's report. Sabina is reviewing its options, including a request to the
minister to refer the report back to NIRB for further consideration."
As mentioned above, this news was completely unexpected. It follows years of
extensive consultation with local communities and government agencies
culminating in the submission of an environmental impact statement comprising
around 15,000 pages. As far as we know, prior to last week there was no hint
that SBB's impact statement would be considered inadequate. The subscribers to
and the underwriters of the C$1.63/share equity financing completed by SBB less
than one month ago have certainly been blindsided.
It's possible that
SBB will be able to satisfactorily address the issues raised by the NIRB and
eventually obtain the required approvals for the Back River project, but even in
a best-case scenario the NIRB's decision will delay the project by 12 months and
weigh on SBB's stock price for several months. The worst-case scenario is that
the Back River project, which was explored, developed and engineered over many
years at a total cost of close to $100M, has just been rendered worthless by the
bureaucrats at the NIRB.
More information about the measures taken by
SBB to mitigate adverse environmental consequences, the NIRB's decision and
SBB's revised plans to move the project forward were outlined by Bruce McLeod
(SBB CEO) in a conference call last Thursday. You can listen -- and all current
shareholders should listen -- to a recording of the conference call
HERE. One point made on the call is that the caribou herd that the NIRB
expressed concern about does not currently utilise the Back River project area
and hasn't done so for 20+ years.
Our guess is that due to the strong
support of local communities, the substantial economic benefits that the mine
would provide to the region and the flimsy basis for the NIRB's rejection, the
necessary permits will eventually be received and Back River will proceed to the
mine construction phase. However, we have no idea how long that will take and in
the meantime the now obvious and substantial permitting risk will severely limit
the stock's upside potential. With regard to additional downside potential, the
stock price is underpinned by C$45M (about C$0.20/share) of cash and a silver
royalty linked to Glencore's development-stage Hackett River project. At current
metal prices the Hackett River royalty is probably worth no more than C$50M
(C$0.23/share), but its value will increase as base metals prices rise.
Last week's SBB drama is an example of why a prudent speculator will always take
some money off the table following a large run-up in the price of a junior
mining stock, regardless of what he/she believes the future holds in store. The
fact is that the future is always uncertain and the uncertainty will always be
much higher than average for small, single-project mining companies.
Last
week's drama is also an example of why managers of exploration/development-stage
(meaning: cash-flow negative) miners should almost always take advantage of
large share-price increases to top-up the company's treasury, even if the money
isn't needed. Fortunately, SBB's management did exactly that by issuing new
equity at C$1.63 per share to raise C$32M last month. Thanks to this financing,
SBB will have the financial resources it needs to work through the issues cited
by the NIRB.
The stock-price damage caused by last week's news is
illustrated below. We suspect that additional short-term downside will be
limited by support at C$0.90-$1.00.
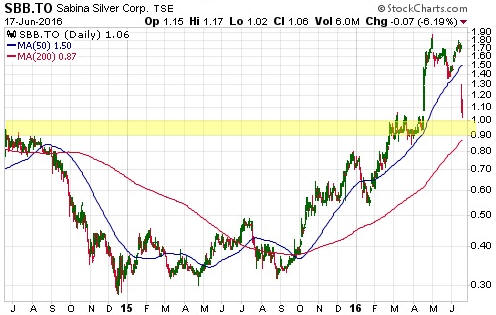
Depending on how much patience you have (as noted above, even in the best-case
scenario it will probably take many months for the company to resolve this
issue) and how much money you have at risk in this stock, SBB is either a sell
or a hold at this time with the price in the low-C$1 area. Considering the risk,
it would be a clear-cut sell above C$1.30.
*Timmins Gold
(TGD): Thanks primarily to the previously-announced sale of its
early-stage Caballo Blanco project to Candelaria Mining, TGD has repaid the
US$10M short-term loan provided by Sprott and Goldcorp. It is now in a much
stronger financial position and could be a reasonable candidate for new buying
during weakness over the coming three months.
Chart Sources
Charts appearing in today's commentary
are courtesy of:
http://stockcharts.com/index.html
