


--
Weekly Market Update for the Week Commencing
20th August 2018
Big Picture
View
Here is a summary of our big picture
view of the markets. Note that our short-term views may differ from our
big picture view.
The BULL market in US Treasury Bonds
that began in the early 1980s ended in mid-2016, but there will be many years
of topping action in bond prices and bottoming action in bond yields before
major new trends get underway. A major decline in government bond prices will
unfold during the 2020s. (Last update: 11 September 2017)
The stock market, as represented by the S&P500 Index,
commenced
a secular BEAR market during the first quarter of 2000, where "secular
bear market" is defined as a long-term downward trend in valuations
(P/E ratios, etc.), gold-denominated prices and inflation-adjusted prices. This secular trend will bottom
in 2020 or later.
(Last update: 11 September 2017)
A cyclical BEAR market in the
US
Dollar
began in 2016-2017.
(Last
update: 11 September 2017)
Gold commenced a
secular bull market relative to all fiat currencies, the CRB Index,
bonds and most stock market indices during 1999-2001.
This secular trend will peak in 2020
or later.
(Last update: 11 September 2017)
Commodities,
as represented by the CRB Index, commenced a
secular BULL market in 2001 in nominal dollar terms. The first major
upward leg in this bull market ended during the first half of 2008, but
a long-term peak won't occur until 2020 or later.
(Last
update: 11 September 2017)
Copyright
Reminder
The commentaries that appear at TSI
may not be distributed, in full or in part, without our written permission.
In particular, please note that the posting of extracts from TSI commentaries
at other web sites or providing links to TSI commentaries at other web
sites (for example, at discussion boards) without our written permission
is prohibited.
We reserve the right to immediately
terminate the subscription of any TSI subscriber who distributes the TSI
commentaries without our written permission.
True
Fundamentals Summary
[Notes:
1) The date shown next to the current True Fundamentals Model (TFM) signal is
when the most recent change occurred. 2) Charts of the Gold and Equity
TFMs are included in the "Charts and Indicators" section of the TSI web
site]
|
Market |
True Fundamentals Model (TFM) |
|
Gold (US$ Price) |
Bearish (20 Jul 2018) |
|
US Equity (SPX) |
Bearish (29 Jun 2018) |
|
Currency (Dollar Index) |
Bullish (27 Apr 2018) |
|
Commodities (GNX) |
Bearish (01 Jun 2018) |
Last week's posts at the TSI Blog
Gold: Bearish fundamentals, bullish sentiment
The next
major gold rally
Summary of current
thinking/positioning
1) The Dollar Index has
consolidated its upside breakout and probably will extend its upward trend
into September.
2) Gold-market sentiment is extreme, but an upward
reversal has not been signaled. This leaves the door open to new 2018 lows
prior to a meaningful rally getting underway. Unlike recent years when the
gold market sold off during the final quarter and made a tradable low in
December, due to the extension of the downward trend into August and
possibly September there is more likely to be a final-quarter rally in the
gold market this year.
3) Last week, capitulation finally occurred
in the gold-mining sector. The price plunge prompted us to take profits on
GDX put options that were bought for hedging purposes, although it is not
clear that the capitulation has run its course.
4) There are
numerous divergences within the US stock market, but the senior stock
indices have not yet shown significant signs of weakness. This means that
new highs could be achieved before a tradable decline gets underway.
However, with monetary conditions tightening, the short-term downside risk
is high.
5) Most industrial commodities probably will remain in
correction mode for another 1-2 months. Also, after being relatively
strong for the bulk of the past 12 months the oil market looks set to be
relatively weak for the next few months.
6) The T-Bond price should
have an upward bias (meaning: the T-Bond yield should have a downward
bias) for at least the next two months.
7) We are holding a cash
reserve of around 35%.
Another leading
indicator of US recession
Sorry to be the bearer of good
news, but the following chart shows that the NFIB Small Business Optimism
Index just hit an all-time high. While this probably means that the US
economy is as good as it is going to get, it also means that there is
little chance of a recession getting underway before next year. The reason
is that previous recessions didn't begin until after the Optimism Index
sunk below 100. Even if now is the economic peak it likely will be at
least 6-12 months before the index sinks below 100.
The message
from the Small Business Optimism Index is therefore consistent with the
message from our three favourite leading indicators of US recession.
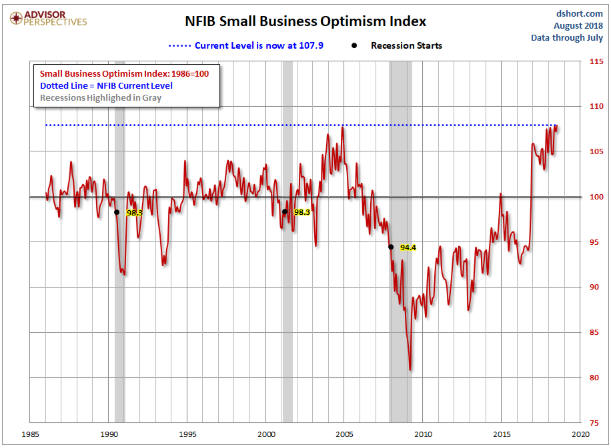
Chart source:
dshort
The True
Fundamentals
The fundamentals of a market are
the underlying forces that drive the market's valuation. In the short-term
the valuation of a market can be dominated by changes in speculative
sentiment, but intermediate-term and long-term price trends are driven
primarily by fundamental factors.
Interestingly, most people who
write about the major financial markets don't understand the markets' most
important fundamentals. For example, it is common for all sorts of things
that have either no influence or very little influence on the gold price
to be cited as important gold-market fundamentals. We've mentioned these
fake gold-market fundamentals many times in the past, such as in the
second paragraph of the blog post linked
HERE.
For another example, it is widely believed that the rate of corporate
earnings growth is an important, perhaps even the most important, driver
of the stock market, but over the long-term there has been no correlation
between the S&P500's earnings growth during a 12-month period and the
S&P500's performance during the same period. The rate of earnings growth
therefore should not be part of a fundamentals-based stock market model.
The stock market is driven by the amount that investors are prepared to
pay for current earnings, which, in turn, is influenced by the rate of
money-supply growth, economic confidence as indicated by credit spreads,
inflation expectations, interest rates, confidence in the banking system
and the willingness to take on debt.
Based on logic and historical
correlations, we developed True Fundamentals Models (TFMs) for gold, US
equities, the US$/euro exchange rate (in effect, the Dollar Index) and
commodities in general. The outputs of these models are included in a
table that appears near the top of every Weekly Market Update.
We
have been taking the inputs to these models into account for a long time
(in gold's case, about 18 years) at a qualitative level, but it was only
about a year ago that we attempted to fully quantify the fundamental
backdrop. A big part of the reason for doing so was to remove our 'gut
feel' from the equation. If you are a gold bug or an Austrian economics
devotee then your gut feel will often be something like: "a global
economic collapse is imminent!"
We aren't sure, yet, how much
weight to place on the TFMs when analysing the various markets. After all,
it isn't uncommon for sentiment and technical considerations to override
the fundamentals in the short-term. Overall, though, the TFM signals have
been quite good to date. For example, apart from the first half of July
the output of our Gold TFM has been consistently bearish since
mid-January. Considering gold's performance, this was a useful signal. For
another example, our Commodities TFM shifted from bullish to neutral in
mid-April, about a month prior to the year-to-date top for GNX (the GSCI
Commodity Index), and shifted from neutral to bearish at the beginning of
June, just prior to steep price declines getting underway in many
commodities.
The fundamental situation as reflected by our TFMs
should be viewed as pressure, with a bullish situation putting upward
pressure on the price and a bearish situation putting downward pressure on
the price. Sentiment and technical considerations can override the
fundamentals in the short-term, but if the fundamental pressure is
maintained then the price should eventually move in that direction.
A recent example is the Dollar Index (DX). Apart from a single week in
April, our US$ TFM has been bullish since mid-December of last year. In
the face of this US$-bullish fundamental backdrop, the DX promptly fell
from 93.5 to 88 and then chopped around in the 88-90 range for about three
months before beginning to trend upward. The fundamental pressure
eventually gained the upper hand.
The US stock market is the one
market that hasn't yielded to fundamental pressure over the past few
months. Apart from one week in June, our Equity TFM has been bearish since
late-May. It has not been warning of a bear market (there are different
levels of bearishness), but for almost three months it has been warning of
an intermediate-term correction. That's far from unprecedented, though, as
this model tends to be much better at generating timely bear-market
warning signals than at warning in a timely manner of intermediate-term
bull-market corrections.
The longer we track these models the
better will be our understanding of how they can be used for speculating
and investing.
Don't be short
the US Treasury market
On a long-term basis the 10-year
T-Note appears to have completed a top. The long-term pattern suggests
that the price will be much lower and the yield will be much higher a year
from now. However, on a short-term basis a "head and shoulders" bottom
appears to be almost complete (see chart below). Also, the total
speculative net-short position in 10-year T-Note futures made a new
all-time high last week, meaning that the sentiment situation is very
supportive.
The combination of sentiment and price action indicates
that the 10-year T-Note has a favourable short-term risk/reward.
Therefore, it doesn't make sense to be betting against this market at the
moment.
Getting close to a
copper bottom
The copper price traded as low as
$2.55 last Wednesday, meaning that it came within a few cents of major
support and the target that was created when it completed its topping
pattern in June.
There could be a full test of major support at
$2.48-$2.50 before a multi-month bottom is in place, but in price terms at
least 90% of copper's downward correction is probably out of way.
The Stock Market
The US stock market managed to
get through another week without doing anything significant. As
illustrated by the following daily chart, the SPX traded in a narrow range
below resistance defined by its channel top and its January high.
That being said, the bottom section of the following chart shows that the
NYSE Advance-Decline line extended its upward trend by making a new high
on Friday. This warns that the SPX will break above resistance in the near
future.
While the SPX stands a good chance of making at least a marginal new
high soon, some important US stock indices are in dicey positions. For
example, the Homebuilders ETF (XHB) has dropped below the bottom of its
long-term channel and is not far from long-term lateral support at $38.50.
Ending a week below this lateral support would leave little room for doubt
that a major top was put in place in January of this year.
If XHB breaks below the aforementioned support it will be evidence
that the US real estate boom is over. On the other hand, if the support
holds then it will be reasonable to assume that the January-2018 peak was
just the intermediate-term variety and another bull-market leg lies ahead.
We currently have no position in XHB, but with the price so close to a
critical level it could make sense to buy both put options and call
options on the expectation that a big move in one direction or the other
will get underway soon.
This week's
significant US economic events
[Notes:
1) The most important events
(to the markets) are shown
in bold. 2) A list of global economic events can be found
HERE]
| Date |
Description |
|
Monday Aug-20 |
No important events scheduled |
|
Tuesday Aug-21 |
No important events scheduled |
|
Wednesday Aug-22 |
Existing Home Sales
FOMC
Minutes |
|
Thursday Aug-23 |
New Home Sales |
|
Friday Aug-24 |
Durable Goods Orders |
Gold and the Dollar
Gold
Sentiment vs Fundamentals
For gold, the
fundamental backdrop remains very bearish and the sentiment backdrop remains
very bullish. It is not possible for an intermediate-term rally to occur in the
gold market in the face of a bearish fundamental backdrop, but a strong 1-3
month rebound is certainly possible.
It should always be kept in mind
that sentiment typically follows price. There is nothing like a strongly-rising
price to get the speculating community and the general public bullish and there
is nothing like a steep price decline to get them bearish. Therefore, important
price lows will invariably coincide with mass negativity, but the fact that
there is mass negativity won't always imply that the price is close to its
nadir.
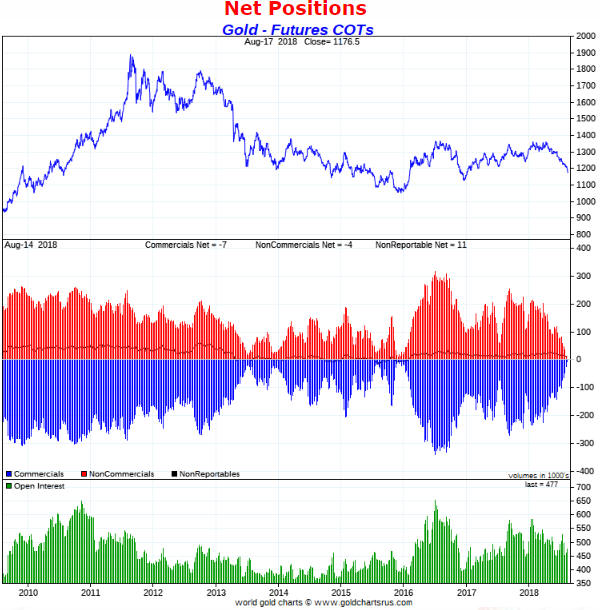
By some measures, speculative sentiment in the gold market is now
more negative than it has been at any time since 2001. For example, the
following chart shows that the total speculative net-long position in gold
futures is the smallest it has been since 2001 (the total speculative net-long
position is the inverse of the commercial net-short position, which is indicated
by the blue bars in the middle section of the chart).
What's not shown on
the following chart, though, is that speculators in gold futures were
consistently bearish and short throughout 1995-2001 while the price trended
downward. Therefore, if the price continues to trend downward with nothing more
than 1-3 month rebounds along the way, which it will if the fundamental backdrop
continues to be a head-wind, then the speculating community will become
increasingly bearish and the COT situation will become increasingly 'extreme'
compared to the post-2001 period.
To put it succinctly, the key to a
sustainable up-turn in the gold market is the fundamental situation, not
sentiment.
Current Market Situation
In last
week's Interim Update, we wrote:
"What we have is a market that is
now very 'oversold' with the sort of sentiment that is often associated with an
important price low, but also a market that is yet to provide any evidence that
a low is in place. The first sign would be a daily close above $1210 or the
20-day MA, whichever is lower."
Nothing has changed.
The
gold market was 'oversold' when it bounced off $1240 in early-July and when it
bounced off $1210 in mid-July. It is also 'oversold' now, having just bounced
from last week's low of $1167. At this time there is no way of telling whether
the latest bounce marked the start of a meaningful rally or the start of another
consolidation within a continuing short-term downward trend.
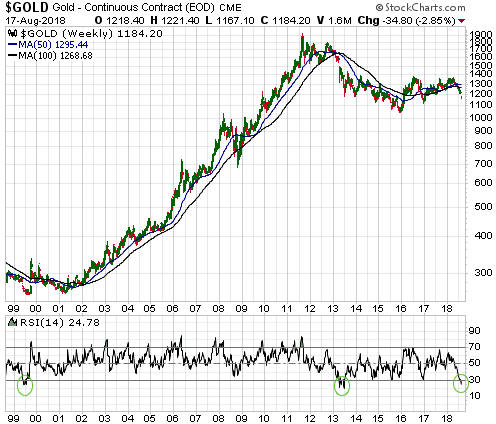
Taking a wider-angle view, the following weekly chart shows gold's performance
over the past 20 years.
Referring to the bottom section of the chart,
notice that the recent decline has taken the weekly RSI well below 30 and that
the only other times this happened over the past 20 years were Q2-2013 and
mid-1999. These were both bear-market years. During the bull-market years of
2001-2011 the weekly RSI never became anywhere near as low as it is now.
The extremely-low weekly RSI suggests that there will be a very strong, but
short-lived, rebound from last week's low or whatever new low is made over the
coming month.
Gold Stocks
Last week we got the capitulation in the
gold-mining sector that we were concerned about over the preceding few weeks. Is
that it? Is a sustainable low in place?
Probably not. While it is
certainly possible that the gold-mining indices and ETFs made short-term bottoms
on Thursday 16th August, at this time a reversal has not been signaled.
If Friday's rebound had started after a spike to well below Thursday's low then
there would be a good chance that the capitulation was over. However, it turned
out that Friday was an "inside day" for the gold-mining indices and ETFs. In
other words, Friday's trading took place inside Thursday's range. For an
illustration, refer to the following daily chart of the HUI. This doesn't
eliminate the possibility that the gold sector has bottomed, but it puts the
odds in favour of a spike to a new low prior to a price bottom that holds for at
least a few months.
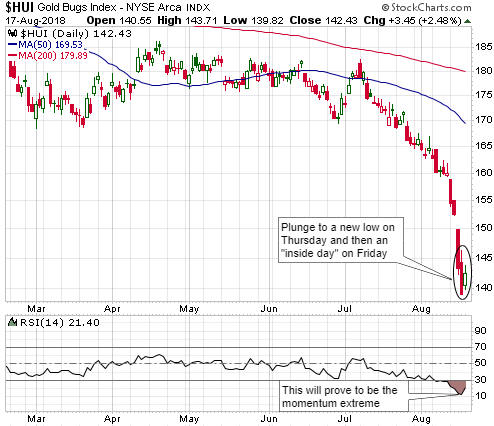
Further to our comments in last week's Interim Update, it's likely that the
downward trend's momentum extreme, as measured by the daily RSI, is in place.
That's regardless of whether or not there are new price lows over the weeks
ahead. Also, the short-term scenarios outlined in last week's Interim Update
remain applicable. The most likely scenario involves a bottom, but not the final
bottom, before the end of this month at or not far below last Thursday's low,
while a sharp drop to a new low for the move during the first half of this week
could create a more sustainable bottom.
The Currency Market
Last week the Dollar Index (DX) consolidated the preceding week's upside
breakout. Additional upside is likely prior to a multi-month top.
Based on sentiment indicators, we expect that the DX's next multi-month top will
be in place by mid-September. That's regardless of whether or not the
fundamental backdrop remains US$-bullish. Also, although the odds are in favour
of additional gains prior to a multi-month top, a daily close below 95.5 during
this week would be a preliminary warning that such a top was already in place.
With regard to the technical situation, the next piece of important evidence
will be the August monthly close. The DX broke out to the upside on a weekly
closing basis when it closed above 95.1 during the week before last, but that
breakout has to be confirmed by a monthly close above the same number.
According to the US Treasury, the "Treasury International Capital (TIC)
reporting system collects data for the United States on cross-border portfolio
investment flows and positions between U.S. residents (including U.S.-based
branches of firms headquartered in other countries) and foreign residents
(including offshore branches of U.S. firms)." In other words, the TIC
reports quantify investment flows from other countries to the US and investment
flows from the US to other countries.
The TIC reports are published with
too much of a lag to be useful in real-time analysis (for example, the report
for June was only published last week), but they can still be interesting. This
is because they can reveal whether a prior move in the US$ was driven primarily
by investment capital flows (fundamentals) or speculative trading of currency
futures.
As noted in the article posted
HERE:
"The June TIC data was reported yesterday [15th August], and there was a
net purchase of $114.5 bln of US assets. It was the third month this year that
the inflows surpassed $100 bln, matching the number in all of 2017 and exceeding
the number of months in 2016. According to this authoritative even if not
comprehensive report, foreign investors bought $417.4 bln of US assets in Q2,
the most in any quarter for a decade. That brings the first half inflow to $538
bln, also the most since 2008 and sufficient to cover the entire year's current
account deficit."
That is, the TIC numbers for June suggest that the
US dollar's recent strength was mainly the result of relatively strong demand
for US$-denominated assets (fundamentals), although we won't know the full story
until the numbers for July and August are published in mid-September and
mid-October.
Updates
on Stock Selections
Notes: 1) To review the complete list of current TSI stock selections, logon at
http://www.speculative-investor.com/new/market_logon.asp
and then click on "Stock Selections" in the menu. When at the Stock
Selections page, click on a stock's symbol to bring-up an archive of
our comments on the stock in question. 2) The Small Stock Watch List is
located at http://www.speculative-investor.com/new/smallstockwatch.html
 Company
news/developments for the week ending Friday 17th August 2018:
Company
news/developments for the week ending Friday 17th August 2018:
[Note: AISC = All-In Sustaining Cost, FS = Feasibility Study, FY = Financial
Year, IRR = Internal Rate of Return, ISR = In-Situ Recovery, MD&A = Management
Discussion and Analysis, M&I = Measured and Indicated, NAV = Net Asset Value,
NPV(X%) = Net Present Value using a discount rate of X%, NSR = Net Smelter
Return, P&P = Proven and Probable, PEA = Preliminary Economic Assessment, PFS =
Pre-Feasibility Study]
*Africa Oil (AOI.TO)
published its financial results for the June-2018 quarter.
At 30th June
the company had no long-term liabilities to speak of, US$380M of working capital
and US$59M of equity investments (stakes in Africa Energy Corp, Eco (Atlantic)
Oil and Gas, and Impact Oil and Gas), that is, the company had US$439M of
working capital plus equity investments (WC+EI). This compares to US$451M of
WC+EI at the end of the preceding quarter and US$453M at the end of last year.
AOI's flagship asset is 25% of the large development-stage South Lokichar
Basin in Kenya. The rest of the project is owned by Tullow Oil (operator, 50%
stake) and Total (25% stake). It is expected that over the next few years South
Lokichar will be developed into a producing oil field with output of around 100K
barrels of oil per day (bopd). The initial stage is estimated to have total
capex of US$2.9B and result in production of 60K-80K bopd.
AOI's share of
the initial capex would be US$725M, a significant chunk of which could be
required as soon as next year. Thanks to a) AOI's current cash hoard, and b)
Total's obligation, as part of an agreement that AOI had with Maersk Oil (Total
purchased Maersk Oil last year), to pay up to US$405M of AOI's development
expenses, funding this capex should not be problem. In any case, we suspect that
AOI will be taken over by Total after a Final Investment Decision (FID) is made
by the JV partners, that is, before it has to 'pony up' its share of the initial
capex. The current schedule is for the FID to be made in 2019.
At today's
exchange rate and total share count, the WC+EI amount of US$439M mentioned above
equates to C$1.22/share. This means that if you buy AOI shares at C$1.22 or less
you are, in effect, getting 25% of South Lokichar for free. AOI therefore
appears to be very under-valued at its current price of C$1.15/share.
*Aura Minerals (ORA.TO) published its financial statements and
MD&A for the June-2018 quarter. The financial statements showed that ORA had
US$33M of working capital and US$18M of long-term debt at 30th June, meaning
that it had US$15M of net cash. This is down from US$20M at the end of the
preceding quarter and US$21M at the end of last year. Therefore, ORA has
experienced some balance sheet deterioration during the first half of this year,
but its financial position remains healthy.
ORA has an extremely low
market value for a 140K-oz/year gold producer (at Friday's closing price of
C$1.69 it had an enterprise value of only US$41M). Also, note that ORA benefits
from weakness in the Brazilian Real, so the 15% year-to-date loss in this
currency should be giving a boost to ORA's profitability.
Prior to last
Wednesday ORA's major shareholder (Northwestern) had been successfully
supporting the stock price. Whenever the price dropped to the C$2.05-C$2.10
area, Northwestern stepped in and bought whatever was on offer. This was a
fairly inexpensive endeavour, because generally there wasn't much on offer. Last
Wednesday-Thursday, however, the supply of shares suddenly picked up.
Northwestern continued to buy, but its buying was temporarily overwhelmed by the
selling of shareholders who were obviously panicking in reaction to the
sector-wide pummeling. This caused the ORA stock price to collapse from the
low-C$2 area at Tuesday's close to C$1.48 at Thursday's close. On Friday the
price rebounded to C$1.69.
*Premier Gold (PG.TO)
reported the results of deep drilling at its exploration-stage Hasaga gold
project in Ontario, Canada. The best intercept was 23.4m (true width) grading
5.69 g/t gold.
The Hasaga project has an open-pit gold resource of about
1.7M ounces (1.1M "Indicated" plus 0.6M "Inferred") at an average grade of
around 0.8-g/t, but the deep, high-grade results reported over the past year
suggest that this project has the potential to have both an open-pit mine and an
underground mine.
At this time neither we nor the market is assigning
much value to Hasaga, but with additional exploration and engineering it could
become a valuable asset.
*Sprott Resource Holdings
(SRHI.TO) was removed from the TSI List at the beginning of this year,
but we kept the SRHI warrants. The warrants are impacted by a 1-for-20 share
rollback that took effect last Wednesday.
Due to the rollback, the number
of outstanding shares dropped from 682M to 34M and the price per share rose
accordingly. So, the owner of 20,000 shares pre-split owns 1,000 shares
post-split, with the 1,000 new shares having the same value as the 20,000 old
shares.
It's a similar but slightly different story with the warrants.
The owner of 20,000 warrants pre-split still owns 20,000 warrants, but the new
warrant exercise price is 20-times the old exercise price (the exercise price
has increased from C$0.3333 to C$6.66) and 20 warrants now have to be exercised
to purchase one share. The expiry date remains at February-2022, so there is
still a lot of time for something to happen that injects substantial value into
the warrants.
List
of candidates for new buying
From within the ranks of TSI stock
selections the best candidates for new buying at this time, listed in
alphabetical order, are:
1) AAU (last Friday's closing price: US$0.63)
2) KBLT.V (last Friday's closing price: C$6.03)
3) ORA.TO in the
C$1.50s (last Friday's closing price: C$1.69)
4) PG.TO (last Friday's
closing price: C$1.99)
5) SBB.TO (last Friday's closing price: C$1.25)
The above list is limited to five stocks. It will sometimes contain less
than five, but it will never contain more than five regardless of how many
stocks are attractively priced for new buying.
Adding
a trading position in Gold Fields Ltd. (NYSE: GFI). Recent price: US$2.49
GFI is a 2M-oz/yr gold producer with operations in Australia, South Africa,
West Africa and South America.
Last week, GFI's stock price crashed.
From its close at the end of the preceding week to its low point on Friday 17th
August it was down by 33%. It then recovered a little to end the week with a
loss of 29%.
The
sector-wide decline was part of the reason for GFI's crash, but it wasn't the
main reason. The main reason was news that the company's South Deep mine in
South Africa was performing much worse than expected and that the value of this
asset was going to be written down by about US$360M. In response to this news
and the negative sentiment towards gold, GFI's market cap was reduced by about
US$820M last week.
GFI's South African operation accounts for only 10% of
the company's production, but it makes a disproportionately large contribution
to the company's total production cost. During the first half of this year, for
example, the AISC for GFI's South African production was US$1700/oz while the
AISC for the rest of the business was about US$900/oz. It therefore makes sense
for GFI to scale-down the SA operation, which is exactly what is going to
happen.
We think that last week's collapse in the GFI stock price was a
big over-reaction and that the stock is a reasonable speculation near its
current price or lower in anticipation of a rebound. Consequently, a GFI trading
position with an expected duration of four months or less has been added to the
TSI List. The rebound target we have in mind is US$3.50.
Also, as a much
higher-risk/higher-reward speculation we will add the GFI January-2019 $3.00
call option to the TSI List if it trades at US$0.10 within the next two weeks.
It ended last week at $0.12-$0.15. A rebound in the stock price to near the
breakdown level of $3.50 would boost the price of this option to at least $0.50.
Chart Sources
Charts appearing in today's commentary
are courtesy of:
https://stockcharts.com/
http://www.goldchartsrus.com/
