|
-- Weekly Market Update for the Week Commencing
20th October 2014
Big Picture
View
Here is a summary of our big picture
view of the markets. Note that our short-term views may differ from our
big picture view.
In nominal dollar terms, the BULL market in US Treasury Bonds
that began in the early 1980s ended in 2012. In real (gold)
terms, bonds commenced a secular BEAR market in 2001 that will continue
until 2018-2020. (Last
update: 20 January 2014)
The stock market, as represented by the S&P500 Index,
commenced
a secular BEAR market during the first quarter of 2000, where "secular
bear market" is defined as a long-term downward trend in valuations
(P/E ratios, etc.) and gold-denominated prices. This secular trend will bottom sometime between 2014 and 2020.
(Last update: 22 October 2007)
A secular BEAR market in the Dollar
began during the final quarter of 2000 and ended in July of 2008. This
secular bear market will be followed by a multi-year period of range
trading.
(Last
update: 09 February 2009)
Gold commenced a
secular bull market relative to all fiat currencies, the CRB Index,
bonds and most stock market indices during 1999-2001.
This secular trend will peak sometime between 2014 and 2020.
(Last update: 22 October 2007)
Commodities,
as represented by the Continuous Commodity Index (CCI), commenced a
secular BULL market in 2001 in nominal dollar terms. The first major
upward leg in this bull market ended during the first half of 2008, but
a long-term peak won't occur until 2014-2020. In real (gold) terms,
commodities commenced a secular BEAR market in 2001 that will continue
until 2014-2020.
(Last
update: 09 February 2009)
Copyright
Reminder
The commentaries that appear at TSI
may not be distributed, in full or in part, without our written permission.
In particular, please note that the posting of extracts from TSI commentaries
at other web sites or providing links to TSI commentaries at other web
sites (for example, at discussion boards) without our written permission
is prohibited.
We reserve the right to immediately
terminate the subscription of any TSI subscriber who distributes the TSI
commentaries without our written permission.
Outlook Summary
Market
|
Short-Term
(1-3 month)
|
Intermediate-Term
(6-18 month)
|
Long-Term
(2-5 Year)
|
|
Gold
|
N/A |
Bullish
(26-Mar-12) |
Bullish
|
|
US$ (Dollar Index)
|
N/A |
Neutral
(29-Sep-14) |
Neutral
(19-Sep-07) |
|
US Treasury Bonds (TLT)
|
N/A |
Neutral
(18-Jan-12)
|
Bearish |
|
Stock Market
(DJW)
|
N/A |
Bearish
(28-Nov-11) |
Bearish
|
|
Gold Stocks
(HUI)
|
N/A |
Bullish
(23-Jun-10) |
Bullish
|
|
Oil |
N/A |
Neutral
(31-Jan-11) |
Bullish
|
|
Industrial Metals
(GYX)
|
N/A |
Neutral
(15-Sep-14) |
Bullish
(28-Apr-14) |
Notes:
1. Our short-term expectations are discussed in the commentaries, but except in
special circumstances we won't attempt to assign a "bullish", "bearish" or
"neutral" label to these expectations.
2. The date shown below the current outlook is when the most recent outlook change occurred.
3. "Neutral" means that we think risk and reward are roughly in balance with respect to the timeframe in question.
4. Long-term views are determined almost completely by fundamentals and intermediate-term views
are determined by a combination of fundamentals, sentiment and technicals.
Change
to Outlook Summary Table
The "Outlook Summary" Table has been
part of the TSI Weekly Market Update since 2004, but we have never
been comfortable with it. Even during periods when almost everything
appeared to be heading in the right direction as far as our market
expectations and specific investment/speculation suggestions were
concerned, we weren't comfortable assigning a "bullish", "bearish"
or "neutral" label to our expectations.
One problem is that we never think in terms of "bullish" and
"bearish" when managing our own money. Another problem is that we
aren't sure what these words really mean in practice. For example,
if we believe that a market has an 80% chance of rising by 5% and a
20% risk of falling by 30% over a certain period, does this imply
that we are bullish, bearish or neutral on the market? The expected
outcome of a trade with these parameters would be a loss of 2%
(80%*5% - 20%*30%), meaning that if this trade were done a large
number of times the expected cumulative result would be a loss of
2%. However, 80% of the time the trade would result in a profit of
5%. Therefore, if our analysis of probabilities and returns was 100%
correct (which it never will be) and we labeled our view as
"bearish" based on the negative expected outcome, we would have an
80% chance of looking wrong.
Many times we find that we have a clear view of a market's risk,
potential reward and most likely direction over a time period, but
do not know what simplistic one-word label should be assigned to
this view. Furthermore, it recently occurred to us that the time we
spent agonising over how to label a market outlook was detracting
from our analysis of the market. Consequently, we gave serious
consideration to eliminating the Outlook Table altogether.
However, instead of completely eliminating the Outlook Table we have
compromised by effectively eliminating the Table's short-term
column. We will still discuss our short-term expectations in the
commentaries as we have always done, but except under unusual
circumstances (e.g. we perceive a high risk of a crash) our
short-term outlook in the summary table will be "N/A".
The short-term outlook has always been the most difficult for us to
label because it is the one that changes most regularly and is
subject to the greatest amount of randomness. Moreover, short-term
trend following is not a strength, a focus or an interest of ours.
Economic growth causes LOWER
prices
"If you believe in the thesis that world GDP will continue to expand and that
population growth will continue, then you should own natural resources. New
people who are born will want to eat, drive, and build houses. This trend offers
long-term support for natural resources."
The above is a comment by Rick Rule in an article titled "Are
the Worst of Times Yet to Come?". We consider Rick Rule to be a brilliant
investor in natural-resource companies and agree with his investment strategy.
We also agree with everything in the afore-linked article EXCEPT the above
comment. If it is true that the prices of natural resources are supported by
economic and population growth, then why is it that world population and world
GDP have grown relentlessly over the past 200 years and yet over that entire
period the real prices of most commodities have been in downward trends?
The fact is that economic growth causes prices, including the prices of most
natural resources, to become LOWER, not higher. Real growth involves producing
more with less. That's why the fastest-growing industries generally have
downward-trending product prices. However, the downward trend in prices that
would otherwise occur due to real growth can be counteracted by monetary
inflation and political intervention, and these days that's exactly what happens
most of the time. These days, monetary inflation usually causes prices to have
an upward bias even during periods of economic progress (when prices, on
average, should be trending downward), because in addition to reducing the
purchasing power of money it makes the economy less efficient by distorting
relative price signals. Political intervention also puts upward pressure on
prices by placing obstacles in the way of more efficient production.
Consequently, genuine economic growth is most definitely not an ingredient for
large rises in natural-resource prices. Instead, two of the three main
ingredients are monetary inflation and an increase in
politically-motivated/directed spending.
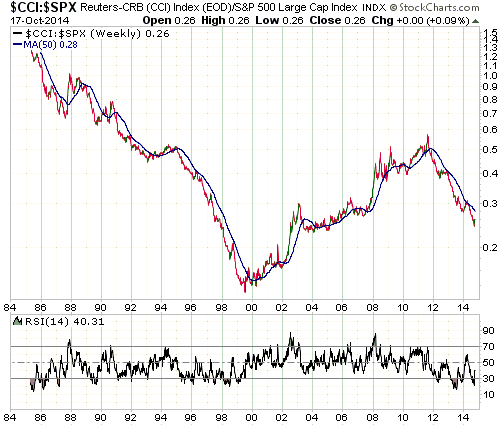
The third main ingredient is valuation. The relative valuations of different
assets and commodities will have a big influence on which prices are affected
the most by the current cycle's monetary inflation. In particular, for
commodities to be major beneficiaries of monetary inflation, commodity prices
should be low relative to the prices of equities and bonds. According to the
following weekly chart, commodity prices (as represented by the CCI) are
currently near a 10-year low relative to the S&P500 Index, which is certainly
low enough to enable a multi-quarter period of relative strength.
The Stock
Market
A bull market correction or a bear
market?
The first downward leg in a new equity bear market tends to be around 10%. A
normal stock market correction is also around 10%. That's why most people
automatically assume that the first leg of a new bear market is nothing more
than a correction within a continuing bull market.
At this stage there is no way of knowing if the SPX's 10% decline from its
September peak to last week's low was a normal correction (the first in more
than 2 years) or the start of a bear market. However, there are warning signs
that it could be the latter. These warning signs include the SPX's
unusually-high cyclically-adjusted P/E ratio, the bearish divergences that have
been developing since March of this year, the significant widening of credit
spreads over the past month, the high level of margin debt, the unusually low
level of bearish sentiment, and the recent downturn in the SPX/USB ratio (the
S&P500 Index divided by the price of the 30-year T-Bond) from near the extreme
highs reached in 2000 and 2007. Here are charts illustrating the last two of
these warning signs.
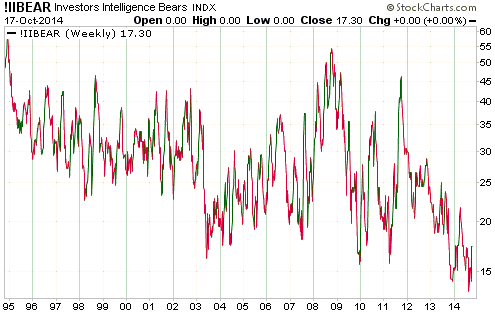
The first chart shows the percentage of the investment advisors surveyed by
Investors Intelligence that are bearish. Notice that the percentage has only
just turned up from a multi-decade low and is still at an unusually low level.
On a related matter, it's worth pointing out that the recent stock market
weakness caused the percentage of bullish advisors to fall sharply (from 57.6%
during the second week of September to 37.8% last week), but that almost all of
this decline was due to a shift from the "outright bullish" camp to the "still
long-term bullish but expecting a correction" camp. In other words, there is
currently very little concern that a bear market has begun, which, ironically,
increases the risk that a bear market has begun.
Next up we have a weekly chart of the SPX/USB ratio. The blue line on this chart
is the 50-week MA.
The last two times that the SPX/USB ratio moved above 14, a major top wasn't far
away. In each of these historical cases (1999-2000 and 2007), the first break
below the 50-week MA following the rise above 14 confirmed that a major top was
in place.
The SPX/USB ratio moved above 14 at the end of last year and broke below its
50-week MA over the past two weeks.
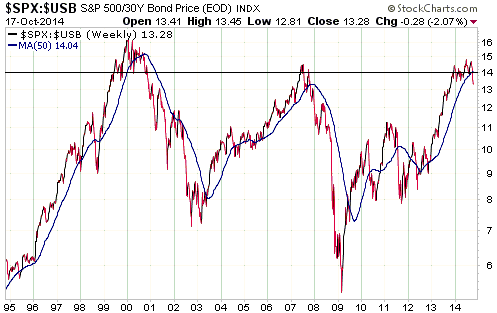
By the way, we think it's interesting that whereas one of the most popular
themes at the beginning of this year was that 2014 would encompass a big
rotation from bonds to stocks, the above chart indicates that a big rotation
from bonds to stocks actually started in early-2009 and was probably near its
end as 2014 got underway. Contrary to the popularity of the bonds-to-stocks
rotation theme, the T-Bond has outperformed the SPX year-to-date.
We reiterate that at this stage there is no way of knowing if the SPX's decline
from its September peak to last week's low was a normal correction or the start
of a bear market. There's a high (>50% probability, in our opinion) risk that it
was the start of a bear market, but the bull-market-correction scenario cannot
be ruled out.
Current Market Situation
In last week's Interim Update, we wrote:
"The US stock market is now very stretched to the downside on a short-term
basis, with the VIX having hit an intra-day high of 31 on Wednesday 15th
October. Also, having diverged bearishly in a big way prior to this week, the
Russell2000 Small-Cap Index (RUT) has diverged bullishly over the past three
days and has just reversed upward after making a new 52-week low. This suggests
to us that a multi-week low has either just been put in place or will be put in
place within the next three trading days.
We think that short-term or leveraged bearish speculations should be exited this
week with the aim of re-positioning following a decent rebound. A rebound would
likely retrace at least 50% of the decline from the September peak. "
The bottom half of the following daily chart shows last week's upward reversal
in the RUT/SPX ratio that we were alluding to in the Interim Update. The top
half of the chart shows that after making a spike low in the middle of the week
the RUT made it all the way back to former intermediate-term support (now
resistance) on Friday. Not surprisingly, it was unable to get past this
resistance on the first attempt.
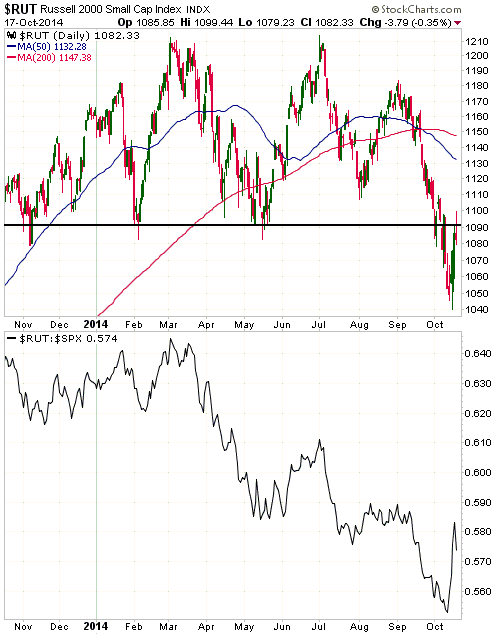
The strong up-move in the RUT/SPX ratio last Wednesday wasn't the only evidence
of a multi-week low that emerged last week. As we noted in a
short blog post in response to
Thursday's market action, there was also a collapse in the number of individual
stocks making new 52-week lows on Thursday. This collapse continued on Friday.
Specifically, the number of individual NASDAQ stocks making new lows fell from
362 on Wednesday to 122 on Thursday to only 39 on Friday, and the number of
individual NYSE common stocks making new lows fell from 294 on Wednesday to 80
on Thursday to only 13 on Friday. On Friday, the number of individual stocks
making new lows was at its lowest level since early September.
If, as seems likely, a multi-week low was put in place on Wednesday 15th
October, then it is reasonable to expect that most stock indices will retrace at
least 50% of the declines from their September peaks before resuming their
short-term downward trends. For example, it is reasonable to expect that the
S&P500 Index will work its way back to at least 1920 before a decline to new
lows begins (assuming that something more than a routine short-term correction
got underway in September). Also worth mentioning is that important resistance
levels (1900 for the SPX, 1090 for the RUT) were tested on Friday, so there
probably won't be an immediate extension of last Friday's rebound.
Here is a collection of daily charts that depict the current stock-market
situation:
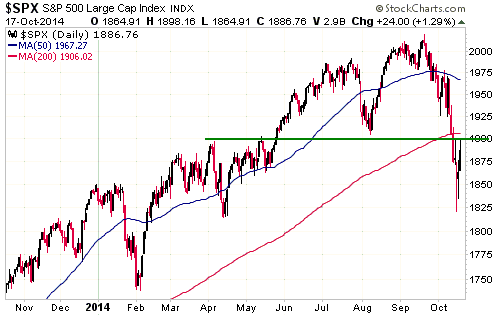
The first chart shows the S&P500's break below support at 1900 and subsequent
rebound to the breakdown level. A daily close above 1907 would undoubtedly lead
many market participants to conclude that the bull market had resumed, but, as
noted above, a typical counter-trend rebound would take the SPX up to at least
1920.
A daily close below last week's low (1820) would increase the awareness that a
bear market might have begun, especially if last week's low is taken out after
there has been a 2-4 week intervening rebound/consolidation.
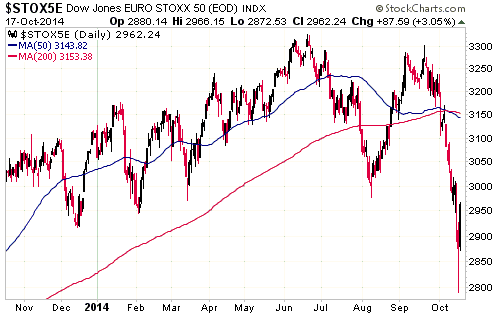
The second chart shows the EURO STOXX 50 Index (STOX5E), a proxy for large-cap
European stocks. Unlike the SPX, which peaked in mid-September, the STOX5E has
been weakening since June. It was extremely 'oversold' at last week's low and is
now rebounding.
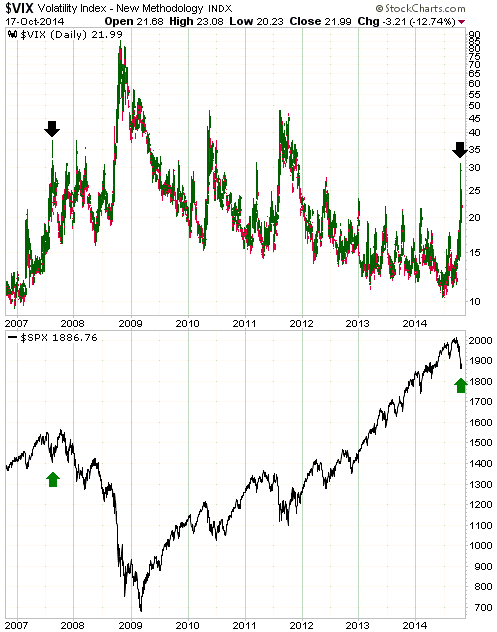
The third chart shows the Volatility Index (VIX) on the top and the SPX on the
bottom. There are two points we want to make with this chart, the first being
that IF we have just witnessed the initial decline in a bear market then the
current situation is possibly similar to August of 2007. In August of 2007 a
quick decline in the SPX pushed the VIX up to the low-30s, at which time a
rebound got underway. This rebound ended up retracing slightly more than 100% of
the initial decline. The second point is that IF a bear market has just begun,
we are probably still at least 12 months away from the start of a major equity
liquidation. In more general terms, it usually takes a lot of time and a few
failed rallies to shift the general sentiment from bullish complacency to "get
me out at any price".
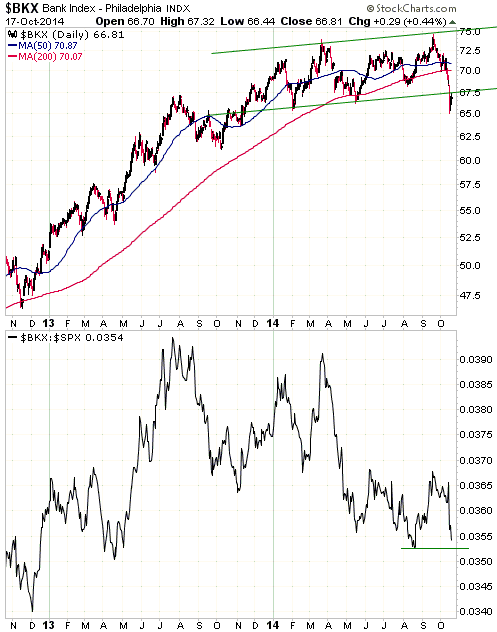
The final chart shows the Bank Index (BKX) on the top and the BKX/SPX ratio on
the bottom. The BKX has broken out to the downside a month after making a new
multi-year high. Like most stock indices it is now rebounding. The BKX/SPX ratio
has been weakening since July of 2013 and at the end of last week was not far
from the 12-month low made in August. Regardless of what happens to the BKX and
the SPX in nominal dollar terms, it would be bullish for gold if the BKX/SPX
ratio were to break below its August-2014 low.
What to do
We have no idea what anyone else should do, apart from maintain a substantial
cash reserve. Having exited all stock-market-related put options last week, the
short-term plan for our own account is to begin averaging into January-2016 SSO
(ProShares Ultra S&P500) put options following some additional rebounding
activity over the next few weeks. We might also average into the unleveraged,
actively-managed bear funds previously mentioned at TSI (BEARX and HDGE).
This plan assumes that a multi-week low was put in place last week. If this
assumption is wrong and it turns out that the initial decline from the September
peak is not yet over, then we will take no action. We will not enter bearish
speculations when the market is in the midst of a sharp decline.
Ebola
Whenever a new health 'crisis' or terrorism threat or
weapons-of-mass-destruction-in-the-wrong-hands risk or climate-change problem
becomes a front page story, the first thing that usually springs to our mind is
the H.L.Mencken quote: "The whole aim of practical politics is to keep the
populace alarmed (and hence clamorous to be led to safety) by menacing it with
an endless series of hobgoblins, all of them imaginary."
Perhaps the "Ebola Crisis" is a genuine crisis. We doubt it, but we have no way
of knowing. At a personal level we have no intention at this time of making any
changes in response to this new threat, but each person should decide for
themselves what actions are appropriate. In any case, the point we want to make
today is that the Ebola news is not the sort of thing that ends a long-term
equity bull market.
Long-term equity bull markets end due to the combination of valuation,
exhaustion, and tighter monetary conditions. Valuations are certainly high
enough to create a major top and signs of exhaustion (in the form of
divergences) have been evident for the past 6 months. It's arguable if monetary
conditions have tightened enough to set the stage for a bear market, but it's
certainly possible that they have.
Although there is almost no chance of the Ebola news being the proximate cause
of an equity bear market, if it provokes sufficient fear and market calamity
over the months immediately ahead it could, by prompting a dramatic about-face
by the Fed and removing political resistance to large-scale QE in Europe, extend
the equity bull market.
This week's
significant US economic events
(The most important events are shown
in bold)
| Date |
Description |
| Monday Oct 20 |
No important events scheduled | | Tuesday
Oct 21 |
Existing Home Sales | | Wednesday
Oct 22 |
CPI | | Thursday
Oct 23 |
Leading Economic Indicators
Kansas City Fed Mfg Index
|
| Friday Oct 24 |
New Home Sales |
Gold and
the Dollar
Gold
The gold market has been peppering away at resistance in the low-$1240s, to no
avail as yet. It will probably break through this week or next, paving the way
for a move up to the high-$1200s.
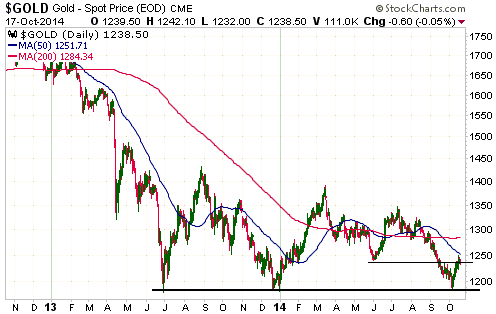
Assuming that a long-term basing pattern is still unfolding and that a spike
below the $1180 triple bottom to complete the pattern lies in the future, the
best that gold could reasonably be expected to do over the coming few weeks is
rise to around $1320. However, we won't blindly assume that a final spike to a
new low is going to happen. Whether it does or not will be influenced to a large
extent by gold's true fundamentals (real interest rates, the yield curve, credit
spreads, etc.). These fundamental drivers started to turn more bullish after the
US stock market turned down during the second half of September. If they become
increasingly bullish over the months ahead then it will become likely that gold
has done something rare and bottomed on a long-term basis by making three lows
at the same price. Note that continued improvement in the fundamental backdrop
for gold will probably require the emergence of more signs that the cyclical
bull market in US equities is dead.
Apart from an improving fundamental backdrop, the one thing in favour of gold
sustaining its triple bottom is that hardly anyone expects it.
Gold Stocks
Gold mining stocks, as represented by the HUI, are in a sort of no man's land.
They appear to be sold out, but there hasn't yet been enough strength in the
gold market to generate much interest in buying the gold miners. Historically,
gold-mining stocks have often benefited from weakness in the broad stock market,
but only to the extent that the stock market weakness is accompanied by a rising
gold price.
The recent stock-market weakness has improved the fundamental backdrop for gold
and most likely reversed its short-term price trend, but at this stage the
rebound has done no more than take the price up by a few percent to important
lateral resistance in the low-$1240s. Perhaps a definitive break above this
resistance is what's needed to bring about a significant increase in the demand
for gold-mining stocks.
Because of the almost total lack of interest in gold-mining stocks and the
improving fundamental backdrop for gold, the gold sector's risk/reward is
extremely attractive. The following weekly chart shows that the HUI has now
fallen for seven weeks in a row, which is an unusually long losing streak. It's
similar, in a way, to the winning streak that ended gold's incredible rally in
August of 2011, with a notable difference being that gold's rally ended in a
blow-off whereas the HUI's decline appears to be ending in exhaustion. That's
why the HUI's weekly RSI is well above the lows it reached during the second
quarter of 2013, despite the fact that the price is now significantly lower.
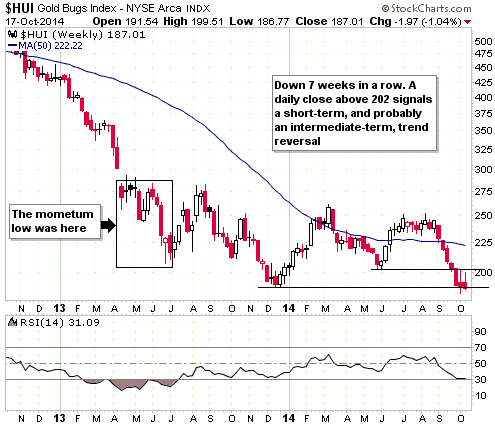
We continue to believe that even if gold bullion is destined to make a
short-lived move below its $1180 triple bottom during the first half of next
year (anything more than a short-lived move below $1180 is unlikely), the
gold-mining sector is in the process of bottoming now. The sentiment-depressing
downward drift could continue for a few more weeks or it could end this week.
Either way, purchases made near current levels are likely to be in profit within
three months. That being said, don't put yourself in the position where you
NEED the market to rally or do anything
specific in the near future.
The Currency Market
In the 8th October Interim Update and again in the 13th October Weekly Update we
mentioned that the Dollar Index had begun to experience volatility in both
directions, a sign, along with the extent to which it had become 'overbought',
that a short-term top was either in place or would soon be put in place at a
marginal new high for the year. As also mentioned in these earlier commentaries,
the 20-week MA was a likely short-term downside target for the Dollar Index.
This MA is rising and will be in the 83.0-83.5 range during the first half of
November.
In the 13th October Weekly Update we went on to note that a daily close below 85
would confirm that a short-term top is in place.
The Dollar Index is hanging in there. It tried to break below 85 last week, but
managed to close above 85 every day and ended the week at 85.3. Although we
suspect that a short-term top was put in place on 3rd October as a result of the
upward surge catalysed by irrelevant employment data, the Dollar's ability to
hold above 85 leaves open the possibility that it will make a marginal new high
before the short-term upward trend expires.
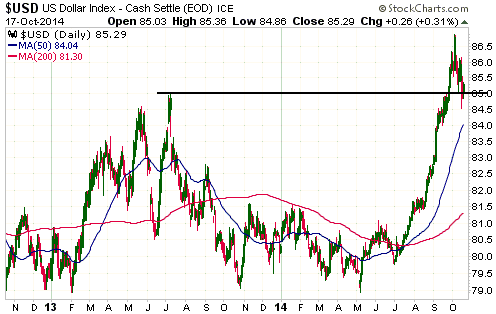
By the way, the US$ is not trading like a safe haven. At least not directly. As
we explained in a previous commentary, it is being driven primarily by the
performance of US equities relative to European equities. That's why the Dollar
Index didn't rally in response to last week's increase in fear. Given that US
equities were roughly flat relative to European equities, there's no reason why
it should have rallied.
The bottom, to date, for European equities relative to US equities occurred on
8th October. If that low holds then a short-term bottom for the euro and a
short-term top for the Dollar Index are almost certainly in place.
Updates
on Stock Selections
Notes: 1) To review the complete list of current TSI stock selections, logon at
http://www.speculative-investor.com/new/market_logon.asp
and then click on "Stock Selections" in the menu. When at the Stock
Selections page, click on a stock's symbol to bring-up an archive of
our comments on the stock in question. 2) The Small Stock Watch List is
located at http://www.speculative-investor.com/new/smallstockwatch.html
 Company
news/developments for the week ended Friday 17th October 2014: Company
news/developments for the week ended Friday 17th October 2014:
[Note: AISC = All-In Sustaining Cost, FS = Feasibility Study, IRR = Internal
Rate of Return, MD&A = Management Discussion and Analysis, M&I = Measured and
Indicated, NAV = Net Asset Value, NPV(X%) = Net Present Value using a discount
rate of X%, P&P = Proven and Probable, PEA = Preliminary Economic Assessment,
PFS = Pre-Feasibility Study]
*Endeavour Mining (EDV.TO, EVR.AX) reported that it produced
117.6K ounces of gold during Q3-2014 from its four mines in West Africa. This is
another above-plan production result from EDV.
Based on the amount of gold produced over the first three quarters of this year,
2014 production is likely to be at least 460K ounces. This compares to 2014
guidance of 400K-440K ounces. Actual 2014 production is therefore likely to come
in well above the top of the company's guidance range, which obviously
represents a very good operating performance.
The AISC during the third quarter will be reported in mid-November, but is
expected to be about the same as it was during the preceding quarter. That is,
the AISC is expected to be about US$1021/oz.
At the current gold price EDV is only marginally profitable. This puts it in a
better position than most gold producers, but it will need a higher gold price
to generate good returns.
*Ramelius Resources (RMS.AX) published its quarterly report for
the September quarter. The report contained a pleasant surprise, in that the
company was slightly cash-flow positive during the quarter. Moreover, if it
achieves its planned production and costs (20K ounces at an AISC of A$1275/oz)
it should be cash-flow positive again this quarter.
RMS and other Australia-based gold producers are being helped by the decline in
the A$. In A$ terms, the gold price bottomed way back in April of 2013 and has
since made a sequence of higher lows.
*Timmins Gold (TGD) reported that it produced 27K ounces of gold
from its San Francisco Mine (Mexico) during the September quarter. This was 1-2K
ounces less than forecast, but was a decent result considering that record
rainfall in September restricted access to the pit. The company expects that
2014 production will be near the top end of its 115K-125K guidance range.
List of candidates for new buying
From within the ranks of TSI stock selections the best candidates
for new buying at this time, listed in alphabetical order, are:
1) AAU (last Friday's closing price: US$1.28).
2) EDV.TO (last Friday's closing price: C$0.64).
3) EVN.AX (last Friday's closing price: A$0.67).
4) TGD (last Friday's closing price: US$1.27).
5) TGM.V (last Friday's closing price: C$0.31).
Note that the above list is limited to five stocks. It will
sometimes contain less than five, but it will never contain more
than five regardless of how many stocks are attractively priced for
new buying.
Also note that stocks will often move in and out of the above list
due to relative performance, with stocks that have done well over
the preceding week sometimes making way for stocks that have, for no
company-specific fundamental reason, done poorly. For example, last
week we had PVG as one of the best candidates for new buying at its
10th October closing price of US$4.94. PVG then moved sharply higher
in the face of a lacklustre market and at Thursday's high was up by
25% on the week. At that point it was also at resistance defined by
its 50-day MA and likely to pull back. It pulled back on Friday, but
was still up by 14% over the course of what was a flat week for the
overall gold sector (GDXJ was flat, the HUI was down 1%). This surge
to resistance and relatively good performance caused PVG to drop out
of the above list. It was a similar story with DNA.TO, which ended
the week with a gain of 11%.
Chart Sources
Charts appearing in today's commentary
are courtesy of:
http://stockcharts.com/index.html

|
