|
-- Weekly Market Update for the Week Commencing 21st April 2008
Big Picture
View
Here is a summary of our big picture
view of the markets. Note that our short-term views may differ from our
big picture view.
Bonds commenced a secular BEAR market in
June of 2003. (Last
update: 22 August 2005)
The stock market, as represented by the S&P500 Index, commenced
a secular BEAR market during the first quarter of 2000, where "secular
bear market" is defined as a long-term downward trend in valuations
(P/E ratios, etc.) and gold-denominated prices. This secular trend will bottom sometime between 2014 and 2020. (Last update: 22 October 2007)
The Dollar commenced a secular BEAR market during the final quarter of 2000. The
first major downward leg in this bear market ended during the first
quarter of 2005, but a long-term bottom won't occur until 2008-2010. (Last update: 28 March 2005)
Gold commenced a
secular bull market relative to all fiat currencies, the CRB Index,
bonds and most stock market indices during 1999-2001. This secular trend will peak sometime between 2014 and 2020. (Last update: 22 October 2007)
Commodities, as
represented
by the CRB Index, commenced a secular BULL market in 2001. The first
major upward leg in this bull market ended during the second quarter of
2006, but a long-term
peak won't occur until at least 2008-2010. (Last update: 08 January 2007)
Copyright
Reminder
The commentaries that appear at TSI
may not be distributed, in full or in part, without our written permission.
In particular, please note that the posting of extracts from TSI commentaries
at other web sites or providing links to TSI commentaries at other web
sites (for example, at discussion boards) without our written permission
is prohibited.
We reserve the right to immediately
terminate the subscription of any TSI subscriber who distributes the TSI
commentaries without our written permission.
Outlook Summary
Market
|
Short-Term
(0-3 month)
|
Intermediate-Term
(3-12 month)
|
Long-Term
(1-5 Year)
|
Gold
|
Bearish
(21-Apr-08)
|
Neutral
(21-Apr-08)
|
Bullish
|
US$ (Dollar Index)
|
Bullish
(10-Mar-08)
| Bullish
(31-May-04)
|
Neutral
(19-Sep-07)
|
Bonds (US T-Bond)
|
Neutral
(03-Mar-08)
|
Bearish
(23-Jan-08)
|
Bearish
|
Stock Market (S&P500)
|
Bullish
(18-Mar-08)
|
Neutral
(26-Mar-07)
|
Bearish
|
Gold Stocks (HUI)
|
Bearish
(21-Apr-08)
|
Neutral
(21-Apr-08)
|
Bullish
|
| Oil | Bearish
(14-Jan-08)
| Bearish
(22-Oct-07)
| Bullish
|
Industrial Metals (GYX)
| Neutral
(28-Nov-07)
| Bearish
(09-Jul-07)
| Bullish
|
Notes:
1. In those cases where we have been able to identify the commentary in
which the most recent outlook change occurred we've put the date of the
commentary below the current outlook.
2. "Neutral", in the above table, means that we either don't have a
firm opinion or that we think risk and reward are roughly in balance with respect to the timeframe in question.
3. Long-term views are determined almost completely by fundamentals,
intermediate-term views by giving an approximately equal weighting to
fundmental and technical factors, and short-term views almost
completely by technicals.
Measuring the money supply
...monetary
inflation has moderated considerably since 2001-2003. Inflation is
still occurring, but hyperinflation certainly doesn't look like a
near-term threat.
In our 9th April commentary we attempted to answer the question: "What
is the best measure of money supply?" In the process of doing so we:
a) Noted that there was considerable disagreement, even amongst good
economists from the "Austrian School", regarding what constitutes money
nowadays.
b) Explained that both M1 and the Monetary Base are poor indicators of monetary conditions.
c) Referred to Murray Rothbard's 1978 article
on money supply to make the point that it is the SUBJECTIVE assessment
of people that determines whether something should, or should not, be
counted as money (savings deposits are credit transactions, but the
fact that people generally believe savings deposits to be redeemable in
standard money on demand, and therefore treat them as equivalent to
cash, means that these deposits SHOULD be included in the money supply).
d) Said that a reasonable argument could be made for including retail
Money Market Mutual Funds (MMMFs) in the money supply based on the
subjective nature of money as outlined in the above-linked Rothbard
article (if almost every individual that holds a money market deposit
BELIEVES the deposit to be a cash surrogate -- always convertible on
demand into cash at par -- then it can reasonably be argued that these
deposits form part of the money supply).
We concluded that the answer to the money supply question is not 'cut
and dried', and that there may not be a single right answer. We
therefore suggested paying attention to three different monetary
measures: TMS (True Money Supply -- the money supply measure calculated
at the Mises.org web site),
MZM (Money with Zero Maturity), and M2. These three measures will often
move together, but will occasionally diverge quite markedly.
We've since given the issue of money supply measurement more thought
and, as a result, have greater conviction with respect to two issues.
First, we are now convinced that retail MMMFs should be counted as part
of the money supply as long as the vast majority of people who hold
these deposits believe them to be redeemable at par on demand. In other
words, if almost every individual with a MMMF deposit thinks of this
deposit as part of his/her readily available money supply, then the sum
of these deposits should be considered part of the economy's total
money supply (even though doing so will result in some double-counting
of money). The key question, then, is: does almost everyone consider
their MMMF deposits to be part of their readily available money
supplies? At some future time the answer to this question might be no,
but right now we think the answer is yes.
Second, we are convinced that time deposits should NOT be counted as
part of the money supply -- despite Rothbard's assertion to the
contrary -- because when an individual places money into such an
account he/she consciously trades the convenience of having money
available on demand for the benefit of a higher interest rate. Putting
it another way, when people open time deposits they usually understand
that they are entering into credit transactions and that their money
will not be available to them until after a pre-determined amount of
time has passed.
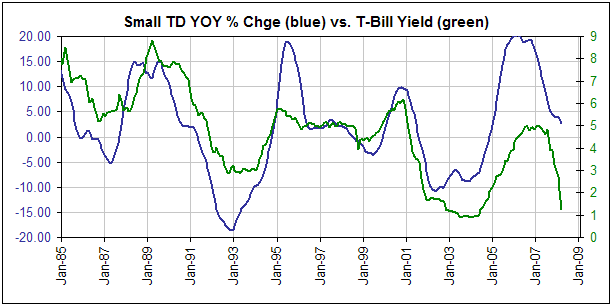
The following chart supports the notion that time deposits are
yield-based investments, rather than money. The chart shows that the
year-over-year (YOY) percentage change in small time deposits
consistently tracks the 3-month T-Bill yield (it shows that the demand
for time deposits rises and falls with short-term interest rates). In
fact, it is the strong tendency of the total time-deposit amount to
move up and down with interest rates that caused M2 and M3 -- monetary
aggregates that include time deposits -- to generate 'major league'
false signals during 1991-1993. During this period the amount of money
invested in time deposits plunged as the Fed slashed short-term
interest rates in an effort to drag the banking system out of a hole
(the sort of hole it seems to dig itself into every 8-10 years). This,
in turn, caused sharp declines in the growth rates of M2 and M3, making
it appear as if deflation was a clear and present danger. However, at
the same time that the growth rates of M2 and M3 were sinking like
stones, the growth rates of TMS and MZM -- neither of which includes
time deposits -- were shooting upwards. Based on the performance of the
stock market at the time we can be quite sure that the monetary signals
generated by TMS and MZM were the accurate ones.
As far as monetary
indicators go, TMS and MZM appear to be superior to M2 and M3. However,
from our perspective TMS is flawed because it doesn't include retail
MMMFs, while MZM is flawed because it includes both retail and
institutional MMMFs. We've therefore come up with a new monetary
aggregate that we will call TMS+, which is calculated by adding retail
MMMFs to TMS.
The following chart compares the YOY percentage changes of TMS (shown
in blue) and TMS+ (shown in red). Interestingly, there has been almost
no difference between these two measures in the past. A difference
could occur in the future, though.
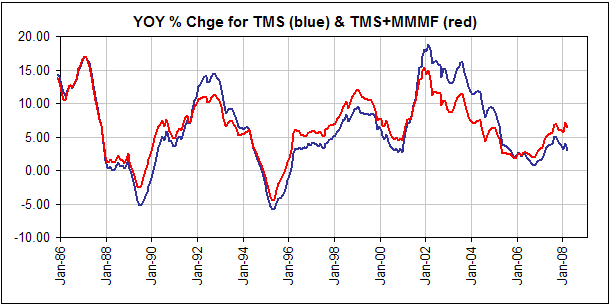
The message of both
TMS and TMS+ is that monetary inflation has moderated considerably
since 2001-2003. Inflation is still occurring, but hyperinflation
certainly doesn't look like a near-term threat. This is consistent with
our 'big picture' view in that we expect hyperinflation to occur
eventually, but not this decade.
The inflationary effects that are readily apparent almost everywhere
are mostly due to the rampant inflation that occurred during 1998-2003,
whereas the impact of the much slower monetary growth of 2004-2007 is
yet to be seen outside the real estate and financial sectors. This is
because the effects of inflation on currency purchasing power can, and
often do, lag actual inflation by several years.
Quick update on bonds
One
of the most reliable cycles in the financial world over the past 6
years has been the yearly cycle in the bond market that results in an
intermediate-term extreme (a high or a low) during the May-June time
window. To be specific, there were important highs in the bond market
during May-June of 2003 and 2005, and important lows during May-June of
2004, 2006 and 2007.
If the bond market's reliable May-June cycle is going to 'work' this
year then we think the odds are slightly in favour of it providing an
important low. The idea that there will be a sharp bond-market decline
over the next several weeks, leading up to a May-June low, meshes with
our bullish stock market outlook; however, we don't think bonds should
be sold short at this time because the Commitments of Traders data for
this market has become quite bullish (the "Commercials" have built up a
sizeable net-long position in T-Bond/T-Note futures). It would make
more sense, we think, to wait to see what bonds do over the coming
month or so before taking a position. For example, a sharp bond-market
decline over the next several weeks would likely create a very bullish
set-up, whereas a move to new highs for the year in May or June would
probably set the scene for many months of bond market weakness.
The Stock
Market
Current Market Situation
The S&P500 Index ended last week just below important resistance at
1400. However, the Dow Industrial Index and the NASDAQ100 Index (NDX)
broke decisively above similar resistance levels on Friday. The top
section of the following chart shows the NDX's upside breakout, while
the bottom section of the chart makes the point that the NDX has begun
to trend higher relative to the Dow.
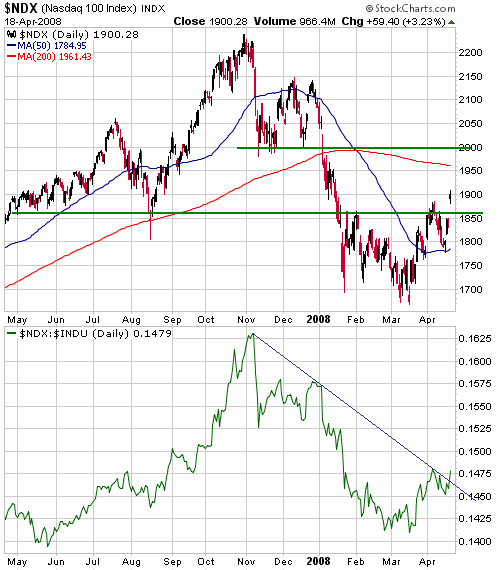
Better-than-expected
earnings from the large-cap tech stocks are driving the nascent upward
trend in the NDX/Dow ratio. There has been an overwhelming focus on the
massive write-offs occurring within the financial sector, but it is
becoming clear that there has not yet been a significant slowing in the
growth of the tech sector. Furthermore, many large US tech companies
generate a lot of their sales outside the US and are therefore
immediate beneficiaries when the US$ weakens.
Microsoft (MSFT), a large-cap tech stock in which we have an interest,
reports its latest quarterly earnings results after the close of
trading on Thursday 24th April.
Sentiment indicators suggest that the broad US stock market will
achieve significant additional gains before an important top is in
place. In particular, we note that the 10-day moving average of the
equity put/call ratio is still very high (>0.80), and that both the
Investors Intelligence and AAII sentiment surveys still show more bears
than bulls.
The Airlines
Most sectors of corporate America appear to be in reasonable shape,
with the standout exceptions being the sectors involved with
homebuilding, financial services, and air travel. Of these, only the
last one has speculative appeal for us at this time.
The airline sector has been battered and bruised by the relentless rise
in the oil price. It will continue to languish until the oil price
begins to trend lower, but once oil establishes a downward trend the
airline stocks are likely to make huge gains.
As far as the next few months are concerned, we think the airline
sector has more upside potential than any other sector of the US stock
market. This doesn't, however, mean that we think the airline sector
offers the best investment opportunity. This is a situation where the
upside potential is very high AND the risk is high given that the oil
price could -- we don't think it will, but it COULD -- move a lot
higher before it moves lower. The airline stocks should therefore be
looked at as short- or intermediate-term speculations, not investments.
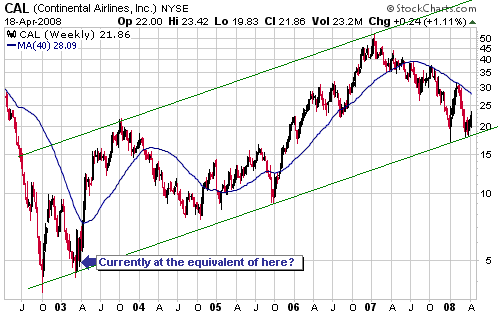
The following weekly chart of Continental Airlines (CAL) gives an
indication of the airline sector's upside potential. CAL dropped to its
long-term channel bottom in January and again in March, and might now
be in the very early part of a rally that ultimately takes the stock
back to its channel top. CAL's extremely low valuation is consistent
with the idea that a major upward trend is about to begin, but a
bullish outcome obviously hinges on the oil market soon commencing a
multi-month correction. And, as discussed in previous commentaries, a
downward correction in oil probably depends upon an upward correction
in USD/EUR.
A weekly close by CAL above its 40-week moving average (the blue line
on the following chart) would be a clear sign that a large rally had
begun, so one strategy would be to wait for a break above this moving
average before establishing a new position or adding to an existing
position in the stock. However, our preference would be to buy while
the stock is in the vicinity of its long-term channel bottom.
CAL is one component
of the "Airline Trade" in the TSI Stocks List. The other component of
this trade is COPA Holdings (CPA), Panama's national airline. CPA's
business has been so strong that it has been able to achieve good
earnings growth despite the high cost of fuel.
The following chart shows that CPA is presently testing resistance at
around $40. A break above this resistance would create a short-term
objective of $50.
This week's
important US economic events
| Date |
Description |
Monday Apr 21
| No important events scheduled
|
Tuesday Apr 22
| No important events scheduled
| | Wednesday Apr 23
| Existing Home Sales
| | Thursday Apr 24
| Durable Goods Orders
New Home Sales
| | Friday Apr 25
| No important events scheduled
|
Gold and
the Dollar
Gold
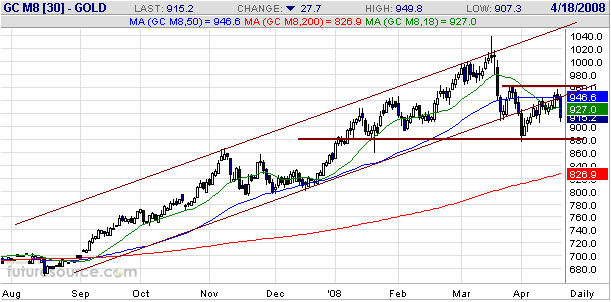
The following daily chart shows that the June gold futures contract
broke below its channel bottom about three weeks ago and found support
at $880. It then rebounded to resistance defined by its late-March
peak, its 50-day moving average, and the bottom of its former
up-channel. Friday's action suggests that this resistance has held and
that a decline to a new correction low is underway.
Friday's action has increased the probability that the $800-$850 target
range mentioned in earlier TSI commentaries will be achieved within the
next couple of months, so we have downgraded our short-term outlook for
gold from "neutral" to "bearish". Note that a daily close above $960
(basis the June contract) would indicate that this short-term bearish
outlook was wrong and that gold was, instead, on its way to a new
all-time high.
In the 14th April
Weekly Update we noted that the factors we take into account when
assessing gold's real intermediate-term trend had deteriorated to the
point where it wouldn't take much to drop the score from the "bullish"
to the "neutral" range. Due to some further narrowing of credit/yield
spreads and some additional strength in the broad US stock market
relative to gold, we would now place gold's real intermediate-term
trend in the "neutral" category. This, combined with Friday's sharp
reversal in the nominal gold price, has prompted us to downgrade our
intermediate-term outlooks for gold and gold stocks -- from "bullish"
to "neutral".
If things go roughly according to plan then our intermediate-term
outlooks for gold and gold stocks will return to "bullish" during May
or June, but we will cross that bridge when we come to it.
Gold Stocks
Re-visiting the "1973 Model"
...there's a good chance that the gold
sector's downward correction and the stock market's upward correction
will end at roughly the same time.
Over the past few months we've been comparing the recent and expected
future performances of the US stock market, the US dollar and the gold
sector with their performances during 1973. The reason, of course, is
that we perceive many similarities between the situations these markets
find themselves in today and their situations during 1973.
For the broad US stock market, 1973 was the first year of a devastating
2-year bear market, but the market's price action was not consistently
bearish; rather, it was a 'choppy' year that had a slight downward bias
and included one strong multi-month rebound. For the gold sector, as
represented by the Barrons Gold Mining Index (BGMI), 1973 was a very
good year. It did, however, include a sizeable multi-month decline -- a
decline that coincided with the aforementioned stock market rebound (as
is the case today, the gold sector and the broad stock market were
inversely correlated during much of 1973). For the US$, 1973 started
badly but ended well.
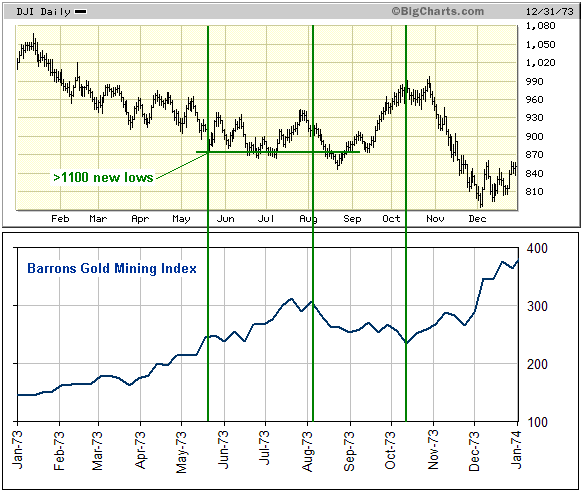
The chart displayed below, which was originally included in our 30th
January commentary, shows how the BGMI performed in relation to the Dow
Industrials Index during 1973. Notice that there was a stock market
selling climax in May (>1100 new lows on the NYSE), followed by a
3-month bottoming process and then the strong rebound mentioned above.
Notice, as well, that the BGMI trended upward from the May selling
climax until just before the Dow had completed its bottoming process,
after which it commenced a decline that ended up lasting about 2
months.
Our view has been
that the January-2008 selling climax (there were more than 1100 new
lows on the NYSE on 22nd January) was akin to the selling climax that
occurred in May of 1973, in which case it was reasonable to expect that
the January climax would usher-in a 2-3 month bottoming process
followed by a tradable rally lasting at least 2 months. This rally
began on 18th March. The parallel with 1973 also suggested that the
gold sector would remain firm until around the time that the broad
stock market's bottoming process was complete, after which a downward
correction would occur. This downward correction commenced on 17th
March.
Based on the "1973 Model" and the fact that the gold sector and the
broad stock market have been inversely correlated for much of the past
year, there's a good chance that the gold sector's downward correction
and the stock market's upward correction will end at roughly the same
time.
Current Market Situation
Our expectations have not changed, but Friday's upside breakouts by a
number of stock indices have greatly increased the probability that the
gold sector is immersed in a downward correction that won't end for at
least another month. Also, when the correction began in mid March we
thought that the HUI would do no worse than drop to the low-400s, but
the recent rebound from 420 to the mid 470s has increased the downside
risk. In particular, if the HUI were to break below support at 420 in
the near future then the decline would probably continue to well below
400 before a correction low was in place. We have therefore downgraded
our short-term outlook from "neutral" to "bearish".
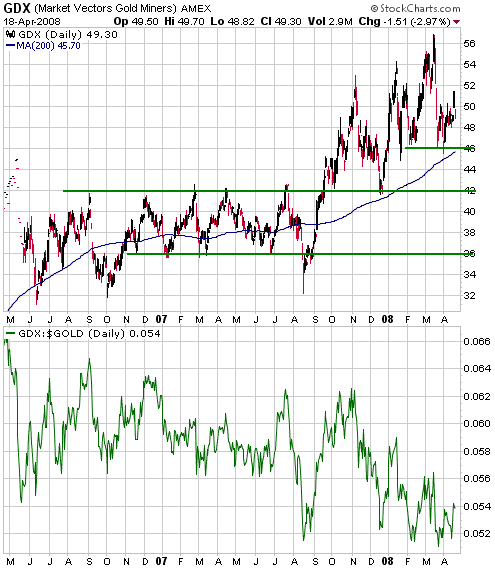
The following chart shows GDX (the Gold Mining ETF) and the GDX/gold
ratio. Support at 420 for the HUI is equivalent to support at $46 for
GDX.
According to the GDX chart, a clear break below $46 could bring the $42
and $36 support levels into play. However, when we take into account
the low current value of the GDX/gold ratio and our expectation that
gold's ultimate correction low will be in the $800-$850 range it
becomes difficult for us to imagine that GDX will trade below $40. For
example, a gold price of $800 and a GDX/gold ratio of 0.052 (near the
multi-year low) would imply a price of $41.60 for GDX. We therefore
suspect that GDX will bottom in the low $40s if support at $46 is
breached.
In last week's
Interim Update, with the HUI in the mid-470s, we said that we had begun
to average into GDX and PAAS June-July put options for hedging
purposes. We would look at a HUI rebound to 465-475 over the coming
week as an opportunity to add to this hedge position.
The problems with using put options to hedge are: a) the options will
quickly become worthless if the market does not decline in the expected
timeframe, and b) for the options to really pay off it is necessary to
time both the entry and the exit, which is difficult to do. Rather than
using put options to hedge, the average investor will therefore usually
be better served by raising cash that can subsequently be put to work
if a sharp pullback materialises.
Currency Market Update
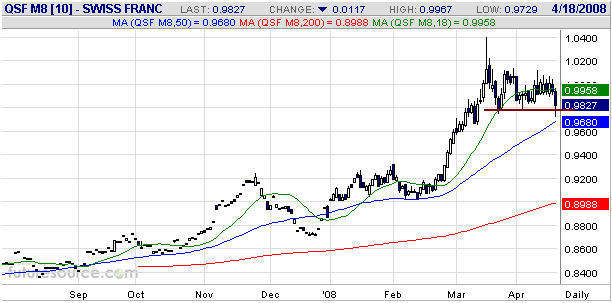
The following chart shows that the June Swiss Franc futures contract is
close to signaling an intermediate-term top. To confirm such a top it
needs to close below 0.9750.
Intermediate-term
tops are in place for the Canadian Dollar, the British Pound and, quite
likely, the Yen. The Australian Dollar hasn't confirmed a peak, but
neither has it broken decisively above last November's high. It may be
forming a double top. As noted above, the Swiss Franc is close to
signaling a top.
The one major currency that hasn't yet shown any sign of weakness
relative to the US$ is the euro. As mentioned in previous commentaries,
the June euro needs to close below its 18-day moving average to
generate an early-warning signal of a top.
Update
on Stock Selections
(Note: To review the complete list of current TSI stock selections, logon at http://www.speculative-investor.com/new/market_logon.asp
and then click on "Stock Selections" in the menu. When at the Stock
Selections page, click on a stock's symbol to bring-up an archive of our comments on the stock in question)
 European Minerals (TSX: EPM). Shares: 304M issued, 457M fully diluted. Recent price: C$0.91 European Minerals (TSX: EPM). Shares: 304M issued, 457M fully diluted. Recent price: C$0.91
In last week's Interim Update we wrote:
"...EPM will have to come
to an agreement with its lenders to re-schedule loan repayments and
deliveries into forward sales contracts so that they line up with the
revised production schedule, or arrange additional financing of at
least $30M.
We think that EPM will
get through this rough period mostly intact, although there is a good
chance that the share count will rise by another 10-15% between now and
when the company becomes cash flow positive. In any case, we would not
do any new buying of the stock until a solution to the immediate
financial issues is in place."
In a press release on Friday it was announced that EPM has arranged to
get the money it needs to solve its immediate financial problems. The
way the money is being obtained is quite strange, however, because
instead of doing its own equity financing EPM has agreed to buy a small
exploration-stage miner by the name of Lero Gold (TSXV: LER) via a
share exchange (one new EPM share for each LER share). Prior to the
takeover being effected LER will do a private placement of new shares
at C$0.85/share to raise at least $40M ($66M maximum), $25M of which
will immediately be lent to EPM.
We don't know anything about Lero, except that it owns some
exploration-stage projects in Kazakhstan and Kyrgyzstan. These projects
currently don't have any NI-43-101 compliant resources, but initial
resource estimates are due to be published before the end of this
month. EPM is also expected to issue a revised (upgraded) resource for
its Varvarinskoye gold/copper project in the near future.
Given that LER's large equity financing is being fully underwritten by
Canaccord, it seems that there is considerable demand for EPM/LER
shares at C$0.85. This suggests to us that EPM's news flow is about to
take a turn for the better.
We now consider EPM to be a speculative buy at around C$0.85.
Chart Sources
Charts appearing in today's commentary
are courtesy of:
http://stockcharts.com/index.html
http://www.futuresource.com/
http://bigcharts.marketwatch.com/

|

