![]()
![]()
![]()
![]()
-- Weekly Market Update for the Week Commencing 21st May 2018
Big Picture
View
Here is a summary of our big picture
view of the markets. Note that our short-term views may differ from our
big picture view.
The BULL market in US Treasury Bonds that began in the early 1980s ended in mid-2016, but there will be many years of topping action in bond prices and bottoming action in bond yields before major new trends get underway. A major decline in government bond prices will unfold during the 2020s. (Last update: 11 September 2017)
The stock market, as represented by the S&P500 Index, commenced a secular BEAR market during the first quarter of 2000, where "secular bear market" is defined as a long-term downward trend in valuations (P/E ratios, etc.), gold-denominated prices and inflation-adjusted prices. This secular trend will bottom in 2020 or later. (Last update: 11 September 2017)
A cyclical BEAR market in the US Dollar began in 2016-2017. (Last update: 11 September 2017)
Gold commenced a secular bull market relative to all fiat currencies, the CRB Index, bonds and most stock market indices during 1999-2001. This secular trend will peak in 2020 or later. (Last update: 11 September 2017)
Commodities,
as represented by the CRB Index, commenced a
secular BULL market in 2001 in nominal dollar terms. The first major
upward leg in this bull market ended during the first half of 2008, but
a long-term peak won't occur until 2020 or later.
(Last
update: 11 September 2017)
Copyright
Reminder
The commentaries that appear at TSI
may not be distributed, in full or in part, without our written permission.
In particular, please note that the posting of extracts from TSI commentaries
at other web sites or providing links to TSI commentaries at other web
sites (for example, at discussion boards) without our written permission
is prohibited.
We reserve the right to immediately
terminate the subscription of any TSI subscriber who distributes the TSI
commentaries without our written permission.
True
Fundamentals Summary
[Notes:
1) The date shown next to the current True Fundamentals Model (TFM) signal is
when the most recent change occurred. 2) Charts of the Gold and Equity
TFMs are included in the "Charts and Indicators" section of the TSI web
site]
| Market | True Fundamentals Model (TFM) |
| Gold (US$ Price) | Bearish (12 Jan 2018) |
| US Equity (SPX) | Neutral (11 May 2018) |
| Currency (Dollar Index) | Bullish (27 Apr 2018) |
| Commodities (GNX) | Neutral (20 Apr 2018) |
Last week's posts at the TSI Blog
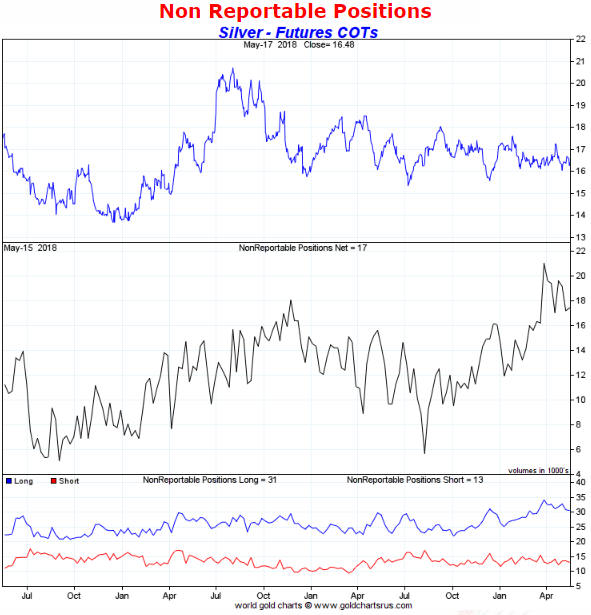
Incomplete silver COT analysis
Summary of current
thinking/positioning
1) The Dollar Index is set to
make additional gains prior to its counter-trend rally coming to an end.
2) The US$ gold price has broken out to the downside, but a short-term
bottom could be put in place as soon as this week.
3) The SPX has
confirmed an end to its correction and likely will make a new all-time
high by the end of next month. The risk/reward is not bullish, though,
because a move to well above the January high is unlikely.
4) The
multi-year upward trend in commodity prices that got underway in
early-2016 appears to have resumed. If so, the Australian and Canadian
dollars should be relatively strong over the next few months.
5)
The price of West Texas Intermediate Crude oil is close to a 1-2 month
top.
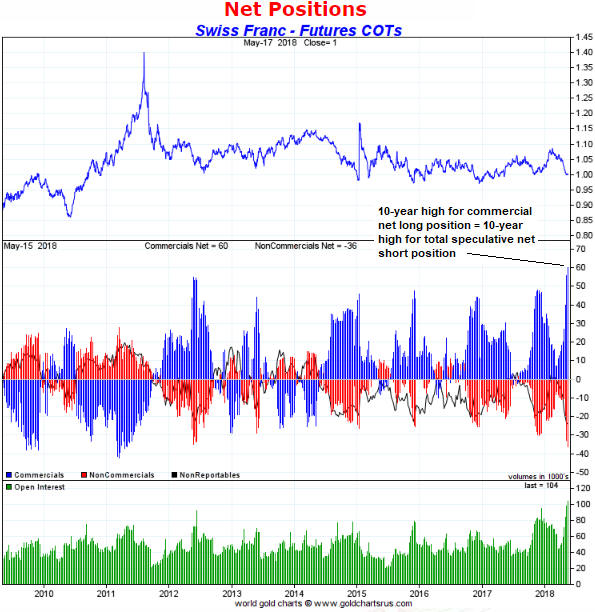
6) There is no evidence that the Swiss Franc has bottomed, but
taking a 3-6 month view this currency's risk/reward looks very attractive.
7) The T-Bond is close (in terms of time) to a multi-month bottom, but
new lows in bond prices (new highs in bond yields) are likely during the
second half of this year.
8) Holding a cash reserve of around 35%.
Revisiting the
global US$ short position
Major currency-market trends are
caused by differences in stock-market performance, real interest rates and
monetary inflation rates. When these factors conspire to create a downward
trend in the US dollar's foreign exchange value it becomes increasingly
attractive for people outside the US to borrow dollars. And when these
factors subsequently conspire to create an upward trend in the US dollar's
foreign exchange value, debt repayment becomes more costly for anyone with
US$-denominated debt outside the US and taking-on new US$ debt becomes
less appealing.
A lot more dollars get borrowed during US$
weakening trends than get repaid during US$ strengthening trends, so the
net effect of the cycle outlined above is the accumulation of
US$-denominated debt outside the US. The total quantity of this debt now
amounts to many trillions of dollars and is often referred to as the
"global US$ short position", because when you borrow in terms of a
currency you are, for all intents and purposes, short that currency.
It's important to understand that this global US$ short position is an
effect, not a cause, of US$ upward trends. The US$ doesn't rally because
of this short position, but the short position can become problematic
because of a US$ rally. The short position can become problematic due to
the collective financial position of foreign US$ borrowers deteriorating
as the US$ strengthens.
Further to the above, a substantial
extension of the Dollar Index's upward trend could bring on a global
financial crisis. The crisis likely would begin in the emerging markets,
because that's where many of the most vulnerable US$ borrowers are based.
Therefore, if the US$ rally continues we will pay closer-than-usual
attention to indicators of emerging-market financial stress, such as the
TLT/EMB ratio (T-Bonds relative to emerging-market bonds). A rising
TLT/EMB ratio points to increasing stress.
We don't expect
substantial strength in the US$ over the remainder of this year, but with
the fundamental backdrop favouring the US$ over the euro we can't rule it
out.
A copper top or
bull market correction?
We've drawn lines on the
following daily chart to make the point that the decline in the copper
price from its December-2017 peak looks similar to the correction that
occurred during February-June of last year. If this is the right way to
interpret the chart pattern then the copper price will resume its
multi-year upward trend within the next month or two.
Alternatively, everything since early-September of last year could be
interpreted as part of a major top.
We have favoured and continue
to favour the first of the above interpretations, mainly because it meshes
with our expectations for other markets. However, it won't be long before
we know for sure which interpretation is correct. A weekly close above
$3.20 would validate the first interpretation and signal that a move to
well above the December-2017 peak (potentially to US$4.00 or higher) was
underway, whereas a weekly close below $2.95 would validate the second
interpretation and signal that a move to $2.50 or lower was underway.
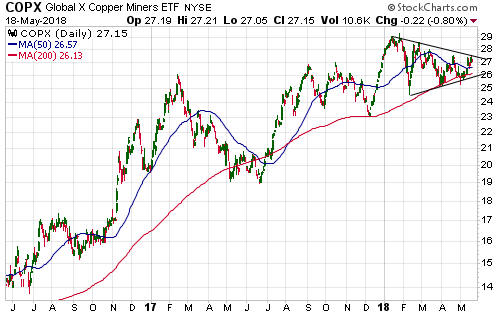
The more bullish interpretation of the above copper price chart is
supported by the chart of the Global X Copper ETF (COPX) displayed below.
COPX's price action since its January-2018 peak looks a lot more like a
mid-trend consolidation than a top.
Our final copper-related chart shows that the oil/copper ratio has
risen to near the top of the moving-average envelope that has often
limited its upward trends in the past, implying that the oil price is now
stretched to the upside relative to the copper price. This chart suggests
that copper will outperform oil over the next 6 months.
The Stock Market
The US Stock Indices
We are impressed by the recent ability of the stock market to ignore
the rising interest-rate trend. Even last week's decisive break in the
10-year T-Note yield to above 3.0% didn't spook the stock market.
The dilemma for intermediate- and long-term stock market bulls is that
interest rates are bound to continue rising until rising interest rates
are generally perceived as a major problem by the stock market, that is,
until the stock market tanks. To put it another way, the longer the stock
market ignores the rising interest-rate trend, the higher interest rates
will go before reaching intermediate-term tops.
We think that
interest rates will make short-term tops within the next couple of weeks
and then consolidate for 1-2 months. If so, that will help the stock
market and could (probably will) enable the SPX to make a new high by the
end of June. There is not yet any evidence, though, that interest rates
have topped on even a short-term basis.
With the stock market
showing internal strength, as evidenced by new highs last week in the
Russell2000 Index and the NYSE Advance-Decline Line, it's very unlikely
that a large stock-market decline will soon begin. However, if interest
rates continue to rise over the coming fortnight then the senior stock
indices will struggle to build on their recent gains.
Tesla
(TSLA) Update
As illustrated below, last week's closing
price for TSLA was slightly below the bottom of its 2.5-year channel and
right at the bottom of its shorter-term channel. Consequently, if the
stock closes just a few dollars lower on any day this week, it will have
broken out to the downside.
This is a risky time for both TSLA
bulls and TSLA bears. If it looks like the stock is breaking downward then
some of the heretofore resilient bulls may finally throw in the towel,
causing the decline to accelerate. However, due to the massive outstanding
short position there could be a vicious rally fueled by short covering if
it starts to look like support will hold.
We remain very bearish on
TSLA's intermediate-term and long-term prospects (actually, we don't think
it has any long-term prospects), but we have no opinion on what will
happen to the stock over the coming 1-2 months. Neither a $50-$100 decline
nor a $50-$100 advance would surprise us.
This week's
significant US economic events
[Notes:
1) The most important events
(to the markets) are shown
in bold. 2) A list of global economic events can be found
HERE]
| Date | Description |
| Monday May-21 | No important events scheduled |
| Tuesday May-22 | No important events scheduled |
| Wednesday May-23 |
New Home Sales FOMC Minutes |
| Thursday May-24 | Existing Home Sales |
| Friday May-25 |
Durable Goods Orders Consumer Sentiment |
Gold and the Dollar
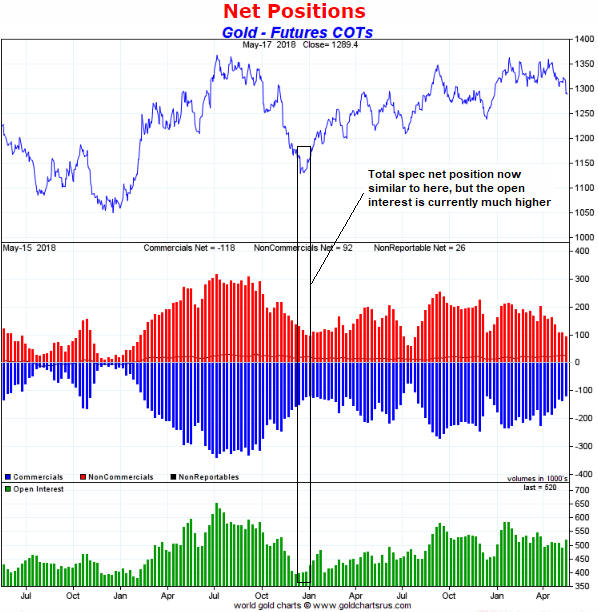
The next chart shows that speculators have accumulated their largest
net-SHORT position in A$ futures since early-2016. We view this as
moderately bullish for the A$. The qualifier "moderately" has been
inserted because the speculative net-short position in A$ futures became
much bigger than it is today prior to multi-month price bottoms during
2013-2015.
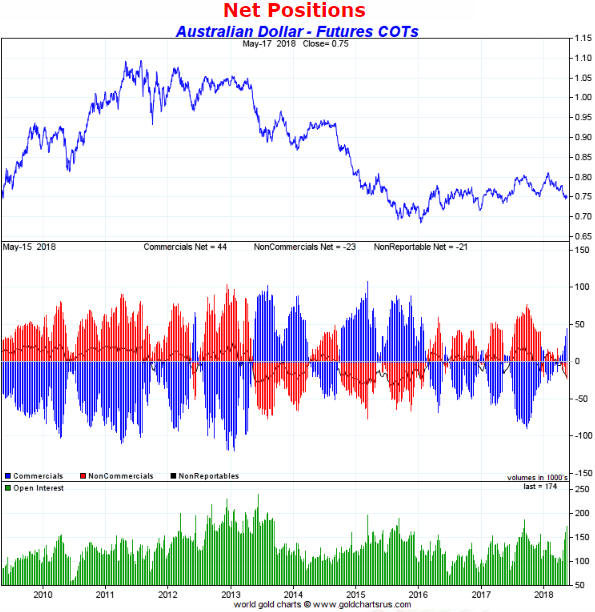
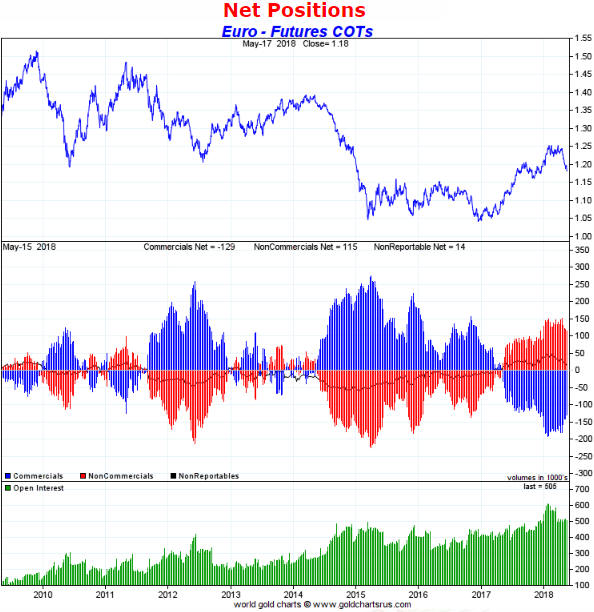
In summary, based solely on speculative sentiment the risk/reward
looks bearish for the euro and bullish for both the SF and the A$. This is
a conflict, because it's hard to imagine the euro trending downward while
both the SF and the A$ trend upward.
Price Action
A week ago we thought that the Dollar Index
(DX) had commenced a 1-3 week correction, but this was not so. The DX
resumed its short-term upward trend last Monday (14th May) and on Friday
18th May achieved its highest daily close of the year. Furthermore, last
week the US dollar's April breakout to the upside was finally confirmed by
a breakdown in the US$ gold price.
The fundamental backdrop remains
very supportive of the DX, with both the interest-rate differential and
the relative equity-market strength putting upward pressure on the
US$/euro exchange rate. At the same time, the recent pullback was not long
enough or deep enough to alleviate the DX's short-term 'overbought'
condition, so the 1-3 week correction that we thought had begun during the
week before last could begin soon.
The SF has rebounded by a small amount from its 'oversold' extreme. A
daily close above the 20-day MA (the black line on the following daily
chart) would be preliminary evidence that it has bottomed on at least a
short-term basis.
Keep in mind that the SF's recent downward
momentum extreme suggests the potential for a bounce followed by a decline
to a new low prior to the start of a sizable multi-month rally.
Before leaving the SF it's worth mentioning that the SF/euro ratio has
just rebounded to the top of an 18-month channel (see chart below). If
this ratio closes above last Friday's intra-day high it will be evidence
of an intermediate-term reversal in relative strength.
Finally, tentative signs of an A$ bottom continue to emerge, with
"tentative" being the operative word.
As previously noted, it's
possible that the early-May drop below the December-2017 low was the sort
of false breakout that quickly leads to a trend reversal. At this stage,
however, there hasn't been enough strength to confirm the reversal.
Updates
on Stock Selections
Notes: 1) To review the complete list of current TSI stock selections, logon at
http://www.speculative-investor.com/new/market_logon.asp
and then click on "Stock Selections" in the menu. When at the Stock
Selections page, click on a stock's symbol to bring-up an archive of
our comments on the stock in question. 2) The Small Stock Watch List is
located at http://www.speculative-investor.com/new/smallstockwatch.html
![]() Company
news/developments for the week ending Friday 18th May 2018:
Company
news/developments for the week ending Friday 18th May 2018:
[Note: AISC = All-In Sustaining Cost, FS = Feasibility Study, FY =
Financial Year, IRR = Internal Rate of Return, ISR = In-Situ Recovery,
MD&A = Management Discussion and Analysis, M&I = Measured and Indicated,
NAV = Net Asset Value, NPV(X%) = Net Present Value using a discount rate
of X%, NSR = Net Smelter Return, P&P = Proven and Probable, PEA =
Preliminary Economic Assessment, PFS = Pre-Feasibility Study]
*Alio Gold (ALO) advised that its takeover of Rye Patch
Gold (RPM.V) has been approved by the shareholders of both companies. We
view this as bad news, because ALO is massively overpaying for RPM's
assets. However, the news was fully expected and fully discounted in ALO's
stock price.
The combination of the two companies is scheduled to
be completed on 25th May, at which time ALO will take ownership of the
50K-oz/year Florida Canyon gold mine in Nevada.
*Aura
Minerals (ORA.TO) published its financial statements and MD&A for
the March-2018 quarter. The financial statements showed that ORA had
US$27M of working capital and US$7M of long-term debt at 31st March, which
means that its financial position is healthy enough.
The company's
latest quarterly profit and loss figures were distorted by deals that were
consummated during the quarter and therefore are not representative of
what can be expected in the future.
ORA has an extremely low market
value for a profitable 140K-oz/year gold producer (at Friday's closing
price of C$2.29 it had an enterprise value of only C$73M). This will
change. Also, note that ORA benefits from weakness in the Brazilian Real,
so the 11% year-to-date loss in this currency should be giving a boost to
ORA's profitability.
*Cobalt 27 Capital Corp.
(KBLT.V) has established a US$80M credit facility. As a result of
this and the C$200M equity financing completed in March, we estimate that
the company now has access to about C$330M of liquidity with which it can
do deals.
KBLT probably is close to completing its first cobalt
streaming deal. Unfortunately, due to the high cobalt price this is far
from an ideal time to be purchasing cobalt streams. The company must close
some deals soon, though, to create the leverage to the cobalt price that
it currently lacks.
*Euro Sun Mining (ESM)
published its financial statements and MD&A for the March-2018 quarter.
The financial statements indicate that the company had working capital
of US$1.5M at 31st March-2018, down from US$5.5M at 31st December-2017.
US$4M is a large quarterly cash draw-down for a junior exploration-stage
miner that did not conduct a drilling program during the quarter. The main
reason for the large draw-down is that directors and officers of the
company awarded themselves an additional US$2.2M of compensation in the
form of "deferred share units". Nice work if you can get it.
Due to
the substantial Q1 cash drain, ESM will have to do an equity financing
soon.
Regarding the ratification of the mining licence for ESM's
Rovina Valley gold-copper project in Romania, on 7th February the company
advised:
"The remaining signatures are expected imminently
after which the company will be able to announce the full ratification of
the mining licence. This is expected to occur some time before the end of
the month."
Then, on 7th March the company advised:
"In
continuation of the public transparency legislation in Romania, the
endorsement procedure outlined was initiated on March 6, 2018.
Ratification by the Ministry of Economy, Ministry of Environment, and
Ministry of Water and Forests is to be concluded no later than March 9,
2018.
Further reanalysis and ratification will occur by the
Ministry of Public Finance no later than March 16, 2018, and March 23,
2018, by the Ministry of Justice."
And finally, from the MD&A
issued last Monday (14th May):
"Solid progress continues
towards ratification of the Company's Romanian mining licence continued in
Q1 2018. On March 6, 2018, the Ministry of Economy, Ministry of
Environment and Ministry of Water and Forests initiated their endorsement
procedures for the ratification of the Company�s mining license in
Romania."
Interesting definition of "solid progress", when
something that was going to "be concluded no later than March 9, 2018" is
on-going.
The mining licence eventually will be ratified, but the
long delays involved in achieving this permitting milestone highlight the
difficulty of dealing with the Romanian government and developing a mine
in Romania.
*Petrus Resources (PRQ.TO)
advised that its credit facilities had been extended by 12 months.
Oil and gas drilling is a capital intensive business. As a result,
companies involved in O&G production tend to have high debt relative to
working capital. In this regard PRQ is no exception.
PRQ relies on
two credit facilities: A C$35M term loan and a C$120M revolving credit
facility (RCF). The company advised last week that the maturity date of
its term loan had been extended to October-2019 and that its RCF had been
extended to May-2019. However, at 30th June this year the total amount
available under the RCF will reduce from C$120M to C$110M.
With the
reduction in the total amount of the RCF, PRQ will have access to C$145M
of credit. At 31st March it had used C$136M of this credit.
Due to
the fully-expected extensions of the company's credit facilities, PRQ's
liquidity situation remains satisfactory. Furthermore, the company's 2018
plan involves a shift from capital investment to debt reduction, so the
liquidity situation should improve over the coming quarters.
![]() List
of candidates for new buying
List
of candidates for new buying
From within the ranks of TSI
stock selections the best candidates for new buying at this time, listed
in alphabetical order, are:
1) ALK.AX (last Friday's closing price:
A$0.28)
2) AOI.TO (last Friday's closing price: C$1.29)
3)
EGD.V (last Friday's closing price: C$0.40)
4) GRG.V (last Friday's
closing price: C$0.48)
5) PG.TO (last Friday's closing price:
C$2.71)
The above list is limited to five stocks. It will sometimes
contain less than five, but it will never contain more than five
regardless of how many stocks are attractively priced for new buying.
![]() Exiting
Euro Sun Mining (ESM.TO). Recent price: C$1.20
Exiting
Euro Sun Mining (ESM.TO). Recent price: C$1.20
We expect
that ESM's mining licence will get ratified at some point over the next
few months and that when this happens there will be a substantial bounce
in the stock price, but due to three other issues that have recently
cropped up we are not willing to wait any longer and have removed ESM from
the TSI Stocks List. The stock is flat year-to-date and up by 10% since
its September-2016 inclusion in the List.
The three other issues
are:
1) The large cash payments to officers and directors of the
company during the latest quarter.
2) The need to top up the
treasury via an equity financing in the near future.
3) ESM's
surprising involvement in a takeover bid for Nevsun Resources (NSU). In
our opinion, the bid that was made public about two weeks ago has no
chance of success. This creates the risk that ESM and its partner (Lundin)
will make a higher offer. Also, due to issues raised by NSU in its
rejection of the bid, chief among them being the potential tax liability
stemming from the transfer of NSU's Timok project to Lundin, we are not
comfortable with ESM's involvement in the takeover as presently
structured.
Chart Sources
Charts appearing in today's commentary
are courtesy of:
http://stockcharts.com/index.html
http://www.goldchartsrus.com/