![]()
![]()
![]()
![]()
-- Weekly Market Update for the Week Commencing 21st October 2019
Copyright
Reminder
The commentaries that appear at TSI
may not be distributed, in full or in part, without our written permission.
In particular, please note that the posting of extracts from TSI commentaries
at other web sites or providing links to TSI commentaries at other web
sites (for example, at discussion boards) without our written permission
is prohibited.
We reserve the right to immediately
terminate the subscription of any TSI subscriber who distributes the TSI
commentaries without our written permission.
True
Fundamentals Summary
[Notes:
1) The date shown next to the current True Fundamentals Model (TFM) signal is
when the most recent change occurred. 2) Charts of the Gold and Equity
TFMs are included in the "Charts and Indicators" section of the TSI web
site]
| Market | True Fundamentals Model (TFM) |
| Gold (US$ Price) | Bullish (04 Oct 2019) |
| US Equity (SPX) | Bearish (04 Oct 2019) |
| Currency (Dollar Index) | Neutral (15 Mar 2019) |
| Commodities (GNX) | Bearish (01 Jun 2018) |
Last week's posts at the TSI Blog
Monetary Inflation and the Next Crisis
Summary of current
thinking/positioning
1) The Dollar Index (DX)
confirmed a short-term downward trend reversal during the week before
last, but on a longer-term basis it remains in limbo. We expect that the
choppy price action of the past several months will be followed by a
substantial decline, but there remains a (diminishing) risk that the DX
will first move sharply higher for 1-3 months.
2) The US$ gold
price, the US$ silver price and the gold-mining indices are still immersed
in corrections and are at risk of experiencing sharp price declines within
the next couple of weeks, but new upward trends are expected to begin
before the end of November.
3) The SPX could be in the process of
setting an intermediate-term double top, but even if this is the case it
likely will make a marginal new all-time high prior to commencing a
sizable decline. At the same time, the Fed's new asset monetisation
program has increased the risk for bearish speculators and clear signs of
equity strength have started to emerge outside the US.
4) The
T-Bond probably has commenced a decline that will take it below its
September low within the next few weeks, but major price weakness (yield
strength) in the Treasury market could be postponed until next year.
5) We are holding a cash reserve of around 30%.
"Big Picture
View" removed from the Weekly Update
We have removed the "Big Picture
View" that until now was displayed near the top of every Weekly Market
Update. This has been done because the section covered such long
time-frames that it added no practical value. Investing and speculating
decisions should be based on the current risk/reward and potentially could
take into account forecasts of how the financial/economic landscape will
change over the coming year or two. Decisions should not be based on vague
notions of secular trends.
Yield Curve
Reversal
Last week there was a confirmed
reversal in the US yield curve from flattening to steepening. This is
evidenced in part by the recent up-turn in the 30yr-3mth yield spread
illustrated by the following chart. It is the first such signal since
Q4-2016 and differs from the previous signal in that it has come after an
inversion, which means that it is more significant. Whereas the Q4-2016
signal was part of a counter-trend move within a multi-year 'flattening'
trend, it's likely that the current signal is marking the start of a
multi-year steepening trend. What are the implications for the financial
markets and the economy?

The yield curve reversal increases the risk that a US economic
recession will start within the next few months, but it also could be
signaling the onset of a 1-2 year period of higher "inflation". The former
implies an equity bear market and strength in gold relative to industrial
commodities, whereas the latter implies a continuing equity bull market
and strength in industrial commodities relative to gold.
More
information is required to determine whether the yield curve reversal is a
boom-bust transition (recession) warning or an inflation warning, but in
either case the curve should continue to steepen over the months/quarters
ahead if last week's signal is genuine.
If the yield-curve reversal
is signaling higher "inflation" then future steepening will be primarily
the result of rising long-term interest rates. This is sometimes referred
to as a "bearish steepening" because it is driven by falling bond prices.
Alternatively, if the yield-curve reversal is signaling a transition from
boom to bust then future steepening will be primarily the result of
falling short-term interest rates. This is sometimes referred to as a
"bullish steepening" because it is driven by increases in the prices of
debt securities.
Do we think it will be a bearish or a bullish
steepening?
If not for the Fed's actions over the past few weeks we
would favour a bullish steepening, that is, we would assume that the yield
curve reversal was signaling a boom-to-bust transition. However, given the
Fed's recent reintroduction of QE we are leaning in the other direction.
Further to the discussion in the Stock Market section of today's report,
the new QE (or whatever the Fed wants to call it) program is a potential
game-changer.
Commodities
The palladium bubble
continues to inflate
There was a parabolic rise in the
palladium price to a peak in mid-March of 2019 and then a sharp 2-week
decline. In the 1st April Weekly Update we speculated that the decline
from the mid-March peak had marked the start of a multi-month correction,
but not the start of a bubble collapse. We followed up with similar
assessments in the 6th May and 15th July Weekly Updates, concluding in the
15th July commentary: "Palladium is in a bubble, but the bubble is not
yet fully inflated."
The bubble has continued to inflate and
now could be in its final blow-off phase.
The last palladium bubble
reached its ultimate high in early-2001 and the current bubble appears to
be following a similar path. The weekly charts inserted below illustrate
this. The first chart covers 1999-2001 and the second chart begins two
years ago.
If the rough similarity is maintained then today's
market will reach its final top between November of this year and March of
next year.
Consolidation in the copper market
In early
June the copper price was in the mid-$2.60s. It has since traded as high
as $2.80 and as low as $2.48, but has returned to the mid-$2.60s. For all
intents and purposes, therefore, it has gone nowhere over the past 4.5
months.
It's possible that an intermediate-term bottom was put in
place via the spike down to the $2.40s at the beginning of September, but
at this stage there is still a significant risk that a drop to a new
multi-year low will precede the start of an intermediate-term rally.
We think that copper will trade a lot higher within the coming 12
months, but the short-term risk/reward looks neutral.
The Stock Market
A potential game-changer
Once an equity bear market is well underway it runs its course,
regardless of the Fed's actions. For example, the Fed started cutting
interest rates in January of 2001, but the bear market that began in March
of 2000 continued until October-2002. For another example, the Fed started
cutting interest rates in September-2007, but a bear market commenced in
October-2007 and continued until March-2009 despite numerous Fed actions
designed to halt the price decline. On this basis it can be argued that
the Fed's introduction of a
new asset monetisation program roughly one week ago won't prevent the
stock market from rolling over into a major bearish trend. However, there
is a good reason to think that it could be different this time (dangerous
words, we know) and that the Fed's new money-pumping scheme will prove to
be game-changer.
The reason to think that it could be different
this time is that in one respect it definitely is different. We are
referring to the fact that although the Fed started cutting interest rates
in the early parts of the last two cyclical bear markets (2000-2002 and
2007-2009), it didn't begin to directly add new money to the financial
markets until the S&P500 Index had been trending downward with conviction
for about 12 months.
To further explain, when the Fed's targeted
interest rates follow market interest rates downward, which is what tends
to happen during at least the first half of an economic downturn, the
official rate cuts do not add any liquidity to the financial system. It's
only after the Fed begins to pump new money into the financial markets
that its actions have the potential to support asset prices.
During the last two bear markets, by the time the Fed started to pump
money it was too late to avoid a massive price decline. This time around,
however, the Fed has introduced a fairly aggressive money-pumping program
while the S&P500 is very close to its all-time high and seemingly still in
a bullish trend.
The Fed has emphasised that the new asset
monetisation program should not be called "QE" because it does not
constitute a shift in monetary policy. Technically this is correct, but in
a way it's worse than a shift towards easier monetary policy. The Fed's
new program is actually a thinly-disguised attempt to help the Primary
Dealers absorb an increasing supply of US Treasury debt. To put it another
way, the Fed is now monetising assets for the purpose of financing the US
federal government, albeit in a surreptitious manner.
This relates
to a point we made in a
recent
blog post. The point is that when the central bank is perceived to be
financing the government, as opposed to implementing monetary policy to
achieve economic (non-political) objectives such as "price stability",
there is a heightened risk that a large decline in monetary confidence
will be set in motion. One effect of this would be an increase in what
most people think of as "inflation".
Summing up, it's possible
that the Fed's new asset monetisation program will extend the current
cycle (prolong the equity bull market) and lead to more "price inflation"
than earlier programs.
Nearing an upside breakout in the
banking sector
With reference to the upper section of the
following weekly chart, notice that for the third time since July the US
Bank Index (BKX) is threatening to break out to the upside. A weekly close
above 103 would do it. Also, the lower section of the chart shows that the
BKX/SPX ratio is close to breaking the sequence of declining tops that
began early last year. It would do so by ending a week above its July
high.
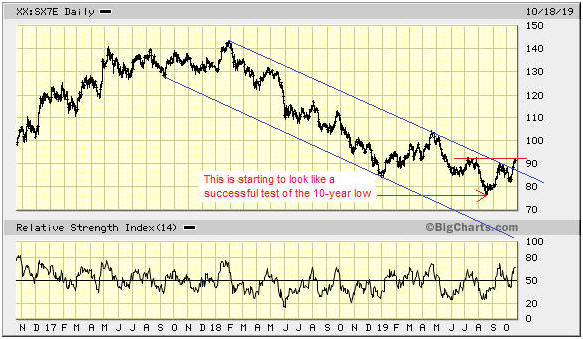
It isn't only the US banking sector that is showing signs of strength.
The following daily chart reveals that the Europe STOXX Banks Index (SX7E)
has been working its way upward since testing its 10-year low two months
ago. A weekly close above the April high would be a definitive reversal
signal.
Bank stocks in both the US and Europe have intriguing
intermediate-term upside potential. This is linked to the potential for
meaningful gains in interest rates and a substantial steepening of the
yield curve over the coming year.
Current Market Situation
The S&P500 Index (SPX) has spent the past 2.5 months making lower
highs and higher lows. In the process it has formed the contracting
triangle drawn on the following daily chart.
It tested the top of
its contracting range last week and then pulled back a little. This week
it could trade as low as 2890 without altering the short-term pattern.
Given that the NYSE Advance-Decline Line (ADL) made a new all-time
high last week, it's likely that over the next few weeks the SPX will do
no worse than test the bottom of its contracting range and at some point
move into new-high territory.
Interestingly, signs of equity-market strength are becoming apparent
outside the US. For example, the following daily chart shows that the EURO
STOXX 50 ETF (FEZ) made a new high for the year last week and that
European stocks have begun to out-perform US stocks (the FEZ/SPY ratio has
been rising since August and moved sharply higher over the past
fortnight).
For a second example, it looks like the Emerging Markets Equity ETF
(EEM) is about to break upward from the channel in which it has traded
since April.
Taken together, the new highs in the NYSE ADL and the recent signs of
strength in bank stocks, European stocks and Emerging-Market stocks point
to additional gains in equity prices in the short-term.
This week's
significant US economic events
[Notes:
1) The most important events
(to the markets) are shown
in bold. 2) A list of global economic events can be found
HERE]
| Date | Description |
| Monday Oct-21 | No important events scheduled |
| Tuesday Oct-22 | Existing Home Sales |
| Wednesday Oct-23 | No important events scheduled |
| Thursday Oct-24 |
Durable Goods Orders New Home Sales |
| Friday Oct-25 | Consumer Sentiment Index |
Gold and the Dollar