![]()
![]()
![]()
![]()
-- Weekly Market Update for the Week Commencing 22nd January 2018
Big Picture
View
Here is a summary of our big picture
view of the markets. Note that our short-term views may differ from our
big picture view.
The BULL market in US Treasury Bonds that began in the early 1980s ended in mid-2016, but there will be many years of topping action in bond prices and bottoming action in bond yields before major new trends get underway. A major decline in government bond prices will unfold during the 2020s. (Last update: 11 September 2017)
The stock market, as represented by the S&P500 Index, commenced a secular BEAR market during the first quarter of 2000, where "secular bear market" is defined as a long-term downward trend in valuations (P/E ratios, etc.), gold-denominated prices and inflation-adjusted prices. This secular trend will bottom in 2020 or later. (Last update: 11 September 2017)
A cyclical BEAR market in the US Dollar began in 2016-2017. (Last update: 11 September 2017)
Gold commenced a secular bull market relative to all fiat currencies, the CRB Index, bonds and most stock market indices during 1999-2001. This secular trend will peak in 2020 or later. (Last update: 11 September 2017)
Commodities,
as represented by the CRB Index, commenced a
secular BULL market in 2001 in nominal dollar terms. The first major
upward leg in this bull market ended during the first half of 2008, but
a long-term peak won't occur until 2020 or later.
(Last
update: 11 September 2017)
Copyright
Reminder
The commentaries that appear at TSI
may not be distributed, in full or in part, without our written permission.
In particular, please note that the posting of extracts from TSI commentaries
at other web sites or providing links to TSI commentaries at other web
sites (for example, at discussion boards) without our written permission
is prohibited.
We reserve the right to immediately
terminate the subscription of any TSI subscriber who distributes the TSI
commentaries without our written permission.
True
Fundamentals Summary
[Notes:
1) The date shown next to the current True Fundamentals Model (TFM) signal is
when the most recent change occurred. 2) Charts of the Gold and Equity
TFMs are included in the "Charts and Indicators" section of the TSI web
site]
| Market | True Fundamentals Model (TFM) |
| Gold (US$ Price) | Bearish (12 Jan 2018) |
| US Equity (SPX) | Neutral (12 Jan 2018) |
| Currency (Dollar Index) | Bullish (15 Dec 2017) |
| Commodities (GNX) | Bullish (29 Dec 2017) |
Last week's posts at the TSI Blog
Oil, the Yuan and the dollar-based monetary system
Summary of current
thinking/positioning
1) Expecting that gold will soon
make a short-term price top.
2) On the lookout for signs of trouble
in a very 'overbought' and over-valued US stock market, but at this time
not seeing any reason to expect something more bearish than a normal
short-term correction.
3) Thinking that industrial commodities such
as oil and copper will make short-term price highs during the first two
months of 2018.
4) Thinking that the Dollar Index (DX) has resumed
its longer-term downward trend, but that a counter-trend rebound will
begin within the next three weeks.
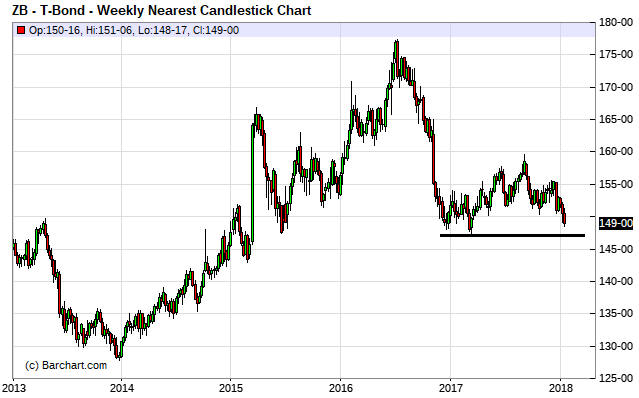
5) Thinking that the T-Bond has
almost completed an intermediate-term topping pattern within the context
of a long-term topping pattern.
6) Holding a cash reserve of about
25% and looking for opportunities to boost this reserve to 30%-35%.
The Treasury
market is getting interesting
The T-Bond price ended last week
only 2 points above long-term support defined by its March-2017 low. A
weekly close below this support (147 for the nearest futures contract)
would, we think, sound the death knell for the secular bond bull market.
Cryptomania
Update
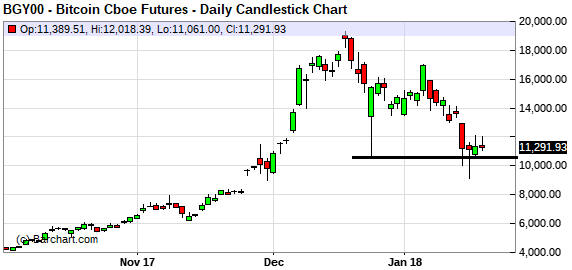
Still awaiting
confirmation of a major top
Our most recent "Cryptomania
Update" was in the 27th December Interim Update. Here's how we summed up
the Bitcoin situation at that time:
"Despite the ample evidence
that the enthusiasm for bitcoin and the associated "alt-coins" was an
extraordinary popular delusion and that the past few weeks was a major
speculative finale, there is still a realistic chance that last week's
price crash was a bull market correction. As mentioned above, confirmation
of a major top requires a price crash (done), a rebound to a lower high
(possibly in progress) and then a decline to below the crash low."
Amazingly given the size of the price plunge over the course of last
Tuesday-Wednesday, we still don't have confirmation of a major Bitcoin
price top. The reason is that although Bitcoin traded at a new post-crash
low on 17th January it is yet to CLOSE below its 22nd December low.
Therefore, what we have at the moment is a potential double-bottom, with
the 16-17 January price plunge constituting a successful test of the 22nd
December low. Refer to the following chart for details.
There's a
good chance that within the next few weeks the Bitcoin price will close
below its 22nd December low, removing most of the remaining doubt that the
price top on 18th December (the day that futures trading commenced on the
CME and a week after futures trading commenced on the CBOE) was the
ultimate top. It just hasn't happened yet.
The market-cap giveaway
There has been a lot
of talk over the past two years about the market caps of Bitcoin, the
"alt-coins" and the entire cryptocurrency universe. Even the most
outspoken advocates of the idea that private cryptocurrencies are the
future of money regularly refer to the market caps of these so-called
currencies. However, nobody ever refers to the market cap of an actual
money or commonly-used medium of exchange. For example, there is never any
mention of the euro's market cap or the Yen's market cap or gold's market
cap. This is something of a giveaway.
The market cap concept
doesn't apply to money; it applies to stocks. Therefore, when someone
refers to the market cap of Bitcoin they are -- unwittingly in most cases
-- treating Bitcoin as if it were a stock. This is appropriate, because
although a small fraction of its demand is associated with use as a medium
of exchange and although it is an important part of the first successful
attempt at creating a reliable distributed ledger, Bitcoin has always
traded more like a speculative stock than a type of money.
Bitcoin's effect on gold and gold stocks
We doubt that
2017's manic trading of Bitcoin and the other 'cryptocurrencies' siphoned
enough investment demand away from gold to make a noticeable difference to
the gold price. It is of course true that some of the people who are
interested in Bitcoin are also interested in gold, but cryptocurrency
traders would not, as a group, account for enough bullion demand to move
the gold market's dial.
It could be argued that while the bullion
market was not affected by 'cryptomania', the lacklustre performance of
the gold-mining sector in 2017 indicates that gold stocks were. However,
other stock-market-related bubbles and investment booms, such as the
marijuana stock bubble, could have drawn speculative interest away from
the gold-mining sector.
In any case, the hard reality is that while
the broad stock market is making substantial real progress there usually
will not be much enthusiasm for gold-related investments. Consequently, it
is not surprising that after the 2015-2016 weakness in the stock market
became widely perceived as nothing more than an intermediate-term
bull-market correction, the collective attention of equity speculators
drifted away from the gold-mining sector.
Gold and gold-mining
stocks can rally during a strong upward trend in the broad stock market,
which is exactly what they have done over the past few weeks. It's just
that if the equity bull market remains intact then most of the gains made
by gold-related investments will prove to be unsustainable.
Commodities
Speculators get even
more enthusiastic about oil
Another week, another new
all-time high for the total speculative net-long position in Nymex crude
oil futures. The following chart tells the story. Speculators in oil
futures are more bullish about the oil price than they have ever been.
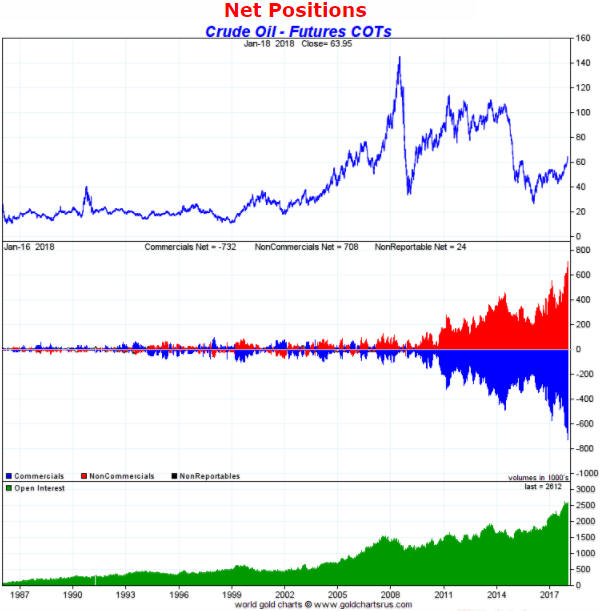
The aggressive betting on future gains in the oil price creates
downside risk, but the magnitude of the risk is mitigated by the
supply-demand situation in the physical market remaining price-supportive.
Due to the supportive fundamentals we continue to expect that the oil
price will make a new high for the year during the second quarter --
following a 1-2 month correction from a January-February (most likely
January) high.
Copper consolidation
Thanks
to the downward drift of the past three weeks the copper market is no
longer short-term 'overbought'.
This downward drift could turn into
a 2-3 month correction that takes the price down to around $3.00.
Alternatively, there could be a surge to a marginal new multi-year high
within the coming few weeks prior to the start of a more significant
correction. Either way, we expect the copper price to stay within 10% of
its current price over the next two months.
The Stock Market
The US stock market continued
its ascent last week. The relentlessness of the recent advance is clearly
evident on the following daily chart of the NASDAQ100 Index (NDX).
For important indices such as the SPX and the Dow, short-term momentum
indicators have reached multi-decade extremes. Paradoxically, this means
that there probably won't be anything more bearish than a 5%-10%
correction within the next three months, especially given that market
internals have confirmed the rally.
The bond market is the only
plausible threat to the above assessment of the stock market's short-term
prospects. We suspect that a break by the T-Bond to below last year's low
of 147 would stop the stock market rally and that downward acceleration by
the T-Bond after breaching 147 would lead to a large (15%-25%) decline in
the SPX.
This week's
significant US economic events
[Notes:
1) The most important events
(to the markets) are shown
in bold. 2) A list of global economic events can be found
HERE]
| Date | Description |
| Monday Jan-22 | No important events scheduled |
| Tuesday Jan-23 | No important events scheduled |
| Wednesday Jan-24 | Existing Home Sales |
| Thursday Jan-25 | New Home Sales |
| Friday Jan-26 |
Durable Goods Orders Q4 GDP (prelim) |
Gold and the Dollar
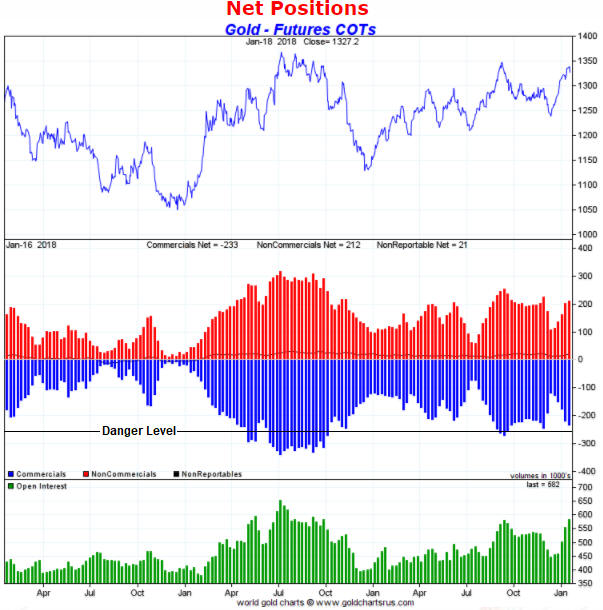
Turning to the price action, silver and the gold-mining indices
diverged bearishly from gold last week. This warns that a short-term price
top might have occurred a little sooner than expected. However, as
previously advised it will be reasonable to assume that the short-term
upward trend is intact while the gold price remains above its 20-day MA on
a daily closing basis. As illustrated by the following daily chart, this
MA has moved up to $1311 and is still rising.
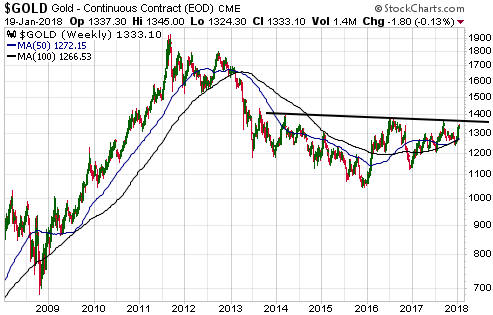
The weekly chart (see below) indicates that important resistance
begins at around $1360. It's likely that a weekly close above this
resistance and the 2016 high of $1377 would prompt significant
follow-through to the upside as speculators piled into long positions.
This important longer-term resistance at $1360-$1377 probably won't be
breached during the first quarter of 2018 but it probably will be breached
during the second quarter. If/when it happens the breach of this
resistance undoubtedly will spur very aggressive bullish predictions that
won't come close to being fulfilled.
Platinum
Breaks below obvious and important
support levels that are quickly reversed are reliable bullish signals. A
recent example is the short-lived break by the US$ platinum price below
intermediate-term lateral support during the first half of December. The
false downside breakout was followed by a fast rebound that is still in
progress.
In the 8th January Weekly Update we wrote that the platinum market had
done enough to confirm that an intermediate-term bottom was put in place
in December, but that the rally was a little stretched on a short-term
basis. A week later we wrote:
"Platinum has channel resistance
and 'round number' resistance at $1000. Above that there is important
lateral resistance at $1025-$1050. It is currently short-term 'overbought'
and testing the lower of the aforementioned resistance areas. We expect a
multi-week price peak at around this level or following a near-term spike
to $1025-$1050."
A near-term spike to $1025-$1050 is almost
complete.
We will be surprised if the platinum price manages to
break above $1050 before experiencing a multi-week correction. Note that a
routine correction would retrace about half of the rally from the December
low, implying that the mid-$900s would be a realistic target for the next
tradable low if a correction were to begin near the current price.
Gold Stocks
A weekly chart of the HUI is displayed
below.
The HUI's rally from its December low has been unimpressive
to date. It is yet to achieve a weekly close above the 80-week MA and has
not come close to testing important lateral resistance at 220. The rally
also hasn't done anything yet to differentiate itself from the multi-week
rebounds that occurred during 2017.
Although this is not what we expect, the lack of meaningful upward
momentum in the gold-mining sector since the December-2017 low creates the
risk that the next multi-week correction in the bullion market will take
the HUI to a new 12-month low. This risk would be eliminated by a weekly
close above 220 and greatly diminished by even a test of 220.
Depending on personal money-management considerations such as the extent
of existing exposure, some selling of gold-mining stocks could be
appropriate in the near-term. That will especially be so if a rise in the
gold price to around $1360 fails to generate much additional enthusiasm
for gold mining stocks.
We can't single out any TSI gold stocks for
selling because none of them are close to being fully valued and in most
cases they are also not close to being short-term 'overbought'. We are
simply making the general suggestion that a reduction in exposure to the
gold sector could make sense for investors who presently have substantial
exposure.
The Currency Market
2018 forecast for the currency market
The expectations we had for the currency market at the start of last
year turned out to be wide of the mark. We expected the Dollar Index (DX)
to begin the year will a decline lasting up to three months and to then
rise to a major high during either the second or the third quarter. The
year kicked off as envisaged, but rather than being a downward correction
within a bull market the Q1-2017 decline proved to be the first leg of a
bear market.
This year has started with speculators extremely
bearish on the US$ relative to the euro (the DX is dominated by the
US$/euro exchange rate). It has also started with a downside breakout in
the DX (a break below the September-2017 low). The fact that the breakout
wasn't quickly negated suggests that it was genuine and will be followed
by additional weakness in the DX over the months ahead, despite the
sentiment situation. The sentiment extreme in the currency market, like
the sentiment extreme in the US stock market, warns of a significant
first-quarter correction but not a major reversal.
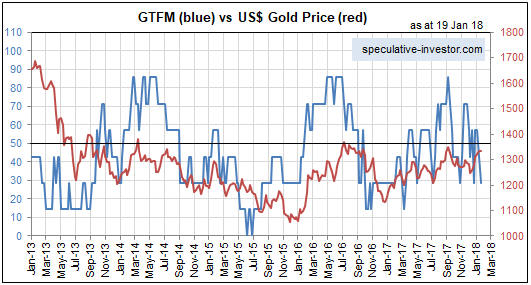
According to our
currency fundamentals model the fundamental backdrop is finely balanced at
the moment. Our model is currently DX-bullish, but both the interest-rate
and the relative-equity-strength inputs are very close to their
moving-average demarcation levels. This means that a small change could
flip the model to US$-bearish.
Despite the continuation of the
Fed's rate-hiking campaign in H1-2018 and the ECB still being at least a
year away from making its first rate hike, interest-rate differentials at
the long end could move in the euro's favour during the first half of 2018
just as they did during the first half of last year. This is mainly
because European bond yields are starting at much lower levels than the
equivalent US bond yields. For example, the US 10-year T-Note yield ended
last week at 2.64% whereas Germany's 10-year government bond ended the
week with a yield of only 0.57%.
In summary, we expect the DX's
downward trend to persist through the bulk of this year's first half. If
this happens then the anti-US$ sentiment will be even more extreme,
setting the stage for the DX to become very strong during the year's
second half.
Taking a broader view of the currency market, our
expectation that commodity prices will trend upward during H1-2018
combined with the A$'s bullish COT situation leads to a forecast that the
A$ and the C$ will be the strongest major currencies during the first half
of this year. Due to its bullish COT situation the Swiss Franc is also
poised to be relatively strong during the first half of this year.
During the second half of the year, substantial declines in the commodity
and equity markets will, we think, lead to the A$ and the C$ being among
the weakest major currencies and the Yen being the strongest.
Current Market Situation
Last
week there was a small additional rise in the euro and a small additional
decline in the Dollar Index (DX). It was an uneventful week and did not
provide any evidence that the DX's short-term downward trend has ended.
Consequently, the price action suggests that the DX will drop to a new
multi-year low within the next two weeks, with or without a few more days
of consolidation in the 90-91 range.
At the same time, speculative sentiment remains stretched in the
anti-US$/pro-euro direction by a sufficient amount to fuel a multi-week
rebound in the DX and pullbacks in most other currencies. The sentiment
extreme is evidenced by the COT numbers, which show that speculators in
currency futures have by far their largest-ever net and gross long
positions in the euro.
We expect that even if the DX extends its
recent sharp decline over the coming 2-3 weeks it will trade at 92 before
the end of Q1.
Updates
on Stock Selections
Notes: 1) To review the complete list of current TSI stock selections, logon at
http://www.speculative-investor.com/new/market_logon.asp
and then click on "Stock Selections" in the menu. When at the Stock
Selections page, click on a stock's symbol to bring-up an archive of
our comments on the stock in question. 2) The Small Stock Watch List is
located at http://www.speculative-investor.com/new/smallstockwatch.html
![]() Company
news/developments for the week ending Friday 19th January 2018:
Company
news/developments for the week ending Friday 19th January 2018:
[Note: AISC = All-In Sustaining Cost, FS = Feasibility Study, FY =
Financial Year, IRR = Internal Rate of Return, ISR = In-Situ Recovery,
MD&A = Management Discussion and Analysis, M&I = Measured and Indicated,
NAV = Net Asset Value, NPV(X%) = Net Present Value using a discount rate
of X%, P&P = Proven and Probable, PEA = Preliminary Economic Assessment,
PFS = Pre-Feasibility Study]
*Alkane Resources
(ALK.AX) advised that it has produced high-purity hafnium dioxide
products at its demonstration pilot plant using a proprietary process to
separate hafnium from zirconium. This is important because a) there may be
a global shortage of hafnium over the next few years, b) ALK's
construction-ready Dubbo Project (DP) is slated to produce 25 tpa of
hafnium, and c) although hafnium is expected to be a relatively minor part
of the DP's overall output, at the current hafnium price the
aforementioned production would result in annual revenue of about US$40M
for ALK.
The next major market-moving news from ALK is expected to
be the results of the modular construction study for the DP project. This
was scheduled to be complete before the end of 2017 but has been delayed
to Q1-2018.
*Blackham Resources (BLK.AX)
has provided the long-awaited details of its new recapitalisation plan,
the earlier plan having failed due to the withdrawal of Pacific Road
Capital (PRC). Although the new plan results in even greater per-share
value destruction, in one way it is better than the previous plan. This is
because the new plan enables shareholders who are eligible to participate
in the equity portion of the refinancing arrangement to largely avoid
having their stakes diluted, whereas the previous plan did not (the
previous plan involved PRC being issued a massive quantity of low-priced
options).
Here are the new plan's salient details:
-
Replacement of the A$14.3M Orion term loan that was due to be repaid this
month by a loan from MACA (BLK's primary mining contractor) under which
the first repayment isn't due until March-2019.
- An
underwritten A$36M Entitlement Issue (EI) with Hartleys Ltd. acting as the
lead underwriter.
- The EI will give eligible shareholders
the right to buy 5 new shares at A$0.04 for every 2 shares held at 24th
January (the day before the shares trade 'ex' the EI rights). Also, 1 free
January-2019 option with an exercise price of A$0.08 will be issued with
every 2 new shares. For example, an eligible shareholder with 20,000
existing shares would have the right to buy 50,000 new shares at 0.04
each, and if this right was taken up in full the shareholder would also
receive 25,000 January-2019 A$0.08 options.
- When small
Australian companies do these entitlement issues it is normal that only
shareholders with registered addresses in Australia or New Zealand are
eligible to participate. If that's the case here (BLK hasn't yet specified
if it is) then shareholders with addresses outside Australia-NZ would not
receive the EI rights associated with their shares. Instead, an attempt
would be made by an appointed broker to sell these rights on the ASX. The
proceeds of any sale would then be credited to the brokerage account of
the non-eligible shareholder.
- Eligible shareholders who do
not wish to exercise their rights would also have the opportunity to sell
their rights on the market. It is expected that the rights will trade on
the ASX from 30th January until 5th February.
- If the EI is
successfully completed then for TSI record purposes it will be assumed
that the EI rights were exercised. The BLK January-2019 option will be
added to the TSI List.
- The options are expected to trade
on the ASX and, depending on price, could be a worthwhile speculation. We
will discuss the merits of these options in a TSI commentary closer to the
time at which they start to trade (mid-February or later).
-
Upon completion of the EI, BLK will have net debt of about A$21M and a
share count of 1257M.
BLK reports that it is currently producing
gold at the rate of about 85K-oz/year at an AISC of A$1100-$1200/oz
(US$870-$950/oz). This constitutes a big improvement over last year's
performance, but the per-share value has collapsed -- thanks to the
massive addition of new 4c shares -- even assuming that this improved
production rate will be sustained.
Making the assumption that the
new recapitalisation plan is completed, we estimate that a BLK share has a
fair valuation range of A$0.07-A$0.11. If the company achieves its
guidance and there is no change in the A$-denominated gold price, then in
a year from now the fair value will rise to A$0.13 due to the repayment of
debt. Note that these figures don't allow anything for the project's
expansion potential.
*Golden Arrow Resources (GRG.V)
has a 25% stake in Puna Operations, the company that owns the
Pirquitas-Chinchillas silver-lead-zinc project in Argentina. During the
first half of this year the project's production will result solely from
the processing of stockpiled ore at Pirquitas, but the first ore from
Chinchillas should become available for processing during the second half.
Total silver production is expected to be 3.0M-4.4M ounces in 2018 and
increase to around 8M ounces in 2019 (GRG's share is 25% of these
figures).
Development of the Chinchillas mine is estimated to
require an additional US$70M of capital expenditure, which means that GRG
will have to pony up about US$17.5M (C$22M). This, we think, will
necessitate an equity financing of around C$10M at some point over the
next 6 months.
*Premier Gold (PG.TO)
reported that its 2017 gold production was 139.7K ounces. This is at the
top end of the company's upwardly-revised guidance range and is therefore
a good result.
As expected, 2018 production is going to be much
lower due to the completion of mining at the Phase 2 open pit at the South
Arturo project (Nevada). 2018 guidance is for gold production of 85K-95K
ounces at an AISC of US$800-$850/oz, with almost all of the production
coming from the Mercedes mine in Mexico.
At South Arturo, stripping
of the Phase 1 pit will commence around mid-year and development of the El
Nino underground mine is scheduled to begin in the third quarter. These
developments should ensure that South Arturo returns to being a
significant contributor to PG's total production during 2019-2020.
PG is a relatively low-risk junior gold producer with substantial in-built
growth potential.
*US Gold (USAU) made a
strange financing announcement last Thursday that was immediately followed
by a large decline in the stock price. The company announced that it was
selling $5M of shares of its Series E convertible preferred stock in a
non-brokered registered direct offering, but didn't state the price at
which the preferred shares could be converted into common shares. It also
announced the sale of warrants to purchase an aggregate of 1.25M shares of
common stock at an exercise price of $3.30 per share with a three-year
term, but didn't clarify how or if the warrants were related to the
preferred shares. As a result, USAU's management won the prize for the
most confusing financing announcement of the past 12 months.
The
details of the financing became clear the next day when a
Prospectus Supplement was filed with the SEC. This document specifies
that the conversion price is US$2.00 and that the warrants are being
issued to the buyers of the preferred shares.
In effect, USAU is
issuing 2.5M units at US$2.00 with each unit comprising one share and half
a $3.30 warrant.
The stock market's dramatic negative reaction to
the financing news on Thursday was due to the company effectively issuing
new shares at $2.00 at a time when the market price of the shares was
$3.10. We suspect that the unusually-large discount was caused by the
financing deal having been agreed 2-3 weeks ago when the market price was
well below $2 (because they rank ahead of common shares, preferred shares
will often be issued at a premium to the market). In other words, it's
likely that a large discount emerged due to the stock price approximately
doubling in the short period between the terms of the financing being
agreed and the announcement being made.
![]() List
of candidates for new buying
List
of candidates for new buying
From within the ranks of TSI
stock selections the best candidates for new buying at this time, listed
in alphabetical order, are:
1) ALK.AX (last Friday's closing price:
A$0.34)
2) EGD.V (last Friday's closing price: C$0.34)
3)
ESM.TO (last Friday's closing price: C$1.28)
4) NSU (last Friday's
closing price: US$2.36)
5) PRQ.TO (last Friday's closing price:
C$1.52)
The above list is limited to five stocks. It will sometimes
contain less than five, but it will never contain more than five
regardless of how many stocks are attractively priced for new buying.
Chart Sources
Charts appearing in today's commentary
are courtesy of:
http://stockcharts.com/index.html
http://www.goldchartsrus.com/
http://www.barchart.com/