


-- Weekly Market Update for the Week Commencing 22nd February 2016
Big Picture
View
Here is a summary of our big picture
view of the markets. Note that our short-term views may differ from our
big picture view.
The BULL market in US Treasury Bonds
that began in the early 1980s ended in early-2015, but there will be many years
of topping action in bond prices and bottoming action in bond yields before
major new trends get underway. (Last update: 29 June 2015)
The stock market, as represented by the S&P500 Index,
commenced
a secular BEAR market during the first quarter of 2000, where "secular
bear market" is defined as a long-term downward trend in valuations
(P/E ratios, etc.) and gold-denominated prices. This secular trend will bottom sometime between 2018 and 2020.
(Last update: 29 June 2015)
A secular BEAR market in the
US
Dollar
began during the final quarter of 2000 and ended in July of 2008. This
secular bear market will be followed by a multi-year period of range
trading.
(Last
update: 09 February 2009)
Gold commenced a
secular bull market relative to all fiat currencies, the CRB Index,
bonds and most stock market indices during 1999-2001.
This secular trend will peak sometime between 2018 and 2020.
(Last update: 29 June 2015)
Commodities,
as represented by the CRB Index, commenced a
secular BULL market in 2001 in nominal dollar terms. The first major
upward leg in this bull market ended during the first half of 2008, but
a long-term peak won't occur until 2018-2020.
(Last
update: 29 June 2015)
Copyright
Reminder
The commentaries that appear at TSI
may not be distributed, in full or in part, without our written permission.
In particular, please note that the posting of extracts from TSI commentaries
at other web sites or providing links to TSI commentaries at other web
sites (for example, at discussion boards) without our written permission
is prohibited.
We reserve the right to immediately
terminate the subscription of any TSI subscriber who distributes the TSI
commentaries without our written permission.
Outlook Summary
Market
|
Short-Term
(1-3 month)
|
Intermediate-Term
(6-18 month)
|
Long-Term
(2-5 Year)
|
|
Gold
|
N/A |
Bullish
(26-Mar-12) |
Bullish
|
|
US$ (Dollar Index)
|
N/A |
Neutral
(22-Jun-15) |
Neutral
(19-Sep-07) |
|
US Treasury Bonds (TLT)
|
N/A |
Bearish
(19-Oct-15)
|
Bearish |
|
Stock Market
(DJW)
|
N/A |
Bearish
(30-Dec-15) |
Bearish
|
|
Gold Stocks
(HUI)
|
N/A |
Bullish
(23-Jun-10) |
Bullish
|
|
Oil |
N/A |
Neutral
(26-Oct-15) |
Bullish
|
|
Industrial Metals
(GYX)
|
N/A |
Neutral
(09-Nov-15) |
Bullish
(28-Apr-14) |
Notes:
1. Our short-term expectations are discussed in the commentaries, but except in
special circumstances we won't attempt to assign a "bullish", "bearish" or
"neutral" label to these expectations.
2. The date shown below the current outlook is when the most recent outlook change occurred.
3. "Neutral" means that we think risk and reward are roughly in balance with respect to the timeframe in question.
4. Long-term views are determined almost completely by fundamentals and intermediate-term views
are determined by a combination of fundamentals, sentiment and technicals.
Last week's posts at the TSI Blog
There is nothing inherently wrong with market manipulation
Changes in gold location say nothing about the gold price
Can a US recession occur without an inverted yield curve?
Long-term price targets
are meaningless
Bullish pundits routinely tout
very high long-term price forecasts. Although less common, there are also
bearish pundits who regularly tout very low long-term price forecasts.
Furthermore, the touting of extremely high or extremely low price targets seems
to be more common with gold and silver than with any other market. For example,
even during the precious-metals depression of the past year it wasn't difficult
to find predictions that the gold price will reach $5000/oz or more within the
next few years. Such predictions are always meaningless, although they are a
tried and true method of generating subscription revenue.
There are always a myriad of factors affecting price. Since it is impossible to
not only take all of these factors into account but also to predict how each
factor will change in the future, nobody has a clue what the gold price or the
price of anything else will be in a few years' time. Of course, the long-term
price predictions of some people will end up being correct for the same reason
that completely random predictions will sometimes be correct.
One of the unpredictable factors is the changing value of the money in which
prices are expressed. What use, for example, is a forecast that gold is going to
US$5000/oz in a certain number of years unless there is a way of knowing what
the purchasing power of a dollar will be at that future time. To explain what we
mean we point out that a rise in the nominal gold price to $5000/oz by some
future time will represent a DECLINE in the real worth of gold if the price of a
loaf of bread rises to $30 over the same period.
So, whenever you see/hear a prediction that the gold price is going to be 'X'
thousand dollars an ounce within 'Y' years, just laugh and move on.
The Fed is now expected
to do nothing
A report put out by the Fed a
couple of months ago predicted that there would be four 0.25% hikes in the Fed
Funds Rate (FFR) in 2016, but traders operating in the interest-rate futures
market never bought into that forecast. According to the price of the
December-2016 Fed Funds Futures (FFF) contract, at the point of maximum
interest-rate bullishness late last year 'the market' was expecting 2-3 Fed rate
hikes in 2016. In other words, two months ago there was a significant gap
between what the Fed was expecting to do and what 'the market' was expecting the
Fed to do. The gap is now much wider.
The Fed has not yet officially backed away from its 'four rate hikes' forecast,
but according to the current price of the December-2016 FFF contract (see chart
below) 'the market' now expects the number of 2016 rate hikes to be zero or one,
with the odds slightly favouring the former. In other words, traders operating
in the interest-rate-futures market are now collectively of the opinion that
there will be NO Fed rate hikes this year.
This is a remarkable change in interest-rate expectations, and all it took to
bring about the change was an 8% drop in the stock market and a decision by the
Bank of Japan to set a negative interest rate on a small portion of the reserves
held by Japanese banks.
It doesn't take much imagination to figure out what will happen to the Fed's
interest-rate plans and market expectations regarding the Fed's likely actions
if the S&P500 Index breaks solidly below its January low and the economic data
start pointing more definitively towards recession. It doesn't take much
imagination because to become a central banker you must believe that the key to
a stronger economy is more borrowing and spending. What will happen is that
negative interest rate policy (NIRP) will be 'on the table' in the US, although
we doubt that it will ever actually be implemented.
The world's most powerful central bankers have dug themselves into a giant hole
and they strongly believe -- because this is what their models and Keynesian
theories tell them -- that the solution is to keep digging.
The Stock Market
The US
The S&P500 Index (SPX) pulled back a little over the final two days of last
week. This didn't change anything.
There is short-term lateral resistance at 1950 that in a couple of days will
coincide with the falling 50-day MA. It's a good bet that this resistance will
soon be tested. More important resistance lies at 1990-2000. What's the
probability of this higher resistance being tested prior to the resumption of
the longer-term bearish trend?
We don't know the probability, but clues regarding the possible extent of a
continuing SPX rebound from the February low can be found in the two measures of
sentiment discussed below.
The following chart shows the S&P100 Index (OEX), the 10-day MA of the equity
put/call ratio and the 10-day MA of the OEX put/call ratio. The equity put/call
ratio indicates the public's (the dumb money's) concern about downside risk and
the OEX put/call ratio indicates the professionals' (the smart money's) concern
about downside risk, with a high put/call ratio implying high concern and a low
put/call ratio implying low concern.
The chart tells us that during November-December the smart money was worried
about downside risk while the dumb money was complacent. AFTER the market
tanked, the dumb money became very worried about downside risk and the smart
money became less concerned than usual.
At the end of last week the dumb money was still very worried and the smart
money was relatively unconcerned. The put/call situation therefore points to
higher prices over the weeks ahead.
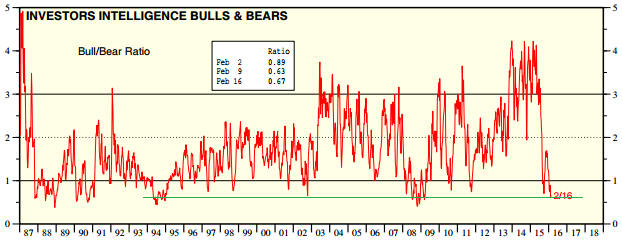
The other measure of sentiment we'll deal with is the weekly Investors
Intelligence survey.
The following chart from Yardeni.com shows that the Investors Intelligence
Bull/Bear ratio recently reached an unusually low level. In fact, during the
week before last the Bull/Bear ratio reached a level that over the past 20 years
was only exceeded near the crescendo of the 2008 crash.
The sentiment situation suggests that we should be open to the possibility of a
meaningful rally over the coming 2 months. For instance, although we don't
expect the rally to go this far it is not inconceivable that the SPX will move
all the way back to the vicinity of its December high before the next short-term
downward trend gets underway.
The sentiment situation also suggests that there is very little chance of the
SPX dropping well below its January-February double bottom within the next few
weeks. The double bottom could be briefly undercut, but it would probably
require bearish sentiment to break all records for the market to drop more than
a few percent below this level in the near future.
The one thing that could possibly cause bearish sentiment to break all records
and lead to a sharp decline to well below the January-February double bottom is
a dramatic escalation in the war raging in and around Syria. In particular, if
Turkey and Saudi Arabia invade Syria then those two countries will find
themselves at war with Russia and all bets will be off.
For safety reasons (to partially hedge the long exposure to non-gold commodity
stocks that we've begun to build) we purchased about 25% of what we would
consider to be a full position in EEM put options shortly after the start of
trading last Thursday, but we probably won't add to this position anytime soon.
For now, it makes sense to give the benefit of the doubt to the bullish side.
This week's
significant US economic events
[Notes:
1) The most important events
(to the markets) are shown
in bold. 2) A list of global economic events can be found
HERE]
| Date |
Description |
| Monday
Feb 22 |
No important events
scheduled |
| Tuesday
Feb 23 |
Existing Home Sales
Case-Shiller Home Price Index
Consumer Confidence |
| Wednesday
Feb 24 |
New Home Sales |
| Thursday
Feb 25 |
Durable Goods Orders |
| Friday
Feb 26 |
Q4 GDP (revised)
Personal Income and Spending
Consumer Sentiment |
Gold and the Dollar
Gold
The gold price plunged to the low-$1190s last Tuesday and then rebounded. The
price pattern didn't change over the final two days of last week, so the
following comment from the 17th February Interim Update remains applicable:
"There is currently no way of telling whether this sharp decline [to around
$1190] was a routine pullback to 'test' the preceding upside breakout prior to
the resumption of the rally or the start of a correction that will run for at
least a few weeks. A daily close below $1190 would point to the latter."
According to the latest data, gold's Commitments of Traders (COT) situation
remains neutral (it was bullish until two weeks ago and has since been neutral).
What we mean is that the speculative net-long position has risen to the point
where the COT situation is no longer a tail-wind for the US$ gold price, but it
hasn't yet risen far enough to become a head-wind.
Although it is not something we would bet on, with support at $1190 having
passed its first test and with the COT situation not yet bearish a quick move to
a new high for the year is a realistic possibility. Round-number resistance at
$1300 and the January-2015 peak at $1308 will be obvious near-term targets if
the February high of $1264 is breached.
Silver
The optimism about silver's price prospects is nothing if not stubborn and the
breathlessly-bullish commentary on the silver market is nothing if not
persistent.
Every year, without fail, stories get circulated about a looming global silver
shortage. These stories seem to start when someone walks into a coin shop in a
town somewhere (usually in the US) and discovers that the shop is temporarily
out of silver coins. This information is then passed onto someone else who
writes an article claiming that the world is running short of silver, which
leads to widespread speculation that a silver-price moon-shot is about to
happen. The problem is that if the speculation is not supported by the
underlying supply-demand situation for physical silver, a situation that
absolutely cannot be understood by visiting coin shops, it will not lead to a
sustained price advance.
Over the past three weeks the bullish speculation about silver's prospects has
ramped up, as it almost always does whenever the gold price rallies, but as has
consistently been the case over the past couple of years the speculation has not
been supported by the underlying supply-demand situation for physical silver. We
know that this is the case because the increase in the speculative net-long
position in silver futures was large in comparison with the increase in price.
To put it another way, it took a disproportionately large increase in
speculative buying in the futures market to lift the price.
As illustrated by the red and blue bars moving beyond the edges of the box drawn
on the following chart, silver's short-term COT situation is now clearly
bearish. This should be viewed as a red flag, but it doesn't guarantee
significant price weakness in the near future. It's possible, for example, that
a rise to a new high for the year in the gold price will prompt an additional
surge in silver-related speculation.
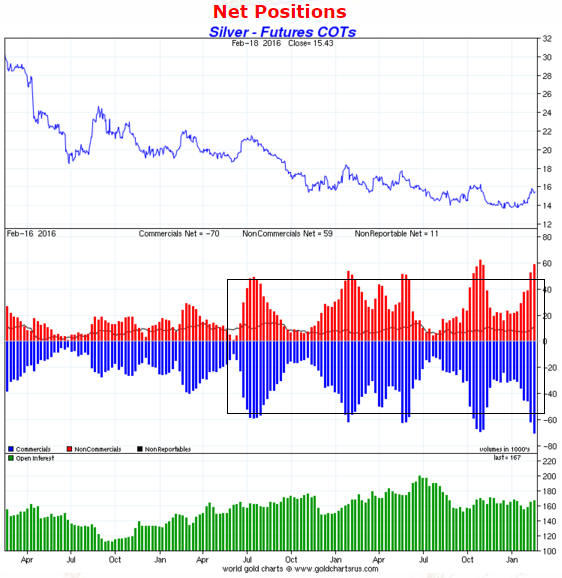
Chart source: www.sharelynx.com
In silver's favour is the evidence that gold has commenced a bull market and the
fact that the silver/gold ratio is very low by historical standards. The
silver/gold ratio will probably extend its multi-year downward trend over the
months ahead, but it probably won't get a lot lower.
Platinum
Apart from gold, which always warrants special treatment, platinum was the only
commodity we singled out for discussion in our 2016 Yearly Forecast. Here's how
we concluded the discussion: "We expect platinum to make a major bottom in US$
terms, inflation-adjusted terms and gold terms during the first quarter of
2016."
The first evidence that a major bottom is in place for platinum came a couple of
weeks ago when the price broke above the top of a well-defined 18-month channel.
More evidence of a major bottom will be in place if the platinum price holds at
or above $900 during a correction and then moves decisively above its 200-day
MA.
Gold Stocks
Current Market Situation
In the email sent to subscribers following Thursday's US trading session, we
wrote:
"In situations such as this it's best to take the evidence and review the
situation day by day. No short-term forecasting (that is, guessing) is
necessary. For example, if the HUI simply closes higher on Friday it will open
up the possibility of next week being similar to each of the past two weeks,
with a sharp 1-2 day pullback early in the trading week followed by a quick move
back to or above the year's high. Alternatively, a lower close on Friday
followed by a second lower close next Monday would indicate that a short-term
top was probably in place."
There was a small decline in the HUI on Friday. This tells us nothing in
isolation, but if it is followed by a significantly larger decline on Monday
then we will have evidence of a short-term top.
With regard to price levels that would have to be breached to confirm a
short-term top, for the HUI it's 140 (see chart below). This is more than 10%
below the current price and is therefore too low for practical purposes.
However, the XAU, by virtue of its relative weakness over the past several
months, is closer to important support and would therefore have to fall by a
lesser amount to confirm a short-term reversal.
In the XAU's case (see chart below), critical daily-closing support lies at
57-58. The lower end of this support range is only about 5% below the current
price, which means that it is high enough to act as a timely indicator of a
downward reversal. That is, it would be reasonable to interpret a daily XAU
close below 57 as confirmation that a short-term top is in place.
The gold-mining indices remain very 'overbought' on a short-term basis, but the
evidence of a long-term bullish reversal is continuing to build-up. For one
example, the HUI has just achieved a second weekly close above its 80-week MA.
For another example, at the same time as it points to near-term downside risk,
the unusual extent to which the HUI has become stretched to the upside on a
short-term basis is longer-term bullish. The explanation was outlined as follows
in last week's Interim Update:
"Although the above chart indicates an 'overbought' extreme and suggests that
a correction will soon begin (if it hasn't already), it also supports the view
that a cyclical bull market has started. The reason is that the only times in
the past that the HUI got close to being as stretched to the upside on a
short-term basis as it was last Friday was during the first 6 months of the
multi-year rally that began in November-2000 and the first few months of the
multi-year rally that began in October-2008."
It will probably take a decline to the vicinity of the HUI's 50-day MA to create
the next sector-wide short-term buying opportunity, but in the meantime there
will be opportunities to buy individual gold stocks.
What to do?
The primary focus at this time should be on raising cash by gradually scaling
out of stocks that have moved rapidly upward over the past several weeks, while
maintaining 'core' exposure to the gold sector. Unless you sell into the
periodic surges you won't be in a position to buy during the subsequent purges.
At this stage, however, we can't rule out the possibility of an over-stretched
market becoming even more so or the possibility that the overbought condition
will be worked off via a choppy sideways consolidation. In either of these
cases, the gold stocks that are likely to outperform are the ones that offer
substantial leverage to changes in the gold price and are still at depressed
levels. Three examples are Orvana Minerals (ORV.TO), Resolute Mining (RSG.AX)
and Timmins Gold (TGD). RSG and TGD are members of the TSI List. ORV is not a
TSI stock selection, but it has been discussed at TSI over the past few months
(refer to the 21st December Weekly Update for the most recent note).
The above-mentioned stocks are current producers that transition from being
loss-making or marginal at $1150-$1200/oz to being profitable at $1250-$1300/oz.
This transition dramatically changes the value of the company.
Of course, if it starts to look like gold's rally is over then these stocks will
quickly give up their gains.
The Currency Market
The chart displayed below compares the SPX/MSWORLD ratio with the Dollar Index
over the past 15 years. MSWORLD is a proxy for global equity performance
excluding the US, so the SPX/MSWORLD ratio is an indicator of US equity
performance relative to the performance of equities in the rest of the world.
It is clear from the chart that on an intermediate-term basis the Dollar Index
usually trends in the same direction as the SPX/MSWORLD ratio. Moreover, the
chart also shows that the SPX/MSWORLD ratio tends to lead the Dollar Index at
important turning points. In other words, it shows that relative strength in US
equities tends to be followed by strength in the Dollar Index and relative
weakness in US equities tends to be followed by weakness in the Dollar Index.
A downward correction in the SPX/MSWORLD ratio during the first quarter of last
year has been followed by a strong rally to new highs. The following chart's
overarching message is therefore that the Dollar Index will break decisively
above its March-2015 peak sometime this year.
There's a good chance that the Dollar Index will trade at least a few points
above its March-2015 peak before this year is over. The main question is: will
the start of a rally to new multi-year highs be preceded by a decline to near
the bottom of the 12-month range (the low-90s)?
Based on the recent price action the answer to the above question is: yes, it
probably will be. However, all it would take to negate the recent short-term
bearish evidence is a weekly close above 97.5.
Unless the facts change in the meantime, our intermediate-term outlook for the
Dollar Index will shift from "neutral" to "bullish" following either a decline
to the low-90s or a weekly close above 97.5.
By the way, the Dollar Index is dominated by the USD/EUR exchange rate. A
bullish view on the Dollar Index therefore implies a bearish view on the euro,
but it doesn't necessarily imply a bearish view on other currencies. In
particular, we wrote in our 2016 forecast that we expected the Yen to be this
year's strongest major currency. That expectation is intact.
Updates
on Stock Selections
Notes: 1) To review the complete list of current TSI stock selections, logon at
http://www.speculative-investor.com/new/market_logon.asp
and then click on "Stock Selections" in the menu. When at the Stock
Selections page, click on a stock's symbol to bring-up an archive of
our comments on the stock in question. 2) The Small Stock Watch List is
located at http://www.speculative-investor.com/new/smallstockwatch.html
 Company
news/developments for the week ending Friday 19th February 2016:
Company
news/developments for the week ending Friday 19th February 2016:
[Note: AISC = All-In Sustaining Cost, FS = Feasibility Study, FY = Financial
Year, IRR = Internal Rate of Return, MD&A = Management Discussion and Analysis,
M&I = Measured and Indicated, NAV = Net Asset Value, NPV(X%) = Net Present Value
using a discount rate of X%, P&P = Proven and Probable, PEA = Preliminary
Economic Assessment, PFS = Pre-Feasibility Study]
*Dalradian Resources (DNA.TO) reported the results from the fourth
batch of holes from a 50,000m infill drilling program at its Curraghinalt gold
project in Northern Ireland. The purpose of this drilling program is to convert
Inferred resources to Indicated resources in support of a Feasibility Study
scheduled for completion in Q3-2016. As was the case with earlier results, the
latest drilling results included some good intercepts and appear to be
consistent with the resource estimate.
To date, the results associated with about 40,000m of the 50,000m program have
been released. The program's remaining holes are almost complete and will
probably be reported in a single batch within the coming 2 months.
If the figures in DNA's Oct-2014 PEA are in the right ballpark then DNA offers
very good value near its current share price assuming a gold price of $1200. In
fact, based on the PEA figures we can easily justify a C$2/share valuation for
DNA at the current gold price. However, the 'P' is in PEA for a good reason. The
economic analysis is Preliminary and might not be substantiated by the far more
rigorous Feasibility-level analysis. That, of course, is why you can currently
buy DNA shares in the C$0.80s.
*Evolution Mining (EVN.AX) published its half-year report for the
2016 Financial Year.
The company made what it refers to as an "underlying net profit" (the net profit
excluding acquisition-related charges) of A$108M. If we annualise this figure
and divide the result by the total share count (1463M) we get A$0.15/share.
Applying a 10-15 multiple to this net earnings figure gives us a fair value for
EVN of A$1.50-$2.25 per share.
This is consistent with our previously-expressed view that EVN is worth around
A$2.00/share at the current gold price.
The balance sheet included with the half-year report shows that EVN had A$25M of
working capital and long-term debt of A$409M at 31st December, for net debt of
A$374M. This is a comfortable amount of debt for a profitable 800K-oz/year gold
producer with a market cap of around A$2.6B (at A$1.80/share).
*Pretium Resources (PVG) advised that construction at the
Brucejack gold mine remains on track for commissioning in Q3-2017. PVG also
published its updated capital cost estimate for the mine. This is important new
information that was originally scheduled (by the company) to be provided in
Q4-2015.
The estimated capital cost has fallen by US$106M from US$747M to US$641M.
Looking at the details we see that the updated capex estimate includes a $145M
exchange-rate benefit and the transfer of $23M of cost from initial capital to
sustaining capital. It could therefore be said that the capital cost has
increased by $62M, but the increase has been more than offset by a fortuitous
movement in the C$/US$ exchange rate and the shifting of some cost from pre- to
post-production.
In any case, it's good news that the mine is now expected to cost significantly
less than originally estimated.
The lower capex and other changes have improved the economics of the Brucejack
project. Assuming a gold price of $1100/oz and a silver price of $14/oz, the
project is now estimated to have an NPV(5%) of US$1.55B. This compares to the
NPV of $1.45B estimated in the June-2014 FS assuming the same gold price and a
$3/oz higher silver price.
Taking into account the revised capex estimate and the amount of working capital
that will be needed between now and when the mine is expected to become
cash-flow positive, PVG will need to raise about US$100M. This will most likely
happen via an equity financing. Furthermore, although PVG probably won't need to
raise the additional money until next year, it's possible that the recent
relative sluggishness of PVG's share price is at least partly due to
anticipation of a sizable equity financing happening in the near future. The
recent relative weakness in PVG's share price could also be related to the
on-going concern regarding the validity of the Brucejack resource estimate.
Assuming that PVG has to issue 20M new shares, the Brucejack economics presented
in last week's press release suggest a valuation of about US$9.40/share at a
gold price of $1100/oz, about US$11.30/share at a gold price of $1200/oz, and
about US$14.30/share at a gold price of $1400/oz. Given the uncertainty about
the resource estimate and therefore the published economics, it is not
unreasonable to apply a 50% discount to these figures. Doing so gives us a fair
value estimate for PVG of US$5.50-$6.00 (C$7.50-$8.20) at the current gold
price. PVG ended last week at US$5.13 (C$7.05).
*Ramelius Resources (RMS.AX) published its half-year report for
the 2016 Financial Year.
The 6-month after-tax profit was A$21.9M, which was slightly higher than we
estimated last week. Annualising the 6-month profit and dividing the result by
the total share count of 470M gives us an earnings-per-share estimate of A$0.092
for the current financial year. If we then assume that the company is worth 5-10
times its current annual earnings we arrive at a back-of-the-envelope valuation
range of A$0.46-A$0.92.
As stated last week, we think it makes sense to use the low (5X) earnings
multiple and, therefore, the lower end of the aforementioned valuation range.
The reason is that RMS's profitability currently depends on adding high-grade
ore from small satellite deposits to the ore obtained from its Mt Magnet mine.
As also stated last week, if we became confident that the company was going to
at least maintain its current level of production for several more years then we
would use a higher earnings multiple.
RMS has a strong balance sheet, with A$31.5M of working capital and no long-term
debt.
List
of candidates for new buying
From within the ranks of TSI stock selections the best candidates for new buying
at this time, listed in alphabetical order, are:
1) DNA.TO in the low-C$0.80s (last Friday's closing price: C$0.88)
2) FCG (last Friday's closing price: US$3.36)
3) IVN.TO (last Friday's closing price: C$0.66)
4) PRQ.TO (last Friday's closing price: C$3.00)
5) TGD at around US$0.20 (last Friday's closing price: US$0.22)
Note that the above list is limited to five stocks. It will sometimes contain
less than five, but it will never contain more than five regardless of how many
stocks are attractively priced for new buying.
Second
RGLD call option exited
From the email sent to subscribers after Thursday's US trading session:
"...for TSI record purposes we are going to exit the remaining Royal Gold (RGLD)
Jan-2017 $40 call option position at Thursday's closing price of US$11.00. Based
on our December entry at $4.90, the result was a profit of 125%. Traders who
scaled into the options during the weeks following our original buy suggestion
should have achieved a much higher profit result."
We will consider new long-dated gold-stock call options following a significant
correction.
Chart Sources
Charts appearing in today's commentary
are courtesy of:
http://stockcharts.com/index.html
http://www.barchart.com/
