|
-- Weekly Market Update for the Week Commencing 22nd March 2010
Big Picture
View
Here is a summary of our big picture
view of the markets. Note that our short-term views may differ from our
big picture view.
In nominal dollar terms, the BULL market in US Treasury Bonds
that began in the early 1980s will end by mid-2010. In real (gold)
terms, bonds commenced a secular BEAR market in 2001 that will continue
until 2014-2020. (Last
update: 09 February 2009)
The stock market, as represented by the S&P500 Index, commenced
a secular BEAR market during the first quarter of 2000, where "secular
bear market" is defined as a long-term downward trend in valuations
(P/E ratios, etc.) and gold-denominated prices. This secular trend will bottom sometime between 2014 and 2020. (Last update: 22 October 2007)
A secular BEAR market in the Dollar
began during the final quarter of 2000 and ended in July of 2008. This
secular bear market will be followed by a multi-year period of range
trading. (Last
update: 09 February 2009)
Gold commenced a
secular bull market relative to all fiat currencies, the CRB Index,
bonds and most stock market indices during 1999-2001. This secular trend will peak sometime between 2014 and 2020. (Last update: 22 October 2007)
Commodities,
as represented by the Continuous Commodity Index (CCI), commenced a
secular BULL market in 2001 in nominal dollar terms. The first major
upward leg in this bull market ended during the first half of 2008, but
a long-term peak won't occur until 2014-2020. In real (gold) terms,
commodities commenced a secular BEAR market in 2001 that will continue
until 2014-2020. (Last
update: 09 February 2009)
Copyright
Reminder
The commentaries that appear at TSI
may not be distributed, in full or in part, without our written permission.
In particular, please note that the posting of extracts from TSI commentaries
at other web sites or providing links to TSI commentaries at other web
sites (for example, at discussion boards) without our written permission
is prohibited.
We reserve the right to immediately
terminate the subscription of any TSI subscriber who distributes the TSI
commentaries without our written permission.
Outlook Summary
Market
|
Short-Term
(0-3 month)
|
Intermediate-Term
(3-12 month)
|
Long-Term
(1-5 Year)
|
Gold
|
Neutral
(10-Mar-10)
|
Bullish
(12-May-08)
|
Bullish
|
US$ (Dollar Index)
|
Neutral
(20-Jan-10)
| Bullish
(02-Nov-09)
|
Neutral
(19-Sep-07)
|
Bonds (US T-Bond)
|
Neutral
(18-Jan-10)
|
Bearish
(14-Dec-09)
|
Bearish
|
Stock Market (S&P500)
|
Bearish
(08-Mar-10)
|
Bearish
(11-May-09)
|
Bearish
|
Gold Stocks (HUI)
|
Neutral
(08-Mar-10)
|
Neutral
(16-Sep-09)
|
Bullish
|
| Oil | Neutral
(28-Oct-09)
| Bearish
(01-Mar-10)
| Bullish
|
Industrial Metals (GYX)
| Bearish
(21-Sep-09)
| Bearish
(25-May-09)
| Neutral
(11-Jan-10)
|
Notes:
1. In those cases where we have been able to identify the commentary in
which the most recent outlook change occurred we've put the date of the
commentary below the current outlook.
2. "Neutral", in the above table, means that we either don't have a
firm opinion or that we think risk and reward are roughly in balance with respect to the timeframe in question.
3. Long-term views are determined almost completely by fundamentals,
intermediate-term views by giving an approximately equal weighting to
fundmental and technical factors, and short-term views almost
completely by technicals.
Watching prices too closely
Unless you happen to be
someone who makes a living by scalping returns based on intra-day
fluctuations in prices, no good can come from monitoring these
fluctuations. There is an old saying that battles are won/lost before
the first shot is fired, meaning that it's the planning that happens
before the battle that determines the outcome. When it comes to the
stock market, a trader who has done the appropriate amount of
planning/preparation will be able to place all buy and sell orders,
including any protective stops, prior to the start of the trading
session, and then check-in after the close of trading to see what
happened.
If you are not a professional day-trader and yet you regularly monitor
the intra-day price action, you will occasionally spot a money-making
opportunity that you wouldn't otherwise have been able to take
advantage of. However, the probability that you will consistently come
out ahead by employing such an approach is almost zero. One reason is
that when attempting to profit from intra-day moves you will often be
pitting yourself against the super-computers at firms such as Goldman
Sachs. Another reason is that you will end up fixating on the trees, or
on the tiny plants that grow between the trees, and will thus lose
sight of the forest. But most importantly, by reacting in knee-jerk
fashion to price fluctuations, rather than acting in accordance with a
carefully considered plan, you will make more mistakes.
When it comes to avoiding the problems caused by watching prices too
closely we have the advantage of being located 12 or 13 (depending on
the time of year) hours ahead of the major North American exchanges. As
a result, most of the action occurs while we are asleep. We generally
check the computer about half an hour into the US/Canadian trading day
(10PM or 11PM our time) to see how the markets opened, and then switch
off for the night. The next time we check is usually 2-3 hours after
the markets have closed, at which point we calmly begin to review what
happened and decide if we need to adjust any of our plans.
In addition to not watching the intra-day price action, it also makes
sense not to watch the people who watch the intra-day action. In other
words, there is probably nothing to be gained -- and potentially
something to be lost -- by spending time watching the play-by-play
coverage of the markets and the latest 'market-moving' events presented
by television networks. Watching CNBC et al may provide you with some
insight into current market sentiment, but there are much better ways
to assess sentiment than spending hours per day viewing TV programs
that spew forth reams of meaningless or false information. We can't
remember the last time we watched CNBC or something similar, but it was
probably more than 5 years ago.
In summary, whether you are trading or investing you should do so in a
planned way and block out as much 'noise' as possible. Spending a lot
of time watching intra-day price fluctuations and financial-news
television runs counter to both of these guidelines.
Measuring the money supply
We've addressed this issue several times, but it's important enough to
warrant some more attention. The reason is that getting the money
supply right is one of the keys to understanding where the economy and
the financial markets are headed.
The year-over-year growth rates of popular monetary aggregates M2 and
MZM are presently around 2%, which is near their lows of the past 15
years. Furthermore, M3, another popular monetary aggregate, has just
experienced the fastest decline in its growth rate in at least 40 years
and is now down by about 5% on a year-over-year basis. Note that the
Fed no longer reports M3, but unofficial M3 calculations and charts are
still available on the internet (at http://www.nowandfutures.com/key_stats.html,
for example). So, judging by M2, M3 and MZM the US is now in, or
bordering on, monetary deflation. However, TMS (True Money Supply) has
risen by more than 13% over the past 12 months.
On the surface, then, it looks like reasonable arguments could
simultaneously be made for monetary inflation and monetary
deflation/stagnation, but digging deeper reveals that M2, M3 and MZM
have components that are not money and that changes in these
non-monetary components are responsible for the apparent monetary
deflation/stagnation. The non-monetary components we are referring to
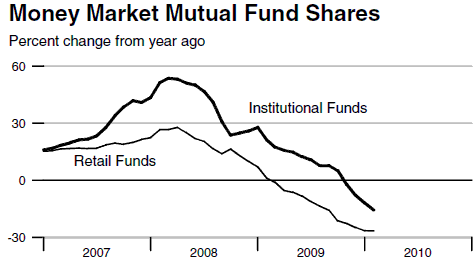
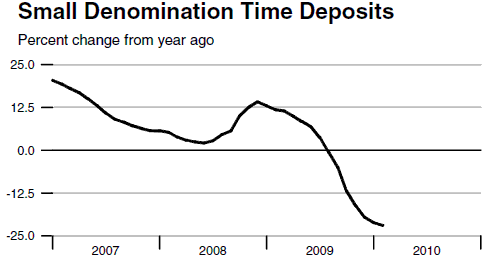
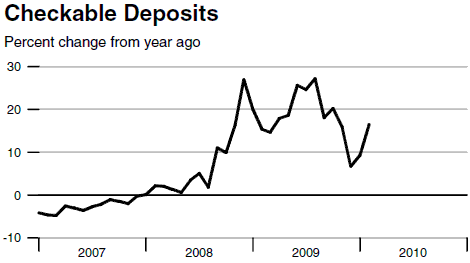
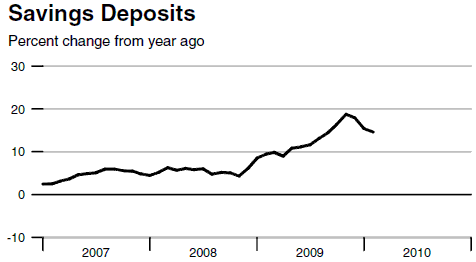
are Retail Money-Market Funds (included in M2, M3 and MZM),
Institutional Money-Market Funds (include in M3 and MZM), Small Time
Deposits (included in M2 and M3), and Large Time Deposits (included in
M3).
The first and second of the following four charts show the large
year-over-year declines in these non-monetary components, while the
third and fourth charts reveal substantial percentage increases over
the past year in things that are actually "money" (demand (checkable)
deposits and savings deposits). These charts were taken from the latest
monthly Monetary Trends report put out by the Federal Reserve Bank of
St. Louis.
To make sure everyone is
on the same page, here is why Money-Market Funds (MMFs) and Time
Deposits (TDs) should not be counted in the money supply:
MMFs are investments in income-paying securities, meaning that MMF
units must be sold in order to obtain money. The best way to explain is
via a hypothetical example. Assume that Bill withdraws $10K from his
bank account and deposits the money into his MMF account. Bill's MMF
then uses this money to purchase Treasury Notes from Bob, who deposits
the proceeds into his bank account. As you can see, the net result of
this transaction is the transfer of $10K from Bill's bank account to
Bob's bank account, with the MMF acting as an intermediary. No new
money is created, and yet the transaction will result in a $10K
increase in M2, M3 and MZM (because these money-supply measures include
MMF accounts in addition to bank accounts). Some time later, Bill
withdraws $10K from his MMF account and deposits the money into his
bank account. To facilitate the withdrawal, Bill's MMF sells $10K of
Treasury Notes to Fred that Fred pays for with money from his bank
account. The net result, therefore, is the transfer of $10K from Fred's
bank account to Bill's bank account, with the MMF again acting as an
intermediary. No money is destroyed, and yet the transaction will
result in a $10K reduction in M2, M3 and MZM.
TDs are loans to banks whereby the lender (the bank's customer), in
exchange for a higher interest rate, foregoes the right to access
his/her money on demand. For example, when Bill lends money to Bob the
money is temporarily transferred from Bill's money supply to Bob's
money supply. Bill no longer has access to the money. It's a similar
story when Bill opens a time deposit, except in this case he lends part
of his money supply to a bank.
As evidenced by the charts displayed above, there have been large
declines in MMFs and TDs over the past year. The reason, we think, is
that with interest rates so low there is almost nothing to be gained by
investing in MMFs or giving up immediate access to one's money by
placing it in a TD. By the same token, after interest rates begin to
trend upward it is likely that MMFs and TDs will become more popular,
causing M2, M3 and MZM to increase relative to TMS.
Another point worth mentioning is that there is some disagreement
amongst people who actually understand money as to whether savings
accounts should be counted as part of the money supply. The argument
against including them is that, like time deposits, they are loans to
banks.
To explain why we believe that savings accounts should be included
we'll first hark back to the following comment from last week's Interim
Update: "...commercial banks
generally make loans by creating new money out of nothing, not by
transferring part of the existing money supply to the borrower."
What this means is that a bank does not generate interest income by
lending out the money deposited in savings accounts; instead, it
creates new money. This is why the money in savings accounts is always
(for all intents and purposes) available on demand, and why, when you
use an Automatic Teller Machine, you will usually be given the choice
of withdrawing money from your checking account or your savings
account. In effect, most banks and their customers no longer
differentiate between checkable deposits and savings deposits in terms
of the ability to access the deposited funds on demand.
Note that a bank could theoretically insist on a waiting period prior
to honouring a request to withdraw money from a savings account, but
when was the last time you tried to withdraw money from your savings
account and were told by the bank "sorry, but your money is not
available right now". We suggest that any bank that began insisting on
a waiting period prior to releasing funds from savings accounts would
quickly be subject to an old-fashioned "run" and would soon find itself
in the hands of the Feds.
The final point we'd like to make is that if US central bankers pay
attention to M2, M3 and/or MZM then the slow year-over-year growth
rates of these aggregates could become part of the justification for
even greater efforts to inflate. That is, even though the money supply
is growing rapidly, if Bernanke and his cohorts believe that the money
supply is growing slowly, or not at all, then they could be encouraged
to double their efforts on the inflation front. Under the current
monetary system, nothing promotes inflation more effectively than fear
of deflation.
Reminder about the TSI Search Function
We regularly get emails
from subscribers asking for the date of a TSI commentary that dealt
with a particular topic. In most such instances the subscriber could
have found the information they were looking for using the TSI search
function.
The search function is at the bottom of the Market Analysis Menu Page (the first page seen after logging on at http://www.speculative-investor.com/new/market_logon.asp).
The Stock
Market
The NYSE Common-Stocks-Only
McClellan Oscillator (MO) is at an 'oversold' extreme when it drops to
-75 or lower. Prior to the past 12 months it generally only did this
during panics and major downturns, but over the past 12 months it has
routinely dropped as low as -75, and sometimes as low as -100, in
response to fairly minor corrections. In other words, the MO has tended
to become very 'oversold' very quickly.
The MO pattern of the past 12 months appears to be repeating at this
time. As depicted below, even though the NYSE Composite Index has just
experienced a minor 2-day pullback from a new 52-week high, the NYSE
Common-Stocks-Only MO has already dropped back to zero. The extension
of the pullback over the coming week could see the MO at yet another
'oversold' extreme.
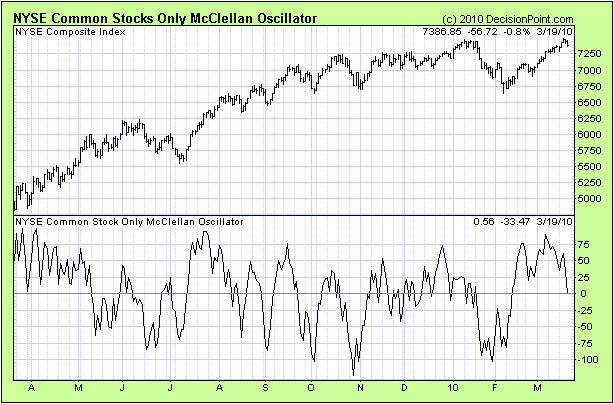
Our guess is that the
US stock market has commenced a 1-2 week pullback and that this
pullback will be followed, during the first half of April, by a move to
a new 52-week high. There are still no bearish divergences of
significance, except for the failure of credit spreads to confirm the
most recent new high in the stock market.
This week's
important US economic events
| Date |
Description |
Monday Mar 22
| No important events scheduled
| | Tuesday Mar 23 | Existing Home Sales
| | Wednesday Mar 24
| Durable Goods Orders
New Home Sales
| | Thursday Mar 25
| No important events scheduled
| | Friday Mar 26
| Q4 GDP (final)
Consumer Sentiment
|
Gold and
the Dollar
Gold Stocks
In last Tuesday's email alert we wrote: "...traders
could operate under the assumption that short-term upward trends have
resumed for the gold-stock indices and gold bullion unless the lows of
the past three trading days are breached on a daily closing basis. The
relevant lows are 409 for the HUI and $1097 for April gold."
Despite a pullback in the gold-stock indices over the final two days of
last week and a $20 decline in April gold on Friday, the aforementioned
levels were not breached. Also of note is that the gold-stock indices
declined by a smaller percentage than gold bullion on Friday, which is
a minor plus. Consequently, traders can continue to operate under the
assumption that short-term upward trends have resumed.
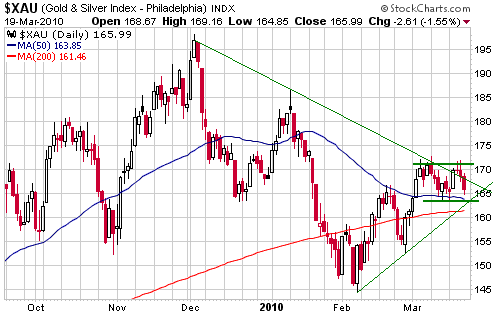
We should find out this week if the aforementioned assumption is
correct. The reason is that the XAU, which has been oscillating within
a 10-point range since the beginning of March, is now 'boxed in' on the
chart. What we mean is that it won't take much strength from here to
effect an upside breakout and it won't take much weakness to effect a
downside breakout. With reference to the following chart, a gain of
only 7 points would take the XAU above a downward-sloping trend-line
and lateral resistance, whereas a decline of only 4 points would take
the XAU below an upward-sloping trend-line and lateral support.
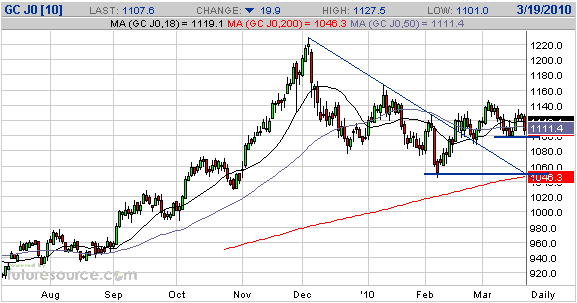
Gold
The US$ gold price has been in consolidation mode since early December
and has traded within a narrow range over the past 6 weeks. A move up
to the high-$1100s is still possible in the short-term, but only if
April gold holds above $1097 on a daily closing basis. Alternatively, a
daily close below $1097 would suggest that support near $1050 was going
to be tested prior to the start of a significant rally.
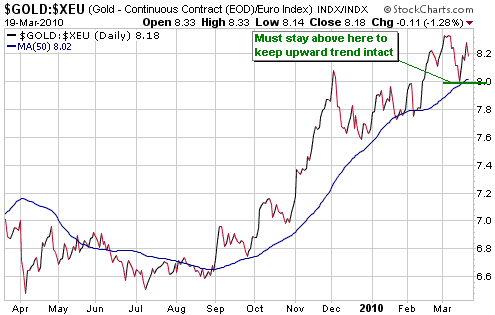
The euro-denominated
gold price (gold/euro) made a new all-time high earlier this month. On
a short-term basis it is therefore in a very different situation to the
US$ gold price.
The following chart shows gold/euro along with its 50-day moving
average. Once gold/euro establishes a consistent upward trend, such as
the one that got underway at the end of last August and continues to
this day, the first solid break below the 50-day moving average becomes
a reliable signal that the upward trend has ended. The 50-day moving
average is presently at 802 and is rising. Also, there is short-term
support at 800 defined by the low of the March pullback. Therefore, a
daily close below 795 would breach lateral support and create a
definitive break below the 50-day moving average.
Further to the above, a daily close below 795 in the euro-denominated
gold price would be a clear sign that the gold market's trend had
reversed downward. As things currently stand, the upward trend is
intact.
Currency Market Update
The Dollar Index might have broken out to the upside on Friday. It
certainly broke above the channel drawn on the following daily chart,
but we say "might have" broken out because other markets haven't yet
confirmed a breakout. For example, gold and the gold-stock indices held
above their recent lows.
Another consideration is that while we have been expecting the Dollar
Index to eventually break upward and resume its intermediate-term
rally, a breakout at this time doesn't mesh with our short-term
expectations for other markets. In particular, we have been expecting
that the next meaningful advance in the Dollar Index would begin after
the stock market peaked, but the stock market looks set to make new
52-week highs following a 1-2 week pullback.
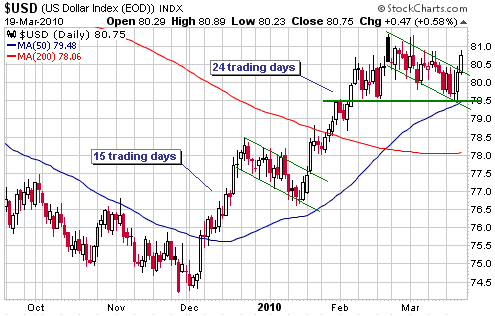
If last Friday's breakout is the 'real thing' then 85 is a reasonable
short-term target for the Dollar Index. Based on the lengths of the two
rallies that occurred since the end of last November (15 trading days
and 24 trading days), mid-to-late April is the most likely time for
this target to be reached.
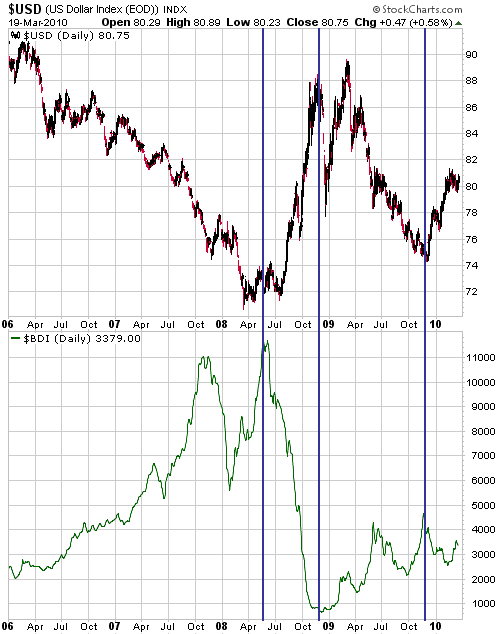
Important turning
points in the Dollar Index usually occur at roughly the same time as
important turning points in the Baltic Dry Index (BDI), with US$ highs
being associated with BDI lows and US$ lows being associated with BDI
highs. For example, the following chart shows that the US dollar's
Q2-2008 bottom was associated with a major high in the BDI; that the
November-2009 peak in the US$ was associated with a major BDI low; and
that the low made by the US$ late last year coincided with a high in
the BDI. If the Dollar Index has, indeed, resumed its intermediate-term
advance then the BDI will probably move to a new low for the year
within the next couple of months. To put it another way, the resumption
of the dollar's intermediate-term advance should be confirmed, in the
not-too-distant future, by a drop-off in international trade.
Considering that a
lot of international trade is conducted in US dollars, why should a
drop-off in such trade be linked to a strengthening US$? The answer
revolves around the fact that trade flows are dwarfed by investment
flows. When the global economy is strengthening, investment flows
towards the parts of the world that are perceived to offer the most
leverage to economic growth (Asia ex-Japan plus Latin America plus
commodity-producing regions, at this time) and away from the parts of
the world that are perceived to have the least amount of growth
potential (Japan and the US). These flows reverse when the global
economy begins to weaken.
Update
on Stock Selections
(Note: To review the complete list of current TSI stock selections, logon at http://www.speculative-investor.com/new/market_logon.asp
and then click on "Stock Selections" in the menu. When at the Stock
Selections page, click on a stock's symbol to bring-up an archive of our comments on the stock in question)
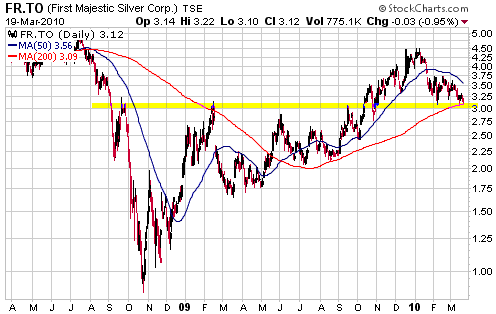
 First Majestic Silver (TSX: FR). Shares: 93M issued, 112M fully diluted. Recent price: C$3.12 First Majestic Silver (TSX: FR). Shares: 93M issued, 112M fully diluted. Recent price: C$3.12
FR, a junior silver producer based in Mexico, invested a lot of money
in mine construction and plant optimisation over the past two years.
The results of this investment should be reflected in production
increases and cost decreases in 2010.
Whether FR's production growth -- from 4M-oz/yr to 7M-oz/yr of silver
-- leads to substantial growth in the share price will depend on the
silver price and the general level of speculation in the gold/silver
sector of the stock market. However, we expect that FR's operational
results over the next few quarters will lend support to the stock.
The following chart shows that FR broke upward from a large basing
pattern last October-November and continued its advance into year-end.
It then commenced a downward correction that has taken it back to the
top of the former base and the 200-day moving average. This is a likely
price area for a correction low.
In our opinion, FR is suitable for new buying near Friday's closing price of C$3.12.
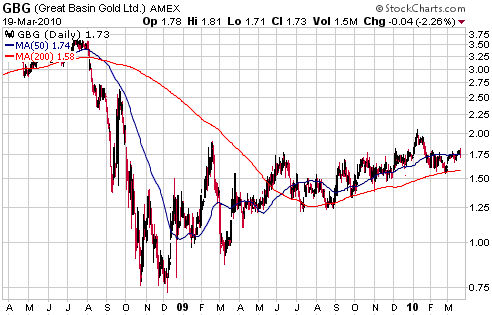
Great Basin Gold (AMEX and TSX: GBG). Shares: 333M issued, 438M fully diluted. Recent price: US$1.73
GBG has two development-stage gold projects -- the Hollister project in the US and the Burnstone project in South Africa.
At Hollister the company has now been "trial mining" for almost two
years at the rate of about 80K ounces/year. Because this mining is
defined as "trial" the company does not report a per-ounce production
cost; rather, the costs of extracting the gold are lumped under
"pre-development expenses". Hollister is expected to produce 120K
ounces this year and SHOULD be close to moving from "trial mining" to
"commercial production", but GBG's management has not stipulated when
this will happen.
At Burnstone, the company appears to make good progress every quarter
without ever getting closer to being in production. Again, management
has not provided a clear schedule for the project's ramp-up, but the
Mineweb article linked HERE
mentions that the first gold is scheduled to be produced in mid 2010
and that this year's production is expected to be around 80K ounces.
When fully complete, the current phase of the Burnstone development
should produce gold at the rate of 250K ounces/year.
GBG's chart looks constructive (the stock appears to be tracing out a
large basing pattern and has made a sequence of rising lows since
December-2008) and will continue to do so as long as the stock price
remains above the February low. It wouldn't be on the top of our list
for new buying, though, due to the lack of clarity on the development
schedule.
Red Hill Energy (TSXV: RH). Shares: 52M issued, 63M fully diluted. Recent price: C$0.58
Since the announcement of the merger between RH and Prophecy Resource
(TSXV: PCY) in late January, RH has traded at a substantial discount to
the implied market price of the post-merger shares. Furthermore,
although RH shares gained 38% last week, the discount actually widened
because PCY shares rose even more sharply.
Based on the agreed terms of the merger, Friday's closing price of
C$0.84 for PCY implies a value of at least C$0.77 for RH. Why, then,
did RH end the day at only C$0.58?
The merger will almost certainly go ahead, so the only explanation we
can come up with is that the large discount stems from the inefficiency
of an illiquid market. For example, RH shareholders who are unhappy
with the proposed merger could have decided to 'hit' whatever bids
became available, thus putting downward pressure on the stock.
We admit to being less than thrilled with the proposed merger, but we
would certainly not consider selling at a large discount to a
legitimate offer currently 'on the table'.
The catalyst for last week's surges in both RH and PCY was the
announcement that RH's Mongolia-based Ulaan Ovoo coal project was being
accelerated with the goal of getting into production before the end of
this year. This acceleration is certainly a positive development, and
if it is due to PCY's influence then the merger is a good thing. We are
left to wonder, though, why the push towards production didn't happen
years ago.
For now, we think RH is a hold. If we owned PCY shares we would be
switching into RH shares to capture the arbitrage opportunity.
Chart Sources
Charts appearing in today's commentary
are courtesy of:
http://stockcharts.com/index.html
http://www.futuresource.com/
http://www.decisionpoint.com/

|