|
-- Weekly Market Update for the Week Commencing 22nd July 2013
Big Picture
View
Here is a summary of our big picture
view of the markets. Note that our short-term views may differ from our
big picture view.
In nominal dollar terms, the BULL market in US Treasury Bonds
that began in the early 1980s will end by 2013. In real (gold)
terms, bonds commenced a secular BEAR market in 2001 that will continue
until 2014-2020. (Last
update: 23 January 2012)
The stock market, as represented by the S&P500 Index,
commenced
a secular BEAR market during the first quarter of 2000, where "secular
bear market" is defined as a long-term downward trend in valuations
(P/E ratios, etc.) and gold-denominated prices. This secular trend will bottom sometime between 2014 and 2020.
(Last update: 22 October 2007)
A secular BEAR market in the Dollar
began during the final quarter of 2000 and ended in July of 2008. This
secular bear market will be followed by a multi-year period of range
trading.
(Last
update: 09 February 2009)
Gold commenced a
secular bull market relative to all fiat currencies, the CRB Index,
bonds and most stock market indices during 1999-2001.
This secular trend will peak sometime between 2014 and 2020.
(Last update: 22 October 2007)
Commodities,
as represented by the Continuous Commodity Index (CCI), commenced a
secular BULL market in 2001 in nominal dollar terms. The first major
upward leg in this bull market ended during the first half of 2008, but
a long-term peak won't occur until 2014-2020. In real (gold) terms,
commodities commenced a secular BEAR market in 2001 that will continue
until 2014-2020.
(Last
update: 09 February 2009)
Copyright
Reminder
The commentaries that appear at TSI
may not be distributed, in full or in part, without our written permission.
In particular, please note that the posting of extracts from TSI commentaries
at other web sites or providing links to TSI commentaries at other web
sites (for example, at discussion boards) without our written permission
is prohibited.
We reserve the right to immediately
terminate the subscription of any TSI subscriber who distributes the TSI
commentaries without our written permission.
Outlook Summary
Market
|
Short-Term
(1-3 month)
|
Intermediate-Term
(6-12 month)
|
Long-Term
(2-5 Year)
|
|
Gold
|
Bullish
(17-Oct-12)
|
Bullish
(26-Mar-12)
|
Bullish
|
|
US$ (Dollar Index)
|
Neutral
(24-Dec-12)
|
Bullish
(01-May-13)
|
Neutral
(19-Sep-07)
|
|
Bonds (US T-Bond)
|
Bullish
(24-Jun-13)
|
Neutral
(18-Jan-12)
|
Bearish |
|
Stock Market
(DJW)
|
Bearish
(15-Jul-13)
|
Bearish
(28-Nov-11)
|
Bearish
|
|
Gold Stocks
(HUI)
|
Bullish
(24-Dec-12)
|
Bullish
(23-Jun-10)
|
Bullish
|
|
Oil |
Neutral
(30-Jul-12)
|
Neutral
(31-Jan-11)
|
Bullish
|
|
Industrial Metals
(GYX)
|
Neutral
(30-Jul-12)
|
Neutral
(29-Aug-11)
|
Neutral
(11-Jan-10)
|
Notes:
1. In those cases where we have been able to identify the commentary in
which the most recent outlook change occurred we've put the date of the
commentary below the current outlook.
2. "Neutral", in the above table, means that we either don't have a
firm opinion or that we think risk and reward are roughly in balance with respect to the timeframe in question.
3. Long-term views are determined almost completely by fundamentals,
intermediate-term views by
fundamentals, sentiment and technicals, and short-term views by sentiment and
technicals.
How to forecast and never
be wrong
There are always many possible outcomes.
However, laying out all the possibilities and assigning a probability to each is
not only pointless, it is shifty.
Assigning a percentage probability to a financial-market forecast implies
mathematical precision where no such precision is possible. After all, a
forecast of what a market will do in the future is really just a guess.
Assigning a probability also involves guesswork, because the actual probability
is unknowable. That's one problem with expressing forecasts in terms of
probabilities.
From the point of view of the 'forecastee' (the recipient of the forecast),
another problem is that a forecast expressed in terms of probabilities can be
said to be correct no matter what happens. This, of course, is of great benefit
to the forecaster and is why we say that using probabilities in this way is
shifty.
To further explain using a hypothetical example, let's say that we forecast the
year-end gold price in the following way:
- 55% probability of being $1500 or higher
- 25% probability of being between $1180 (the June low) and $1500
- 15% probability of being in the $1000-$1180 range
- 5% probability of being below $1000
We've just covered every possible outcome. If gold finishes the year at any
price above $1500 we can say "see, we told you that gold would probably be above
$1500". And at the other end of the spectrum, if gold continues its downtrend
and finishes the year at $900 we can say "see, we warned you that gold could go
below $1000".
So, if you want to make forecasts and never be wrong, just express your
forecasts in terms of probabilities.
Inflation-Adjusted Charts
It's about time we updated our long-term monthly
charts of some inflation-adjusted commodity prices, so that's exactly what we've
done below for gold, silver, platinum, copper and the CRB Index. Before diving
into a quick review of these charts it is worth reiterating that we use a method
of adjusting prices for the effects of US$ inflation that was first described in
a piece
about the mythical "Commodity Supercycle" in December of 2010. This method
probably won't be accurate over periods of one year or less, but it should come
close to reflecting reality over the long term. Also, it will almost certainly
come a lot closer to reflecting reality than the price indices reported by the
US government and ShadowStats.com.
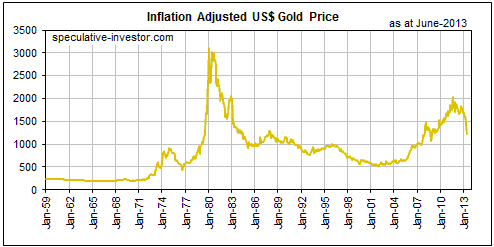
We'll start with a monthly chart of inflation-adjusted (IA) gold. When we look
at this chart the impression we get is that the current long-term bull market is
an elongated version of the preceding long-term bull market. That the current
bull market has been slower and steadier makes sense, given that the performance
of the gold mining sector points to the gold bull market of the 1970s having
actually begun in the early 1960s. Gold itself couldn't begin to rise in price
until 1971, because prior to then its price was fixed at $35/oz.
Due to the gold price being fixed at a constant level during what was, in
effect, the first half of its 1960s-1970s bull market, the entire price advance
ended up being compressed into a much shorter timeframe.
The following chart is based on monthly closing prices and therefore doesn't
show the 1980 intra-day high. We calculate that the equivalent of the
January-1980 intra-day high in today's dollars is about $3700/oz.
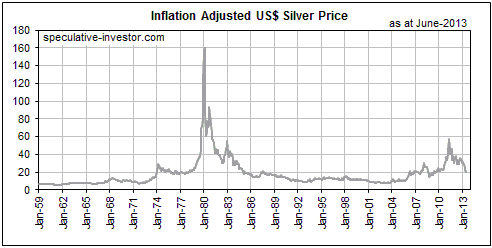
Next up we have a monthly chart of IA silver, which is dominated by the massive
upward spike of 1979-1980. The nominal January-1980 intra-day high of $50/oz is
equivalent to about $215/oz in today's dollars. To put it another way, in real
terms silver is currently trading at less than 10% of its January-1980 peak.
There's a good chance that silver will out-perform gold between now and the end
of the long-term bull market, but as was the case during the 1970s the bulk of
silver's gains relative to gold will probably happen during the final 12 months
of the bull market.
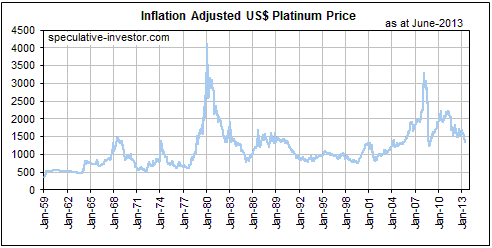
The IA platinum price tends to be more volatile than the IA gold price. Also,
although the prices of gold and platinum will generally trend in the same
direction on a long-term basis, the two markets have different fundamental
drivers. Of particular note, the platinum price is sensitive to changes in mine
supply and industrial demand, whereas changes in mine supply and industrial
demand are almost totally irrelevant to the gold price. Due to these
differences, there will sometimes be large divergences between the two markets.
Declining production from South African platinum mines could enable platinum to
outperform gold over the coming 12 months.
In IA terms, the copper price is presently near the middle of its 50-year range.
Copper will again become an interesting long-term speculation after we get
definitive confirmation that the next major price advance is underway in the
gold market, but not before then.

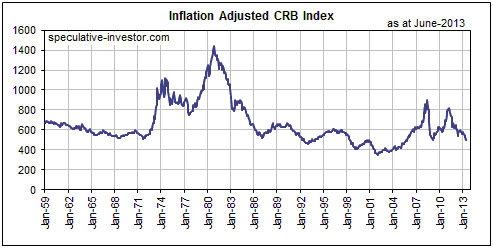
The following monthly chart of the IA CRB Index contains no sign that the
ultra-long-term downward trend in real commodity prices has come to an end.
Significant real price gains were achieved during 2003-2008, but these gains
were nowhere near large enough to substantiate the claims that the world was
rapidly running out of natural resources. Currently, the IA CRB Index is not far
above its lows of the past 100 years.
Monetary inflation will probably push the CRB index to a new all-time price high
in nominal US$ terms within the next few years, but we wouldn't bet on the
inflation-adjusted CRB Index exceeding its 2008 high, let alone its 1980 high,
within this decade.
The Stock
Market
Europe
The lead article in the latest Barrons magazine has the heading "Europe's
Economy Will Rebound" and the sub-heading "The European Union could
emerge from recession in the fourth quarter, and enjoy modest economic growth
next year." The first part of the article mentions forecasts for modest
euro-zone (EZ) GDP growth in 2014, the body of the article discusses some of the
EZ's positives and negatives, and the conclusion is: "While there still is a
lot of work to do, the Continent seems to have turned a corner. The euro zone
has overcome the threat of systemic failure and dispelled concerns about its
long-term viability. The economy is being rebuilt. In short, Europe will soon be
back in business." What a relief! So this means we can stop worrying about
EZ financial crisis, right?
Unfortunately, no; the causes of the EZ debt/banking crises of the past several
years have not been addressed. The stage is therefore set for another crisis,
although, as usual, the timing is unknowable. For example, we can't rule out the
possibility that the upward trend in the EZ's monetary inflation rate (the
year-over-year rate of growth in euro supply is up from 3.6% in May of 2012 to
8% in May of this year) will delay the onset of the next crisis and result in
something that looks like a genuine recovery over the next 12 months. This is
because monetary inflation tends to boost GDP at the same time as it eats away
at the economy's real wealth. Always remember that GDP is purely a measure of
economic activity in monetary terms. It does not distinguish between productive
activity and counter-productive (wealth-destroying) activity.
The onset of the next EZ crisis will likely be signaled by substantial rises in
the yields on the government bonds of countries such as Spain, Portugal and
Italy, and/or by a breakdown in the EURO STOXX Banks Index. These things could
happen at any time, but they haven't happened yet.
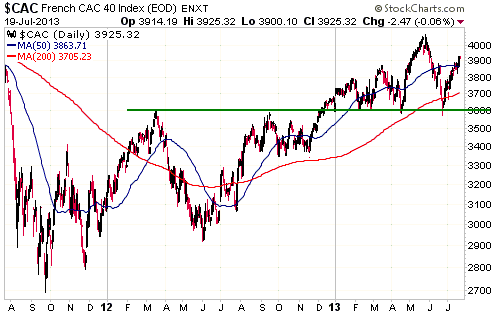
Although it probably won't be the first EZ country to re-enter crisis mode, we
suspect that France will end up being the focal point of the next EZ crisis.
France's CAC40 Index, a daily chart of which is displayed below, has very
important support at 3600. A breach of this support would warn that the ECB's
monetary inflation was failing to create even the illusion of recovery.
Japan
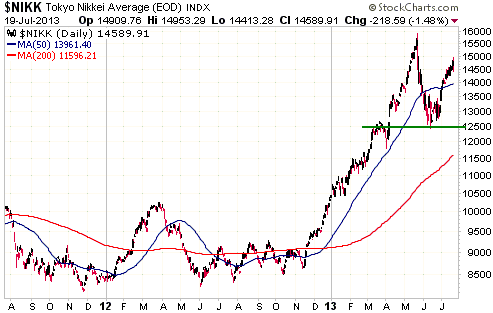
Japan's Nikkei225 Index peaked at 16,000 on 22nd May and then plunged to 12,500.
It has since rebounded to a high, last Friday, of almost 15,000.
The up-move from the June low of 12,500 has gone as far as it should go IF it is
the counter-trend variety (a rebound within a continuing downward trend). Our
guess is that the rebound will turn out to be the counter-trend variety and that
the market will now begin making its way down to a new multi-month low, but we
could soon know either way. In particular, a daily close above 15,000 would
indicate that our guess is most likely wrong.
This week's
important US economic events
| Date |
Description |
| Monday Jul 22 |
Existing Home Sales | | Tuesday
Jul 23 |
Richmond Fed Mfg Index | | Wednesday
Jul 24 |
New Home Sales | | Thursday
Jul 25 |
Durable Goods Orders
Kansas City Fed Mfg Index
|
| Friday Jul 26 |
Consumer Sentiment |
Gold and
the Dollar
Gold
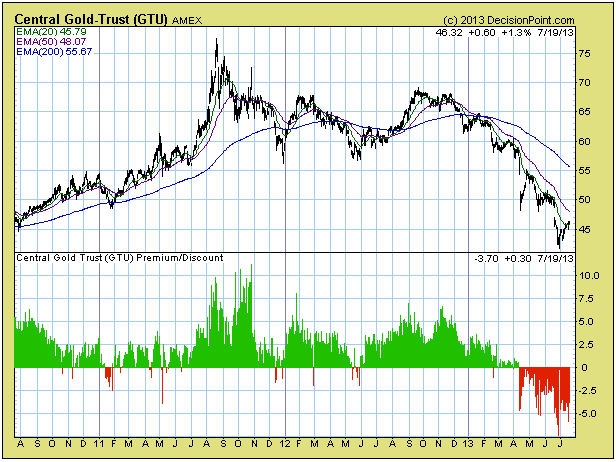
The following chart of the premium/discount to net asset value (NAV) of the
Central Gold Trust (GTU), a fund that holds gold bullion, is more evidence that
gold sentiment is consistent with the gold price being near a major low. It is
not uncommon for GTU's market price to spike below its NAV, but a few months of
trading at a discount to NAV -- as has just occurred -- is a rarity. It has
never happened during the 10 years of GTU's existence, but it did happen with
CEF, a similar fund, near the beginning of gold's long-term bull market in 2001.
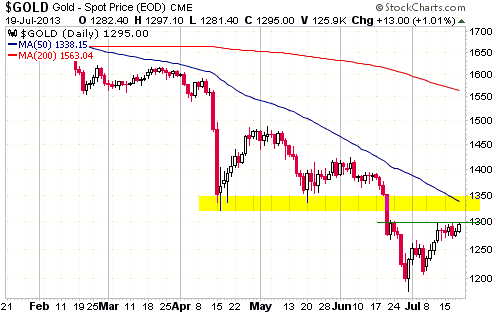
Gold spent last week in a narrow horizontal range just below $1300. It looks set
to break above $1300 this week and test the far more significant resistance that
lies at $1320-$1350.
A break above $1350 wouldn't prove that the major correction was over, but it
would indicate that a bottoming process was underway and that any new low later
this year would probably be marginal.
Gold Stocks
During February-April of this year we were very uncomfortable with the price
action in the gold-mining sector. This was mainly because the price action
didn't mesh with any of the likely scenarios we had in mind. We began 2013
thinking that a test of the 2012 low was an even-money bet during the first half
of the year, but the decisive break below the 2012 low within the first two
months of this year was outside the range of our expected outcomes.
Although there still isn't any evidence that the ultimate price low has been
reached, we are now comfortable with the price action. This is because we now
know, or at least we think we know, what's going on. The price action earlier
this year didn't make sense to us because we didn't seriously consider the
possibility that a major/primary correction was in progress. For reasons
mentioned in previous commentaries, we assumed that we were dealing with a
correction of the intermediate-term variety. This wrong assumption clouded our
view.
It is now clear -- or at least as clear as it can be, given that the future is
never certain -- that the huge price decline that unfolded during the first half
of this year was the final capitulation phase of a primary correction. An
implication is that the gold sector will probably trend upward for 3-5 years
from this year's low. What's not yet clear is whether the ultimate price low is
already in place. Such clarity is unlikely to emerge over the next few weeks.
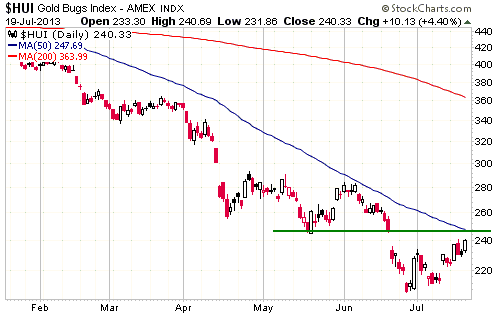
At this stage there's nothing in the HUI's chart (see below) to differentiate
the rebound from the late-June low from the counter-trend rebounds that happened
earlier this year. A solid daily close above 250 would be the first piece of
price-related evidence that the major trend is beginning to reverse, although it
wouldn't alter our view that a sustained turn to the upside will probably wait
until October-November.
Currency Market Update
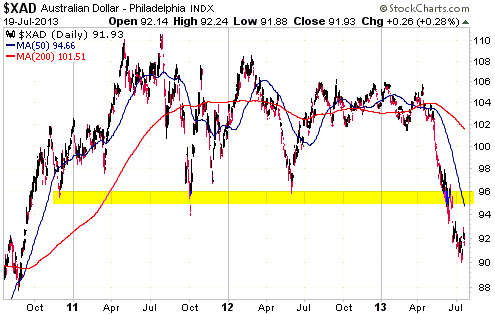
Despite its large decline over the past three months, the Australian Dollar (A$)
remains very over-valued on a purchasing-power-parity basis. This over-valuation
creates the potential for the A$ to drop a lot further -- to 80 or even lower --
within the coming 12 months, but it seems that much will depend on what happens
to China's economy. The reason is that it was evidence of a slowing Chinese
economy that finally caused the A$'s over-valuation to matter.
While the A$'s bear market looks set to continue, the extent to which this
currency is 'oversold' on a short-term basis makes it likely that a multi-week
rebound will soon begin. Former support (now resistance) at 95-96 is a
reasonable target for a routine counter-trend rebound.
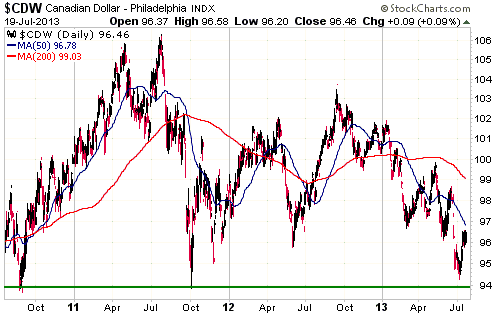
Unlike the A$, the Canadian Dollar (C$) has managed to hold above important
support in the mid-90s. We expect that this support will eventually be breached,
leading to a decline to the mid-to-high 80s, but as has been the case for some
time we don't think the C$ has as much downside risk as the A$. This is partly
because the C$ is not as over-valued as the A$ and partly because Canada's
economy is not as leveraged as Australia's economy to China's economic
performance.
Update
on Stock Selections
Notes: 1) To review the complete list of current TSI stock selections, logon at
http://www.speculative-investor.com/new/market_logon.asp
and then click on "Stock Selections" in the menu. When at the Stock
Selections page, click on a stock's symbol to bring-up an archive of
our comments on the stock in question. 2) The Small Stock Watch List is
located at http://www.speculative-investor.com/new/smallstockwatch.html
 Company
news/developments for the week ended Friday 19th July 2013: Company
news/developments for the week ended Friday 19th July 2013:
[Note: FS = Feasibility Study, IRR = Internal Rate of Return, MD&A =
Management Discussion and Analysis, M&I = Measured and Indicated,
NAV = Net Asset Value, NPV(X%) = Net Present Value using a discount
rate of X%, P&P = Proven and Probable, PEA = Preliminary Economic
Assessment, PFS = Pre-Feasibility Study]
*Almaden Minerals (AAU) announced that it has raised $5.4M via a
private placement to a small group of Mexican and Mexican focused
strategic investors. The new shares were priced at $1.25 and came
with a full warrant.
According to the company, issuing new shares at such a low price was
justified because a) the participants in the placement will provide
important support for the company in developing its flagship
Tuligtic gold-silver project in Mexico, and b) the placement ensures
that AAU remains in a position to continue development of Tuligtic
at a reasonable pace.
Following this financing AAU has about $24.4M of liquid financial
assets, comprising $19M of cash (including $2.1M of gold bullion)
and $5.4M of equities.
It was subsequently announced that Ernesto Echavarria, a well-known
Mexican businessman and the owner of significant stakes in a number
of junior Canadian mining companies, participated in the
above-mentioned private placement to the extent of 2.8M new shares.
Mr Echavarria now owns 7M Almaden shares and 2.8M Almaden warrants,
which equates to 10.9% of the company on an undiluted basis and
14.6% of the company on a partially diluted basis (that is, assuming
the exercise of the warrants).
*Evolution Mining (EVN.AX) declared commercial production at its
Mt Carlton mine in Queensland. This means that commissioning has
been successfully completed and costs will now be expensed rather
than capitalised, although full production is not expected to be
achieved until next quarter.
Mt Carlton is EVN's fifth operating gold mine.
*Golden Star Resources (GSS) reported good results from drilling
at its Wassa mine in Ghana. Of particular note, step-out holes
returned gold intercepts of 62.8m grading 4.1 g/t and 52.9m grading
4.3 g/t. Also, one of the infill holes returned 47.1m grading 7.2
g/t.
The significance of the Wassa drilling results of the past 12 months
will now be assessed by the company. An updated resource model and a
new resource estimate are expected to be complete before the end of
this quarter.
*Lydian International (LYD.TO) reported a step forward in the
environmental approval process for its Amulsar gold project in
Armenia.
Specifically, LYD reported that with the assistance of its
independent environmental consultants it had presented the detailed
development proposal for the Amulsar gold project at a Public
Hearing in the village of Gndevaz (the community that would be
directly affected by the development of the Amulsar project) on 11th
July. At the end of the Hearing, the Gndevaz community approved the
concept and environmental impact assessment of the proposed Amulsar
heap leach and processing facility. This means that LYD can now
proceed to the final stage of the environmental approval process,
involving the preparation and approval of an environmental impact
assessment (EIA).
We expect important news from LYD within the next two weeks in the
form of an updated FS for the Amulsar project.
*Pilot Gold (PLG.TO): Since we began following PLG at TSI in
November of last year, all the project-specific news generated by
the company has been associated with the TV Tower project in Turkey.
In fact, there was more news from TV Tower last week, with the
near-surface silver zone -- that partially overlays a high-grade
gold zone -- at the KCD target returning some good results including
327 g/t Ag over 14.5m and 71.7 g/t Ag over 53.9m from step-out
drilling. However, PLG has two other high-potential projects: the
Halilaga project in Turkey and the Kinsley Mountain project in
Nevada.
Halilaga is the most advanced of PLG's three core projects, but in
the current market environment it is the least interesting. It is a
low-grade copper-gold porphyry deposit with a total resource
comprising 2.1B pounds of copper and 3.3M ounces of gold (roughly
half Indicated, half Inferred) and a capital cost estimated via a
PEA to be well over $1B. Projects such as this aren't worth much in
today's financial world.
Although it is the least advanced of PLG's core projects, Kinsley
Mountain is almost as interesting as TV Tower. It is an early-stage
gold project that is located 90kms south-east of, and is
geologically similar to, the Long Canyon project that Newmont Mining
acquired in 2011 at a cost of around $2B.
PLG announced last week that it has commenced a 20,000m drilling
program at Kinsley Mountain. Consequently, there should be a steady
stream of news from PLG over the next few months as drilling results
become available from both TV Tower and Kinsley Mountain. Underlying
this point, a recent press release noted that assays are pending for
20 completed holes at TV Tower.
*Sabina Gold and Silver (SBB.TO) was forced by the British
Columbia Securities Commission (BCSC) to retract some statements
about project resource and economics made in its corporate
presentations. None of the retracted statements was deemed to be
incorrect, just non-compliant with regulatory requirements. In
response, SBB has removed the presentations from its web site.
The main effect of this BCSC action and many other BCSC actions is
that retail investors now have access to less information upon which
to make their decisions. Therefore, this is just another in a long
line of examples of the counter-productive meddling that rational
people have come to expect from government regulators.
 Notes
on price action and candidates for new buying Notes
on price action and candidates for new buying
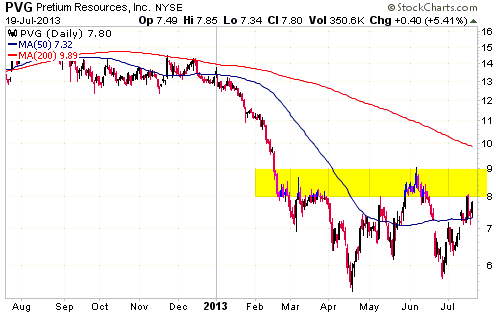
Asanko Gold (AKG) and Pretium Resources (PVG) have recently been two of the
strongest TSI gold stocks. Daily price charts are presented below.
AKG has rebounded strongly since bottoming in late June and broke above the top
of an 8-month price channel last week. PVG has also rebounded strongly from its
June low and is one of the few gold stocks to hold above the April low during
the May-June capitulation.
Neither AKG nor PVG has gained anywhere near enough ground to create a selling
opportunity, but each is now approaching resistance and is therefore no longer
among the shortlist of top candidates for new buying.
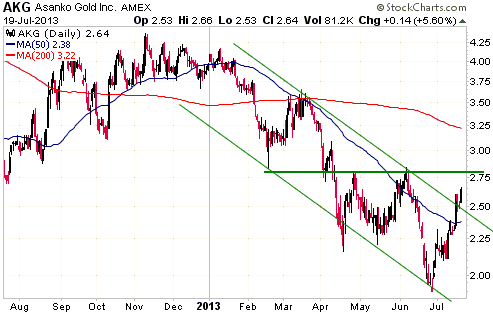
Near current prices, the best candidates for new buying are EDV.TO/EVR.AX,
LYD.TO, PG.TO and SBB.TO.
 Thoughts
on Copper Fox (CUU.V) Thoughts
on Copper Fox (CUU.V)
Last week there was interesting news from CUU, an exploration-stage copper miner
and a former member of the TSI Stocks List (CUU was removed from the List in
Q1-2011). CUU has a stake in the large, low-grade Schaft Creek copper/gold
project in British Columbia, Canada.
Teck, CUU's partner at Schaft Creek, has just clawed back 75% of the project by
paying a lot less than it would have had to pay under an earlier agreement.
Specifically, Teck will end up paying as much as $60M or as little as $20M to
obtain its 75% stake, depending on whether or not the project is taken through
to production (the higher number will apply if the project is put into
production). Considering that a much higher copper price will be required to
make Schaft Creek's risk/reward sufficiently attractive to warrant a production
decision, Teck has effectively paid $20M for a copper call option of unlimited
duration.
This is an OK deal for CUU's current shareholders and a terrific deal for CUU's
senior management. It is an OK deal for CUU's shareholders because it would not
have been surprising, considering the current market environment and the
numerous other projects with better economics on which Teck could be spending
its money, if Teck had chosen to walk away from Schaft Creek. It is a terrific
deal for CUU's senior management because it ensures that the company will have
plenty of money to pay management salaries for at least two more years.
The question is: With its stock price trading near a 2-year low at C$0.62, does
this deal make CUU a worthwhile speculation?
The answer is no. With about 400M shares outstanding, CUU's market cap is about
C$250M. This means that the stock market is valuing 25% of Schaft Creek (CUU's
new stake in the project) at $250M even though Teck just bought 75% of the
project for $20M-$60M. Teck's purchase of 75% implies a maximum value of $20M
for CUU's stake.
Our view is that in today's market environment, the Schaft Creek valuation
implied by Teck's purchase price is far more realistic than the Schaft Creek
valuation implied by CUU's current market cap.
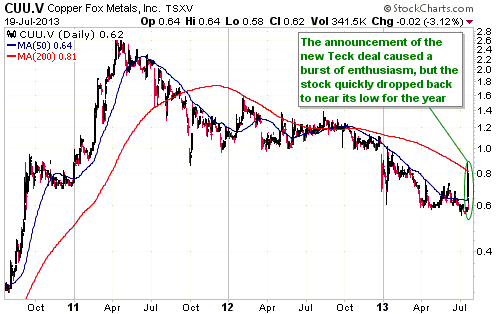
Chart Sources
Charts appearing in today's commentary
are courtesy of:
http://stockcharts.com/index.html
http://www.decisionpoint.com/

|

