


--
Weekly Market Update for
22nd July 2019
Big Picture
View
Here is a summary of our big picture
view of the markets. Note that our short-term views may differ from our
big picture view.
The BULL market in US Treasury Bonds
that began in the early 1980s ended in mid-2016, but there will be many years
of topping action in bond prices and bottoming action in bond yields before
major new trends get underway. A major decline in government bond prices will
unfold during the 2020s. (Last update: 11 September 2017)
The stock market, as represented by the S&P500 Index,
commenced
a secular BEAR market during the first quarter of 2000, where "secular
bear market" is defined as a long-term downward trend in valuations
(P/E ratios, etc.), gold-denominated prices and inflation-adjusted prices. This secular trend will bottom
in 2020 or later.
(Last update: 11 September 2017)
A cyclical BEAR market in the
US
Dollar
began in 2016-2017.
(Last
update: 11 September 2017)
Gold commenced a
secular bull market relative to all fiat currencies, the CRB Index,
bonds and most stock market indices during 1999-2001.
This secular trend will peak in 2020
or later.
(Last update: 11 September 2017)
Commodities,
as represented by the CRB Index, commenced a
secular BULL market in 2001 in nominal dollar terms. The first major
upward leg in this bull market ended during the first half of 2008, but
a long-term peak won't occur until 2020 or later.
(Last
update: 11 September 2017)
Copyright
Reminder
The commentaries that appear at TSI
may not be distributed, in full or in part, without our written permission.
In particular, please note that the posting of extracts from TSI commentaries
at other web sites or providing links to TSI commentaries at other web
sites (for example, at discussion boards) without our written permission
is prohibited.
We reserve the right to immediately
terminate the subscription of any TSI subscriber who distributes the TSI
commentaries without our written permission.
True
Fundamentals Summary
[Notes:
1) The date shown next to the current True Fundamentals Model (TFM) signal is
when the most recent change occurred. 2) Charts of the Gold and Equity
TFMs are included in the "Charts and Indicators" section of the TSI web
site]
|
Market |
True Fundamentals Model (TFM) |
|
Gold (US$ Price) |
Bullish (04 Jan 2019) |
|
US Equity (SPX) |
Bearish (19 Apr 2019) |
|
Currency (Dollar Index) |
Neutral (15 Mar 2019) |
|
Commodities (GNX) |
Bearish (01 Jun 2018) |
Last week's posts at the TSI Blog
The
coming T-Bond decline
Summary of current
thinking/positioning
1) The Dollar Index (DX) has
commenced a downward trend, but it could be a few months before the new
trend becomes consistent. In the meantime the price action could be
choppy, possibly involving a test of the May high near 98.
2) The
US$ gold price has broken out to the upside on a monthly basis.
Significant additional gains are likely within the next three months --
after the current correction has run its course. The US$ silver price has
commenced a catch-up move that should continue over the months ahead.
3) Despite not having pulled back far enough or consolidated for long
enough to eliminate their 'overbought' conditions, the gold-mining
indices/ETFs extended their short-term upward moves last week. Reversals
on Friday 19th July suggest that another attempt at a correction has
begun, but there probably will be significant additional gains within the
coming two months.
4) The SPX probably has commenced a sizable
multi-week decline.
5) An upside blow-off has set the stage for a
large T-Bond decline. The decline probably began on Friday 5th July,
although it could be September-October before the market starts trending
downward with conviction.
6) Oil's correction is probably over,
although there is still a risk that stock market weakness during
July-August will push the oil price to a new multi-month low.
7) We
are holding a cash reserve of 25%-30%.
Commodities
Gold is predicting an
industrial metals rally
Gold tends to lead the industrial
metals sector at intermediate-term bottoms*, that is, the US$ gold price
tends to make an intermediate-term bottom and commence a multi-quarter (or
multi-year) upward trend in advance of the Industrial Metals Index (GYX).
Evidence of this can be found on the following chart comparison of the US$
gold price and GYX. Specific examples are:
a) The gold price
reversed upward in April of 2001 and GYX did the same in November of that
year.
b) The gold price reversed upward in October-November of 2008
and GYX did the same in February-March of 2009.
c) The gold price
reversed upward in December of 2015 and GYX followed suit in January of
2016.
Gold's most recent intermediate-term bottom was in August of
2018. It has since trended upward and over the past two months the trend
accelerated. GYX, however, continued to make lower lows until June of
2019. It's too early to tell if GYX's June-2019 low was the
intermediate-term variety, but regardless of whether or not it makes a new
low within the next couple of months the performance of the gold market
suggests that the industrial metals sector will commence an
intermediate-term rally well before the end of this year.
*Note that gold only tends to lead at price
bottoms. At tops it tends to lag. That is, gold tends to bottom earlier
and peak later than the industrial metals.
The Baltic
Dry Index (BDI) is also predicting an industrial metals rally
The BDI is an index of dry bulk shipping rates. We generally don't use
it as an economic or a financial-market indicator, because it is
influenced as much by changes in the supply of shipping capacity as by
changes in the global demand for commodities. However, intermediate-term
trends in the BDI often match intermediate-term trends in the Industrial
Metals Index (GYX). Also, large short-term divergences between the BDI and
GYX tend to be important, with one or the other subsequently making a big
catch-up move in quick time.
As illustrated by the following chart,
a large divergence has opened up over the past three months due to the BDI
rocketing up to a 5-year high while GYX languishes near a 2-year low. This
divergence could be closed by either a dramatic plunge in the BDI or a
substantial rally in the industrial metals sector. We suspect it will be
the latter.

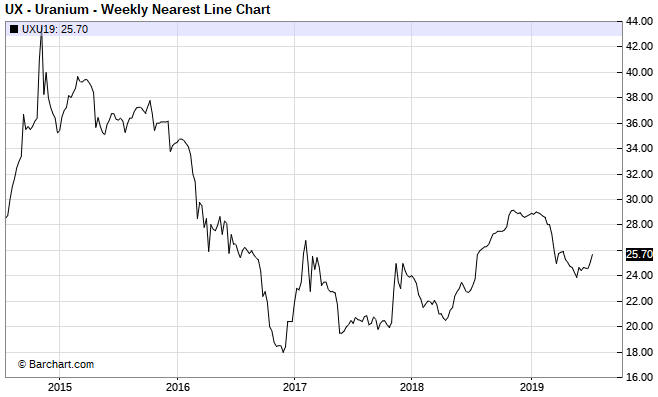
An upturn in the uranium price
Our view is
that the uranium price made a long-term bottom near $18/pound towards the
end of 2016 and is now immersed in a base-building process that could
continue for many years. The base extends from $20 to around $40.
Early this year it looked like the uranium price was preparing to move
into the $30s, but instead it dropped back to the mid-$20s. It's possible
that a sustainable bottom was put in place at around $24 at the end of
May.
It's worth having some exposure to uranium. At current prices, if we
were going to buy a single uranium stock it would be Energy Fuels (UUUU.
EFR.TO). This is because UUUU has a reasonable valuation, a healthy
balance sheet and offers exposure to vanadium in addition to uranium. We
also like the idea of obtaining uranium exposure through ownership of
long-dated call options on Cameco (CCJ), the world's largest listed
uranium producer.
A daily CCJ chart is displayed below. The chart
suggests short-term downside risk of about $1, but the other side of the
coin is that it also suggests intermediate-term upside potential of about
$10 (a break above US$13 would create a target of $19-$20).
We are
looking for an opportunity to add CCJ January-2021 $15 call options to our
own account and to the TSI List.
The coming platinum breakout
As discussed
later in today's report, last week the silver price achieved a weekly
close above a trend-line drawn from the 2016 top. We suspect that platinum
will break above a similar trend-line within the next few weeks.
Based on the way we've drawn the lines on the following weekly chart,
ending a week above US$880 would constitute a major breakout for platinum.
However, to remove any doubt that a substantial rally was underway the
price would have to achieve a weekly close above the April-2019 high
(US$920).
We think that platinum will, at a minimum, test its 2016
high near $1200 within the next 6 months.
A sharp pullback in the oil price
The week
before last the oil market closed above its early-July high, a short-term
trend-line drawn from the April peak and its 50-day and 200-day MAs. These
positive developments were negated last week, though, when the price
dropped sharply to lateral support at $55.
There's still a decent
chance that oil's correction is over, but, as we've said before, the big
test for oil will occur during the US stock market's next meaningful
decline. This is because there is still a strong positive correlation
between the oil price and the SPX.
The Stock Market
Three fundamental developments
or potential developments could have a significant effect on the stock
market over the next several weeks.
The first is the announcement
of a Fed rate cut after the FOMC Meeting on 31st July. Everyone knows that
the Fed will announce a rate cut on 31st July, but there is enough
uncertainty about the magnitude of the cut (will it be 25bp or 50bp?) that
there probably will be a meaningful market reaction to the news. We'll
discuss this in more detail next week.
The second relates to the
US-China trade negotiations. These negotiations appear to have stalled and
President Trump has expressed annoyance that China's government has
supposedly reneged on a promise to greatly increase purchases of US
agricultural products. This creates a short-term risk that the "trade
war", which shifted from centre-stage after the Trump-Xi meeting late last
month, will suddenly 'reignite'. The specific risk for the US stock market
and the US economy is that Trump will react to the lack of progress in the
negotiations by following through on an earlier threat to impose tariffs
on about $300B of additional Chinese products. We suspect that if this
were to happen the SPX would plunge by as much as 5%.
The third is
the return of the "Debt Ceiling". A deal to raise the Federal government
Debt Ceiling possibly will be done this week, in which case there will be
no issue. However, due to the legislative branch's summer recess, if a
deal doesn't happen this week then it won't happen until at least the
second week of September. The problem is that the US government will run
out of money by early September unless it has the capacity to resume its
borrowing, so a failure to lift the official Debt Ceiling this week would
raise the spectre of a US government debt default. Now, the probability of
the US Federal government actually defaulting on its debt is precisely
zero, but the risk of the government temporarily being unable to meet its
financial obligations would create the perception of crisis and pressure
the stock market downward.
Turning to the price action, our
expectation has been for a peak in the US stock market (as represented by
the SPX) by mid-July and then a potentially-steep multi-week decline. The
anticipated decline may have begun on Monday 15th July when the SPX made
its most recent all-time high (3018), although at this stage the pullback
from the high has not breached any significant demarcation levels.
The first significant demarcation level for the SPX is at 2940. A
daily close below this level would be clear evidence that a short-term top
was in place and that the anticipated decline was underway.
For the Dow Transportation Average (TRAN), the weakest of the
important US stock indices over the past few months, initial support is
defined by the short-term channel drawn on the following daily chart. The
channel bottom survived another test last week.
The price action of the Semiconductor Index (SOX) has been confusing.
The SOX broke out to the upside in April, then generated a bearish signal
by breaking out to the downside in May, then negated this bearish signal
over the past three weeks. The fundamental backdrop does not appear to be
conducive to strength in semiconductor stocks, but the SOX has moved to
within 5% of its all-time high and is one of this year's best-performing
indices.
We're not sure what to make of it.
In last week's Interim Update we wrote that if the SPX's 15th July
intra-day high held until the end of the week then a subsequent daily
close above this high could be used as a stop for bearish speculations. It
did hold, so bearish speculators should now risk a daily SPX close above
3018.
This week's
significant US economic events
[Notes:
1) The most important events
(to the markets) are shown
in bold. 2) A list of global economic events can be found
HERE]
| Date |
Description |
|
Monday Jul-22 |
No important events scheduled |
|
Tuesday Jul-23 |
Existing Home Sales |
|
Wednesday Jul-24 |
New Home Sales |
|
Thursday Jul-25 |
Durable Goods Orders |
|
Friday Jul-26 |
Q2 GDP (first estimate) |
Gold and the Dollar
Gold
The
fundamental backdrop (as indicated by our Gold True Fundamentals Model) remains
supportive for gold, meaning that the fundamentals continue to put upward
pressure on the gold price. However, sentiment in the gold futures market is a
yellow warning flag.
There wasn't a significant change in the
Commitments of Traders (COT) net position data for Comex gold futures during the
latest week, but subsequent to the cutoff date of the latest COT report (16th
July) the open interest (OI) in Comex gold futures rose to near the all-time
high reached in both late-2010 and mid-2016. The OI high in late-2010 preceded a
major price top by almost a year, but the OI high in mid-2016 coincided with an
intermediate-term price top.
In effect, the situation over the past
three weeks has been the opposite of the situation during the bulk of last
year's second half. During the second half of last year the sentiment backdrop
was a tail-wind most of the time and the fundamental backdrop was a head-wind
most of the time. The fundamentals prevailed. Now, the sentiment backdrop is a
head-wind and the fundamental backdrop is a tail-wind.
It's likely that
the fundamentals will prevail again, but the sentiment situation creates
downside price risk.
Turning to the short-term price action, the
following daily chart shows that gold traded above its 25th June high on both
Thursday and Friday of last week without managing to close above it. This
muddies the waters, because the Thursday-Friday performance could have been
either a failed breakout attempt (bearish) or part of an on-going multi-week
consolidation (neutral).
In last week's Interim Update we mentioned that
the 20-day MA has been acting as support, so a daily close below this MA could
be interpreted as a downside breakout and a signal that a pullback to as low as
$1350 was in store. The 20-day MA is now at $1411, so it won't take much price
weakness from here to warn of a more significant correction than we've had to
date.
It's worth following up on an issue we discussed in January related to the
DGP/GLD ratio. DGP is designed to move each day by double the percentage change
in the gold price, therefore it should handily outperform GLD during periods
when gold is trending upward. However, even though the gold price is about 20%
higher now than it was in mid-January, the following chart shows that the
DGP/GLD ratio is about 12% lower now than it was in mid-January.
Leveraged ETFs and ETNs leak significant value over time, but the primary
cause of DGP's failure to perform as advertised over the past 6 months is the
large premium to net asset value at which it traded in January. As explained in
our 14th January report:
"...the Gold Double Long ETN (DGP) ended
last week at a premium to net asset value (NAV) of approximately 20%. This is
extraordinary, since ETFs and ETNs are supposed to have no significant premium
or discount to NAV.
The manager of DGP has clearly messed up, which is
perhaps not surprising given that the manager is Deutsche Bank (DB). DB is
fighting for its survival and therefore has more important things to worry about
than the premiums/discounts on its ETNs. The main point, however, is that only a
very poorly informed investor/trader would pay a hefty premium for an ETN such
as DGP."
We went on to suggest that experienced traders consider
shorting DGP near its current price and hedging the short position using GLD
call options with the aim of exiting the trade when the DGP premium fell to near
zero.
The message is that if you pay a hefty premium for any
investment/speculation then you are setting yourself up for a large loss or, at
best, performance that falls well short of expectations.
Silver
The following daily chart covering the past 6 months shows that last week
the silver price broke above lateral resistance in the $15.60s, but that despite
trading well above it on both Thursday and Friday was unable to close above
lateral resistance at $16.20. Resistance at $16.20 is the most important
remaining obstacle this side of $20.
More importantly, the weekly chart displayed below shows that the silver price
ended last week above its 100-week MA and a trend-line dating back to the 2016
top. This breakout indicates that silver could test its 2016 high of $21 within
the next few months.
Friday's downward reversal, with the price surging from around $16.20 to the
$16.60s and then giving up all of the day's gain, suggests that a multi-week
high is in place and that the market will 'correct' over the weeks ahead. While
a 1-3 week correction is certainly possible and would be a normal reaction to
last week's surge and obvious upside breakout, another possibility is that the
price will maintain a steep upward trajectory over the coming month. This second
possibility is suggested by doing what we've been doing with the gold-mining
sector: comparing the price action of the past 12 months with the price action
of 1986-1987.
The following chart shows the comparison. If the market's
position today is similar to its position in March-1987 (as noted on the chart)
then the silver rally could continue to a high in late-August or early-September
with only 1-3 day pullbacks along the way.
The above chart isn't a forecast; it is a presentation of one
possible/plausible scenario. Our forecast is that whether we get a continuing
steep advance or a more measured upward trend encompassing one or more
multi-week corrections, silver will trade well above last week's high within the
next few months.
Gold Stocks
Last August the gold
mining sector, as represented on the following chart by the HUI, became as
'oversold' (based on short-term momentum) as it ever gets. This indicated a high
probability of a price pattern that was neutral or bearish over the ensuing few
weeks and bullish over the ensuing few months. This was discussed in TSI
commentaries at the time.
By late June of this year the situation was
180 degrees from where it was in August of last year, in that the gold mining
sector had become as 'overbought' as it ever gets. The implications were
described as follows in the 24th June Weekly Update:
"...the price
pattern following an upward momentum extreme is not as predictable as the price
pattern following a downward momentum extreme. What we can say is that when an
upward momentum extreme occurs within a few weeks of an important bottom it
usually will be followed by some consolidation, but it tends to have BULLISH
implications with regard to the ensuing 2-4 months. Also, following a momentum
extreme such as the one just achieved by GDX, a new short-term buying
opportunity is created by a correction of sufficient magnitude or duration to
test the 50-day MA or push the daily RSI(14) down to 50."
A
correction of sufficient magnitude or duration to test the 50-day MA or push the
daily RSI(14) down to 50 never materialised, but the bullish implications of the
upward momentum extreme have been clearly apparent. As illustrated by the
following chart, over the past four weeks the HUI has made significant
additional gains while remaining 'overbought'.
The
HUI traded as high as 216 late last week, at which time it was within spitting
distance of long-term lateral resistance at 220 (not shown on the above chart).
After 220 there is no substantial resistance until the 2016 top near 280.
We suspect that the 2016 top will be tested before the gold sector peaks on
an intermediate-term basis, but we still think that it would take the sort of
multi-week correction mentioned above to create a new short-term buying
opportunity.
The Currency Market
The following
weekly chart shows the big picture, which is that since mid-2008 the euro has
been trending downward against the US$ within a wide channel. The long-term
downward trend possibly ended in early-2017, but at this stage a long-term trend
reversal from down to up hasn't been confirmed.
Arguing on behalf of a
long-term trend reversal is that the euro's rally from its January-2017 low to
its January-2018 high has the look of what Elliott Wave devotees refer to as an
"impulsive" move, whereas the decline from the January-2018 high looks
"corrective".
In any case, the euro could rebound to 1.19-1.20 over the
next few months while remaining within its downward-sloping channel.
On a short-term basis, since November of last year the euro has been
pressured upward by a rising trend in the Germany-US yield spread. As
illustrated below, the widening Germany-US yield spread combined with the euro's
lacklustre performance has led to a sizable divergence. The most likely way for
this divergence to be eliminated would be via a rally in the euro.
The
main reason that the favourable trend in the interest-rate differential is yet
to result in a meaningful euro rally is that the equity performance
differential, the other important fundamental driver, continues to favour the
US$.
We think that the next tradable move in the euro will be to the upside and,
therefore, that the next tradable move in the Dollar Index (DX) will be to the
downside. However, we won't be surprised if the DX spends a couple more months
oscillating between 96 and 98 before beginning to trend downward with
conviction.
Updates
on Stock Selections
Notes: 1) To review the complete list of current TSI stock selections, logon at
http://www.speculative-investor.com/new/market_logon.asp
and then click on "Stock Selections" in the menu. When at the Stock
Selections page, click on a stock's symbol to bring-up an archive of
our comments on the stock in question. 2) The Small Stock Watch List is
located at http://www.speculative-investor.com/new/smallstockwatch.html
 Company
news/developments for the week ending Friday 19th July 2019:
Company
news/developments for the week ending Friday 19th July 2019:
[Note: AISC = All-In Sustaining Cost, EBITDA = Earnings Before Interest, Tax,
Depreciation and Amortisation (a measure of cash flow), EV = Enterprise Value or
Electric Vehicle, FS = Feasibility Study, FY = Financial Year, IRR = Internal
Rate of Return, ISR = In-Situ Recovery, JV = Joint Venture, MD&A = Management
Discussion and Analysis, M&I = Measured and Indicated, NAV = Net Asset Value,
NPV(X%) = Net Present Value using a discount rate of X%, NSR = Net Smelter
Return or Net Smelter Royalty, P&P = Proven and Probable, PEA = Preliminary
Economic Assessment, PFS = Pre-Feasibility Study]
*Alliance
Mineral Assets (A40.AX) has changed its name to Alita Resources. The
name change was approved by shareholders at a meeting on 11th July.
Obviously, the name change has no effect on the company's valuation or
prospects.
*eCobalt (ECS.TO) shareholders have
approved the merger with Jervois Mining (JRV.AX, JRV.V). As a result, each ECS
share will be exchanged for 1.65 JRV shares, with 23rd July (this Tuesday) being
the effective date.
With the merger now a done deal we have replaced ECS
with JRV in the TSI List. Jervois trades under the symbol JRV in both Australia
and Canada, but at this time the bulk of the trading occurs in Australia so for
record purposes we are using the ASX-listed stock.
Taking into account
the 1.65:1 share exchange ratio and the current C$/A$ exchange rate, our ECS
entry price of C$0.30 equates to a JRV entry price of A$0.197.
The new
JRV will have advanced exploration-stage cobalt and nickel-cobalt projects in
Canada and Australia plus early exploration-stage cobalt projects in Uganda. The
advanced projects are not economically viable at current metal prices, but they
will become viable after cobalt retraces about half of its 2018-2019 price
decline. Consequently, JRV offers substantial leverage to a rebound in the
cobalt price.
Note that selling of JRV shares by the ECS shareholders who
were not in favour of the merger could put downward pressure on the JRV price
over the next few weeks.
*Mineral Resources (MIN.AX)
responded to an article in The Australian newspaper. The article stated that MIN
was blocked from starting the commissioning of the next stage of its Wodgina
lithium mine in Western Australia after regulators (Western Australian
Department of Water and Environmental Regulation (DWER)) found out that a
tailings dam at the project was seeping into groundwater.
In its
response, MIN advised: "...the tailings dam is functioning as expected and
engineered. Tailings dams are designed to account for seepage and initial rates
of seepage at Wodgina are in line with the Company's expectations for the
establishment of this dam."
MIN also advised that DWER has requested
further information about the water balance at the project before it will permit
commissioning of the next stage to commence. According to the company, this is
routine and is not expected to have a material impact on the project.
At
this time the DWER request for more information does not appear to be a major
threat, but with issues such as this it is always difficult to quantify the
risk.
*Premier Gold (PG.TO) reported a
below-plan production result from its Mercedes gold mine for the June quarter.
The company produced 15.5K ounces of gold during the quarter, bringing its
first-half production to around 33K ounces. 2019 production guidance for the
mine is 75K-85K ounces, so performance will have to improve substantially during
the second half of the year just to hit the bottom of the guidance range. There
is a realistic chance that it will, because the 2019 plan was for a higher
production rate during the second half.
On the positive side of the
ledger, the company reported that the development of the El Nino underground
mine at the South Arturo project (40% PG, 60% Barrick) is progressing ahead of
schedule. Consequently, there could be significant production from this new mine
well before year-end, which could offset any shortfall at Mercedes.
Overall, PG is progressing well across its portfolio of production-stage,
development-stage and exploration-stage gold projects. The stock price has
gained 60% since double-bottoming in December-2018 and April-2019, but there is
plenty of valuation-related upside potential. Worth mentioning is that the
multi-million-ounce, feasibility-stage Hardrock project in Ontario, which is a
50/50 JV between PG and Centerra, would be worth a LOT more today than it was a
few months ago thanks to the increase in the gold price.
*Sabina
Gold and Silver (SBB.TO) has for some time been in the position to
arrange construction financing and begin advancing its fully-permitted Back
River project in the far north of Canada to production. However, due to the
market environment the equity portion of the necessary financing was not
available on acceptable terms, so management decided to enhance the company's
value through various project de-risking activities and additional exploration.
This strategy will be pursued until the market for SBB shares is strong enough
to enable either a substantial equity financing to be done at a price that
doesn't result in unacceptable dilution or a buy-out at an attractive price.
It's a reasonable strategy, we think.
The stock price (see chart below)
has moved up to resistance at C$1.50. This is a logical place for a correction
to begin.
A pullback to around C$1.35 would create a new buying
opportunity in anticipation of an eventual break above C$1.50 and rise to around
C$2.00, where some profit taking may be appropriate.
List
of candidates for new buying
From within the ranks of TSI stock
selections the best candidates for new buying at this time, listed in
alphabetical order, are:
1) AAU in the low-US$0.60s (last Friday's
closing price: US$0.64)
2) CGT.TO (last Friday's closing price: C$0.18)
3) GRG.V at around C$0.25 (last Friday's closing price: C$0.27)
4)
KBLT.V (last Friday's closing price: C$4.08)
5) OR.WT.TO (last Friday's
closing price: C$0.49)
The above list is limited to five stocks. It
sometimes will contain less than five, but it never will contain more than five
regardless of how many stocks are attractively priced for new buying.
Chart Sources
Charts appearing in today's commentary
are courtesy of:
https://stockcharts.com/
https://www.barchart.com/
