![]()
![]()
![]()
![]()
-- Weekly Market Update for the Week Commencing 22nd August 2016
Big Picture
View
Here is a summary of our big picture
view of the markets. Note that our short-term views may differ from our
big picture view.
The BULL market in US Treasury Bonds that began in the early 1980s ended in early-2015, but there will be many years of topping action in bond prices and bottoming action in bond yields before major new trends get underway. (Last update: 29 June 2015)
The stock market, as represented by the S&P500 Index, commenced a secular BEAR market during the first quarter of 2000, where "secular bear market" is defined as a long-term downward trend in valuations (P/E ratios, etc.) and gold-denominated prices. This secular trend will bottom sometime between 2018 and 2020. (Last update: 29 June 2015)
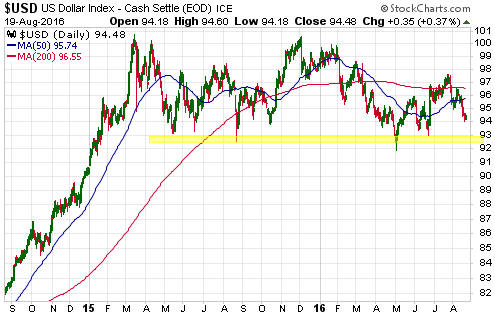
A secular BEAR market in the US Dollar began during the final quarter of 2000 and ended in July of 2008. This secular bear market will be followed by a multi-year period of range trading. (Last update: 09 February 2009)
Gold commenced a secular bull market relative to all fiat currencies, the CRB Index, bonds and most stock market indices during 1999-2001. This secular trend will peak sometime between 2018 and 2020. (Last update: 29 June 2015)
Commodities,
as represented by the CRB Index, commenced a
secular BULL market in 2001 in nominal dollar terms. The first major
upward leg in this bull market ended during the first half of 2008, but
a long-term peak won't occur until 2018-2020.
(Last
update: 29 June 2015)
Copyright
Reminder
The commentaries that appear at TSI
may not be distributed, in full or in part, without our written permission.
In particular, please note that the posting of extracts from TSI commentaries
at other web sites or providing links to TSI commentaries at other web
sites (for example, at discussion boards) without our written permission
is prohibited.
We reserve the right to immediately
terminate the subscription of any TSI subscriber who distributes the TSI
commentaries without our written permission.
Outlook Summary
|
Market |
Short-Term (1-3 month) |
Intermediate-Term (6-18 month) |
Long-Term (2-5 Year) |
| Gold | N/A |
Neutral (27-Jun-16) |
Bullish |
| US$ (Dollar Index) | N/A |
Neutral (17-Aug-16) |
Neutral (19-Sep-07) |
| US Treasury Bonds (TLT) | N/A |
Bearish (19-Oct-15) |
Bearish |
| Stock Market (DJW) | N/A |
Neutral (04-Jul-16) |
Bearish |
| Gold Stocks (HUI) | N/A |
Neutral (04-May-16) |
Bullish |
| Oil | N/A |
Neutral (26-Oct-15) |
Bullish |
| Industrial Metals (GYX) | N/A |
Bullish (04-July-16) | Bullish |
4. Long-term views are determined almost completely by fundamentals and intermediate-term views
are determined by a combination of fundamentals, sentiment and technicals.
Last week's posts at the TSI Blog
Increasing speculation in "paper gold"
English
language pet peeves
Is
there really no alternative?
Summary of current
thinking/positioning
1) Concerned about short-term
downside risk in gold, silver and the associated mining stocks, but
comfortable maintaining 'core' exposure in anticipation of large
additional gains over the next two years. Hedged against short-term
downside via GDX put options, GLD put options and a large cash reserve.
2) Planning to increase exposure to non-gold commodity-related stocks
(primarily base-metals producers/explorers, but also energy and
agriculture companies) during periods of price weakness over the next
three months in anticipation of 2017-2018 being a very bullish period for
commodities.
3) Concerned about the possibility/risk of significant
downside in the stock market during September-October while being well
aware that there are no signs of trouble yet. The stock market is
currently NOT set up for a crash.
4) Speculating on short-term
downside in the 'safe haven' government bonds.
5) Thinking that the
Yen is testing its peak prior to a multi-month decline and that the
British Pound is basing prior to a multi-month advance.
6)
Maintaining a large cash reserve in recognition of the downside risk in
almost all equities. Current cash percentage is around 50%.
No Interim Update
this week
We are in the process of
relocating from Kota Kinabalu in Malaysian Borneo to Nusajaya in Johor,
west Malaysia (a.k.a. the Malaysian peninsula). We wrote about the planned
move in some detail in the 15th October 2015 Interim Update, so please
refer back to that earlier commentary if you are interested in
discovering/recalling the reasons for the move and some information about
Nusajaya (which, by the way, is now officially called Iskandar Puteri).
Due to everything involved in the move, there won't be an Interim
Update this week.
Monetary
Inflation Update
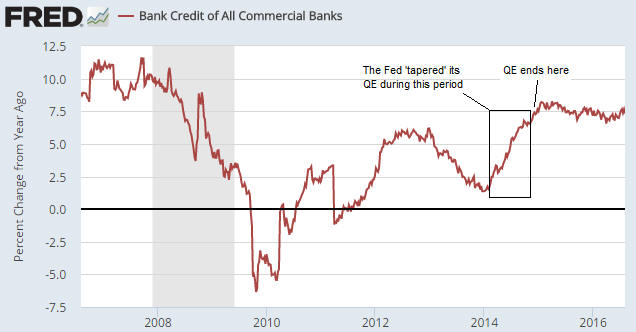
The US
The Fed began to 'taper' its last QE program in early-2014 and ended the
program in October-2014. Since that time the Fed has not made any net
additions to the US True Money Supply (TMS). However, the following chart
shows that from early-2014 through to the present the year-over-year rate
of growth in US TMS was remarkably stable at around 8%. Such
monetary-inflation consistency had not previously happened since at least
the 1950s (our money-supply data only goes back to 1959).
The lack of change in the US monetary inflation rate since the
beginning of 2014 was made possible by the actions of the US commercial
banking industry. First, as the Fed wound down its QE, the commercial
banks ramped up the rate at which they loaned new money into existence.
Then, after QE was over the commercial banks, as a group, maintained an
extremely stable rate of credit expansion. This is illustrated by the
following chart, which shows the year-over-year rate of growth in US
commercial bank credit.
The fact that over the past 2.5 years the commercial banking industry
did what it needed to do to almost exactly offset the ramping down and
removal of the Fed's printing press has led to some speculation that the
situation was engineered by the Fed. The speculation is that the Fed
coordinated with the commercial banks to ensure that the banks made enough
loans and monetised enough securities to keep the rate of money-supply
growth at around 8%.
The speculation is almost certainly wrong,
for three reasons. First, each bank will do what it believes to be in its
own financial interest. Second, there would be no way for the Fed to
micro-manage the operations of all the banks in such a way as to ensure a
particular overall level of deposit creation every month. Third, the Fed
doesn't calculate TMS and hasn't paid much attention to monetary
aggregates for decades.
The upshot is that the strangely-stable
rate of US money-supply growth has occurred by chance. In a way the Fed
got lucky, because bubble activities were sustained by the commercial
banks after they stopped being directly supported by the central bank.
However, providing enough monetary fuel to prevent a bubble from bursting
slows the long-term rate of progress by incentivising new mal-investments.
It also ensures that the eventual recession will be even more severe than
it would have been.
The UK
The
year-over-year rate of the UK's money-supply growth has oscillated between
2% and 6% since 2009. By modern standards this constitutes a slow average
rate of monetary inflation. Furthermore, early this year the monetary
inflation rate plunged from the top to near the bottom of the 7.5-year
range. This is a much bigger threat than "Brexit" to London's
property-investment bubble.

The relatively slow rate of UK monetary inflation over the past
several years will probably lead to a relatively strong Pound over the
coming few years.
Australia
Australia had a
relatively fast rate of monetary inflation during 2013-2015. This was both
a cause and an effect of the on-going property-investment bubble, in that
the continuing upward trend in prices provided the collateral needed to
support additional bank-lending (deposit creation) and the additional
deposit creation provided the fuel needed to sustain the upward trend in
prices.
The rate of money-supply growth has tapered over the past
12 months, which is a threat to the property bubble. If the rate continues
to slow then the property bubble will burst.
The Australian dollar's performance on the foreign exchange market
tends to be dominated by commodity prices. For example, when there is
broad-based strength in commodity prices, the A$ tends to be a relatively
strong currency almost regardless of what's happening in the Australian
economy.
Quick comment on the
oil market
The oil price turned down on
schedule in early-June and suffered a peak-to-trough decline of a little
more than 20%. This decline was probably a correction within the context
of an intermediate-term upward trend.
A rise to new highs for the
year appears to be underway, but the market is now a little 'overbought'.
Some consolidation would not be surprising.
With reference to the
following weekly chart, last year's high in the low-$60s will be the
logical target after the early-June high ($52) is breached.
Quick comment on
the T-Bond market
The iShares 20+ Year Treasury ETF
(TLT) appears to be coiling in preparation for a sharp move.
Unfortunately, the price action doesn't indicate the most likely direction
of the coming sharp move. We could be dealing with a topping (reversal)
pattern or we could be dealing with a consolidation (continuation)
pattern.
A daily close below 137 would clearly tip the scales in
favour of a topping pattern and a sharp decline.
The Stock Market
Current Market Situation
Throughout 2015 and during the first half of 2016 the US stock market
appeared to be roughly following the path it took during 2000-2001.
However, since the beginning of July-2016 the senior US stock indices have
deviated far enough from the 2000-2001 path to take the 2000-2002 bear
market out of contention as a viable price model.
To maintain the
validity of the 2000-2002 model the senior indices needed to roll over to
the downside within the past few months from below their 2015 highs. It is
clear from the following weekly chart of the Dow Industrials Index and
even clearer from the following weekly chart of the S&P500 Index (SPX)
that this didn't happen. Both the Dow and the SPX have broken decisively
above last year's highs.
Now, these upside breakouts could turn out
to be false, that is, they could turn out to be the type of break above
obvious resistance that happens shortly before the start of a large
decline. If so, the Dow will soon achieve a weekly close below 18250 and
the SPX will soon achieve a weekly close below 2125. In the absence of
such weekly closes below support it will be important not to get
enthusiastic about the potential for a large short-term decline.
Three factors are currently mitigating the downside risk in the US
stock market, the first of which could quickly disappear.
The first
factor is that market internals, which are based on the number of
individual stocks that are rallying, have generally been strong since
early-June. In other words, we are yet to see the sort of bearish
divergence in market internals that tends to occur prior to the start of a
large decline.
The other two factors are the 8%/year expansion of
the US money supply discussed above and the fact that the US stock market
is the only stock market of global importance that is over-valued and
'overbought'. Most other stock markets have experienced substantial
declines over the past 15 months and, as far as we can tell, offer
reasonable value, which means that other markets are positioned to help
rather than hurt the US market. This is different from 2000 and 2007, when
equities were very over-valued and overbought on a global basis.
The US stock market in gold terms
The US stock
market's situation in gold terms (as measured by the SPX/gold ratio) is
very different from its situation in US$ terms. As illustrated by the
following chart, the SPX/gold ratio peaked during the final quarter of
last year and then fell far enough to decisively break below its 50-week
MA. It has since consolidated below its 50-week MA, but hasn't yet broken
below its January low.
It would make sense for the stock market to peak in gold terms before
peaking in dollar terms. This is because the gold market should
inconspicuously begin to firm-up due to increasing risk aversion on the
part of the 'smart money' before signs of trouble become obvious in the
nominal price action. The Q4-2015 peak in the SPX/gold ratio can therefore
be viewed as a warning. It is warning that although there is no sign that
a downward reversal in the nominal SPX is imminent, such a reversal might
not be more than a couple of months away.
The SPX/gold ratio needs
to remain below its 50-week MA and break below its January low to provide
the next level of confirmation of a major trend change.
This week's
significant US economic events
[Notes:
1) The most important events
(to the markets) are shown
in bold. 2) A list of global economic events can be found
HERE]
| Date | Description |
| Monday August 22 | No important events scheduled |
| Tuesday August 23 | New Home Sales |
| Wednesday August 24 | Existing Home Sales |
| Thursday August 25 | Durable Goods Orders |
| Friday August 26 |
Q2 GDP (revised) Consumer Sentiment |
Gold and the Dollar