|
-- for the Week Commencing 22nd September 2003, 2nd Page
Gold and
the Dollar
Gold Stock Seasonality
The various markets exhibit tendencies
to be strong at certain times of the year and weak at other times of the
year, and some market participants place enormous importance on these seasonal
tendencies. Our experience, though, has been that while 'seasonality' works
more than 50% of the time, if you rely heavily on it you will be wiped
out. This is because the deviations from the 'normal' seasonal patterns
are sometimes very large. Therefore, rather than deferring to seasonal
patterns we think a more sensible approach is to consider 'seasonality'
to be one piece of a large puzzle. For example, it wouldn't, in our view,
make sense to sell in response to impending bearish seasonality if most
of the other pieces of the puzzle were decisively bullish.
With the preamble out of the way, let's
now consider one aspect of gold stock seasonality. What interests us right
now is the strong tendency demonstrated by gold stocks to reach an extreme
during the October-November period. As shown in the below table, gold stocks
have made either an important low or an important high during October-November
in 8 of the past 11 years with the three highs occurring in October and
4 of the 5 lows occurring in November.
|
Year
|
Extreme (High or Low)
|
|
Oct-Nov 2002
|
Low (Oct)
|
|
Oct-Nov 2001
|
Low (Nov)
|
|
Oct-Nov 2000
|
Low (Nov)
|
|
Oct-Nov 1999
|
High (Oct)
|
|
Oct-Nov 1998
|
High (Oct)
|
|
Oct-Nov 1997
|
High (Oct)
|
|
Oct-Nov 1996
|
-
|
|
Oct-Nov 1995
|
Low (Nov)
|
|
Oct-Nov 1994
|
-
|
|
Oct-Nov 1993
|
-
|
|
Oct-Nov 1992
|
Low (Nov)
|
The above-described gold stock seasonality
suggests that the October-November period this year will provide us with
either a major peak or a major trough. Given the surge in gold stock prices
over the past several months the only way that October-November could turn
out to be the time of a major low would be if gold stocks crashed over
the next several weeks. At this stage, however, a crash is not an outcome
that appears at all likely as far as the next 1-2 months are concerned.
Therefore, the seasonal pattern suggests that a major peak will occur during
October-November this year. Such an outcome, by the way, is consistent
with much of our other work.
Taking the seasonality one step further,
gold-stock lows have tended to occur in November whereas highs have tended
to occur in October, which, on the surface, suggests that October is the
most likely candidate for a gold-stock peak. However, many seasonal patterns
have been reversed over the past 12 months. For example; October is often
a month where an important low occurs in the overall stock market, but
the way things are currently shaping up there is a much greater chance
of the stock market making a major high than a major low during October-2003.
Given the likelihood of gold stocks peaking a few weeks after a peak in
the overall stock market we therefore think November is actually the better
candidate for a major gold-stock peak.
Valuation comparison of 3 gold/copper
producers
Below is a table comparing the amounts
that investors at today's prices are paying for gold-equivalent reserve
ounces when they purchase shares of Wheaton River Minerals (AMEX: WHT),
Northgate Exploration (AMEX: NXG), and Northern Orion Resources (TSX: NNO).
The table shows that the most value and the most leverage is obtained via
NNO and the least value/leverage is obtained via WHT. What the raw figures
don't show, however, is that most of NNO's value comes from its ownership
of the Agua Rica project in Argentina, a project that is years away from
production. If we make an allowance for the amount of money it will take
to bring Agua Rica into production then NNO's price/ounce would move into
line with that of NXG.
Out of these three stocks NXG appears
to offer the most value when downside risk as well as upside potential
are taken into account while WHT appears to offer the least value. NXG
has the distinct advantages that all of its resources are located in one
location in a country that offers relative political safety (Canada) and
that a large portion of its resources will probably soon be converted to
the reserve category. In fact, we can't see a good reason why NXG should
sell at any discount to WHT, let alone the huge discount at which it presently
sells.
| Symbol |
Recent Price (US$) |
Ent. Value (US$M) |
Annual Prodn. (Koz) |
Adjusted Reserves (Moz) |
EV$ per oz prodn. (US$) |
EV$ per oz reserves (US$) |
| WHT |
1.97 |
1,343 |
800 |
10.5 |
1,679 |
128 |
| NXG |
1.72 |
403 |
450 |
7.4 |
896 |
54 |
| NNO |
1.60 |
187 |
216 |
6.6 |
867 |
29 |
Table notes:
1. Enterprise Value (EV) is equal
to market capitalisation plus net debt
2. Copper resources, reserves and
production have been converted to gold-equivalent figures for the above
comparison.
3. "Adjusted Reserves" is equal to
reserves plus 50% of resources
Currency Update
Reuters, September 20: "U.S. Treasury
Secretary John Snow claimed a win on Saturday in his campaign to make flexible
currency rates a global standard as key industrial nations agreed trade
benefits from less government involvement.
A closing statement from
a meeting of the Group of Seven finance ministers -- the United States,
Britain, Canada, France, Germany, Italy and Japan -- said a flexible currency
rate "is desirable for major countries or economic areas" in order to let
markets smooth out economic ups-and downs.
The groundbreaking commitment was
clearly aimed at showing disapproval of countries that use pegged currency
rates, or that intervene heavily in markets to affect their currency's
values, in order to keep their export prices low. Snow traveled through
Asia earlier this month, making the same case virtually word-for-word in
a trip to Japan, China and Thailand that was seen as a bid to pressure
China into letting its yuan currency trade beyond its current decade-old
peg of about 8.28 yuan to the U.S. dollar."
The Japanese Yen broke above major
resistance on Friday, perhaps forewarning of the agreement on currency
exchange rates described in the above Reuters article. Furthermore, if
the G7 is serious about letting the markets determine currency exchange
rates then the Yen is going to move sharply higher over the next few weeks
because it was only massive intervention on the part of the Bank of Japan
(BOJ) that had kept the Yen from breaking higher much sooner. The BOJ's
previous 'line in the sand' was around the 115-116 Yen per Dollar level.
The rate was around 114 Yen per Dollar at the end of last week and if the
BOJ stays out of the way the exchange rate will probably move to around
100 Yen per Dollar by year-end.
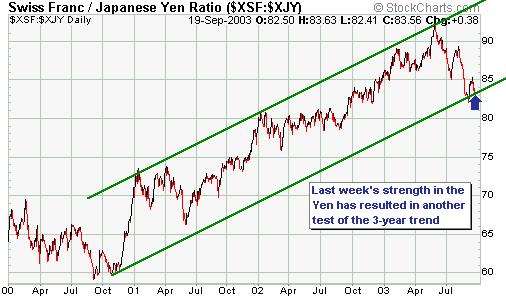
We expect that a sharp upward revaluation
of the Yen by the market would initially be positive for gold, but could
eventually turn into a negative if it results in a large downward move
in the Swiss Franc relative to the Yen. As explained in a previous commentary,
one of the trends that has characterised the financial market environment
over the past few years has been the upward trend in the SF against the
Yen (see chart below). A decisive break of this upward trend, something
that would be likely to occur if the Yen were permitted to respond to natural
market forces over the coming months, would possibly be a sign that the
financial market environment was about to turn bearish for gold for a while.
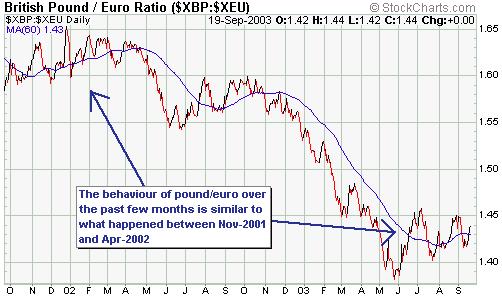
Below is a chart of the British Pound
in terms of the euro. Pound/euro tends to move in advance of US$/euro,
that is, the Pound tends to turn higher or lower against the euro prior
to a similar turn in the US$ against the euro. Therefore, we watch the
performance of Pound/euro relative to its 60-day moving average for signs
that the trend in US$/euro is about to change.
The US$ has recently been very weak,
but late last week Pound/euro moved back above its 60-day MA. This, in
turn, suggests that the next major decline in the US$ is not about to commence.
Rather, what appears to be underway is a period of consolidation similar
to that which occurred between November of 2001 and April of 2002. And
this period of consolidation will almost certainly be followed by a drop
in the Dollar Index to well below 90 (we expect the Dollar Index to drop
to around 80 over the coming 6-9 months).
Gold
Below is a long-term chart of the gold
price. Our 3-month target is the major resistance in the $405-$425 range,
a resistance range that is unlikely to be overcome on the first attempt.
In fact, we doubt that a sustainable move above this resistance will occur
during the coming 12 months, although a short-lived spike up to around
$450 wouldn't be surprising. Our expectation is that the gold price will
move up to this resistance over the coming few months and perhaps briefly
spike above it, but will then spend at least 12 months consolidating in
the $350-$420 range before resuming its ascent. This consolidation, if
the story unfolds roughly in line with our expectations, would allow the
large speculative position in COMEX gold futures to be worked off and would
coincide with a major counter-trend rally in the US$. Note, though, that
our gold price expectations are not set in stone and are dependent on,
amongst other things, the action in the currency and debt markets.
Current Market Situation
Earlier in today's commentary we discussed
the cyclical behaviour of gold stocks which might, this year, result in
a November peak. Once again, this is not an expectation that is set in
stone but is something that will be at the forefront of our minds if gold
stocks move to new highs in November.
Currently, gold stocks are overbought
and would be unlikely to move higher in straight-line fashion between now
and November. A more likely scenario is shown on the below chart of the
AMEX Gold BUGS Index (HUI). Note that if gold stocks do move higher over
the next few weeks, rather than pulling back as projected on the below
chart, it would probably mean that a major peak was going to occur earlier
than November.
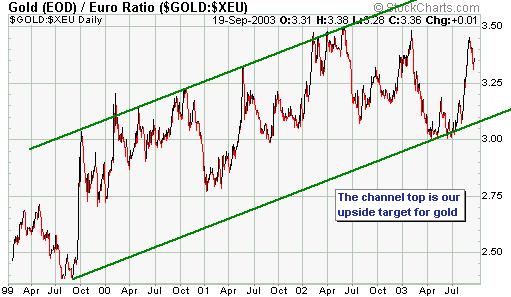
Below is a chart of the gold price
in terms of the euro. For some time our medium-term target for the gold
price has been the top of the major channel shown on this chart, which
would correspond to a price of around 370 euros if the channel top were
reached before year-end.
Update
on Stock Selections
 We
have been bullish on the Japanese stock market and added Japan iShares
(AMEX: EWJ) to the Stocks List in early June to reflect this view. However,
the recent surge in Japanese stock prices has significantly increased the
short-term downside risk. Therefore, although we remain long-term bullish
on Japan we are going to exit EWJ now for a profit of about 33%. We
have been bullish on the Japanese stock market and added Japan iShares
(AMEX: EWJ) to the Stocks List in early June to reflect this view. However,
the recent surge in Japanese stock prices has significantly increased the
short-term downside risk. Therefore, although we remain long-term bullish
on Japan we are going to exit EWJ now for a profit of about 33%.
We
plan to send out a Stock Selection Update e-mail to paid-up subscribers
on Monday or Tuesday of this week.
Stockbrokers
We strongly suggest that you do not
let the limitations of your current stockbroker restrict your ability to
participate in the gold-stock bull market. Many of the most interesting
junior gold/silver stocks only trade on the Canadian exchanges and you
should therefore have an account with a broker that can trade the Canadian
stocks. (Most of the Canadian juniors also trade on the "Pink Sheets" market
in the US but this market should generally be avoided due to the very wide
buy/sell spreads that typically apply).
In the 20th August Interim Update we
mentioned 2 US-based brokers (Barry Murphy and Co. and Pennaluna and Co.)
that could be used for trading stocks on the Canadian exchanges. There
are no doubt many others, but based on what we know from our own research
and the experience of people we trust we are confident that both of these
companies will offer our readers with a high level of service. Barry Murphy
and Co. (ph: 1800 2212111 or 617 4261770) will execute orders on Canadian
exchanges for a flat rate of US$29.95 per trade, but please note that you
need to identify yourself as a TSI subscriber in order to get this rate.
Opportunity
to participate in non-brokered private placements
If you are a private investor with
liquid assets in excess of US$1M or a professional money manager and would
like the chance to participate in private placements of shares in junior
mining companies, please let us know and we'll put you in touch with a
company that is in the business of arranging such equity financings. The
company we have in mind has been involved in many private placements of
equity over the past year, the vast majority of which have proven to be
successful as far as investors in the placements were concerned. Your name
would go on a list of potential investors and you would be notified of
opportunities as they arose.
We stress that this opportunity is
only suitable for experienced investors who a) have liquid assets of more
than US$1M, b) have a medium-term time horizon (since the new shares are
often subject to a mandatory 4-month hold period), and c) can tolerate
the volatility of the junior mining sector. The minimum amount of an investment
in each placement would typically be around US$50K.
The advantage of participating in the
private placements is that you would have the chance to take sizeable positions
in small companies at below the current market price (the discount is usually
around 20%).
Copyright
Reminder
The commentaries that appear at TSI
are copyrighted material and may not be distributed, in full or in part,
without our written permission. In particular, please note that the posting
of extracts from TSI commentary at other web sites (for example, at discussion
boards) without our written permission is a breach of copyright.
Chart Sources
Charts appearing in today's commentary
are courtesy of:
http://stockcharts.com/index.html
http://www.futuresource.com/
http://bigcharts.marketwatch.com/

|
