|
-- Weekly Market Update for the Week Commencing 22nd November 2004
Big Picture
View
Here is a summary of our big picture
view of the markets. Note that our short-term views may differ from our
big picture view.
Bond yields (long-term interest
rates) bottomed in June of 2003 at around 4.2% and will move considerably higher during
2004 and 2005. (Last update: 12 January 2004)
The stock market rally that
began in October of 2002 will end during the first half of 2005. The October-2002
bottom (775 for the S&P500) will be tested during 2006. (Last update: 08 November 2004)
The Dollar made an
intermediate-term
bottom in February of 2004 and will move higher into the first half of 2005. A long-term
bottom won't occur until
2008-2010. (Last update: 26 July 2004)
Gold made an intermediate-term
peak during the first half of 2004, but a long-term peak won't occur until 2008-2010. (Last update: 12 July 2004)
Commodities, as represented
by the CRB Index, made an intermediate-term peak during the first
half of 2004, but a long-term
peak won't occur until 2008-2010. (Last update: 12 July 2004)
Copyright
Reminder
The commentaries that appear at TSI
may not be distributed, in full or in part, without our written permission.
In particular, please note that the posting of extracts from TSI commentaries
at other web sites or providing links to TSI commentaries at other web
sites (for example, at discussion boards) without our written permission
is prohibited.
We reserve the right to immediately
terminate the subscription of any TSI subscriber who distributes the TSI
commentaries without our written permission.
Outlook Summary
Market
|
Short-Term
(0-3 month)
|
Intermediate-Term
(3-12 month)
|
Long-Term
(1-5 Year)
|
Gold
|
Bullish
(18-Aug-04)
|
Bullish
(10-May-04)
|
Bullish
|
US$ (Dollar Index)
|
Bearish
(18-Oct-04)
| Bullish
(31-May-04)
|
Bearish
|
Bonds (US T-Bond)
|
Bearish
(20-Sep-04)
|
Bearish
(20-Sep-04)
|
Bearish
|
Stock Market (S&P500)
|
Bullish
(27-Oct-04)
|
Neutral
(8-Sep-04)
|
Bearish
|
Gold Stocks (HUI)
|
Bullish
(08-Nov-04)
|
Bullish
(10-May-04)
|
Bullish
|
General Commodities (CRB)
|
Bullish
(29-Sep-04)
|
Bullish
(13-Sep-04)
|
Bullish
|
Notes:
1. In those cases where we have been able to identify the commentary in
which the most recent outlook change occurred we've put the date of the
commentary below the current outlook.
2. "Neutral", in the above table, means that we either don't have a
firm opinion on which way the market will move or that we expect the
market to be trendless during the timeframe in question.
Bonds
Below is a daily chart of December T-Note futures.
There was a moderate downside reaction on Friday, but the T-Notes
remain between support at 111.50 and resistance at 114.50. We expect
that when a breakout from this 111.50-114.50 range occurs it will be to
the downside, but as discussed in previous commentaries a downside
breakout in the bond market probably won't occur until there is an
upward reversal in the dollar.
We think that a break below 111.50 would quickly lead to a test of the May-June lows.
Commodities
Below is a daily chart of the CRB Index covering the past two years.
Our view is that the CRB Index is currently in the final upward phase
of the bull market leg that began in 2001 and that it will peak
somewhere within the 300-340 range by the middle of next year at the
latest. Furthermore, we think that this final upward phase will be
characterised by relative strength in the grains and other food
commodities.
The below chart of Canadian base-metal producer Teck Cominco shows that
the stock experienced a parabolic rise over the past few weeks. This
type of rise generally occurs towards the END of a rally, so the stocks
of metal producers might be about to take a breather.
The Stock
Market
Oil and the Stock Market
It's not coincidental that the very strong upward move in global stock
markets over the past 4 weeks occurred in parallel with a sharp drop in
the oil price. It's also not coincidental that the stock market rally
finally ran out of steam on Friday concurrently with a sharp upward
move in the oil price.
Friday's 5% surge in December crude oil futures stands out on the
following chart and represents a clear signal that a short-term low is
in place in the oil market. In our opinion, the rebound that began on
Friday will continue for a while (1-3 weeks?) after which oil's
intermediate-term downward trend will resume. And as long as this
rebound in the oil market is in progress there will be downward
pressure on the stock market.

Greenspan and the Stock Market
...Friday's surge in the oil price was of far greater significance to the stock market than anything Greenspan said...
Greenspan stated the obvious in a speech on Friday when he pointed out
that if the US current account deficit continued to rise then foreign
investors would eventually demand a higher return on their
dollar-denominated investments, thus increasing the cost of financing
the deficit.
Whenever a move in the financial markets coincides with some news the
mainstream financial press, and even parts of the non-mainstream press,
will invariably link the market move to the news on the faulty
assumption that if 'news event A' coincides with 'market move B' then A
must have caused B. We are extremely confident, though, that Friday's
surge in the oil price was of far greater significance to the stock
market than anything Greenspan said during or after his speech, as was
the simple truth that prior to Friday's session the stock market had
spent more than three weeks rising in straight-line fashion.
Current Market Situation
We've been anticipating a pullback in the stock market over the past
couple of weeks and Friday's action suggests that it might now be
underway, helped along by a powerful upward reversal in the oil price.
As noted in last week's Interim Update, a routine pullback would be
expected to take the S&P500 Index back to 1163 or potentially as
low as the mid-1140s.
We continue to expect that new recovery highs will be seen after this pullback runs its course.
This week's
important US economic events
| Date |
Description |
Monday Nov 22
| No significant events
|
Tuesday Nov 23
| Existing Home Sales
|
Wednesday Nov 24
| New Home Sales
Durable Goods Orders
|
Thursday Nov 25
| US markets closed for Thanksgiving
|
Friday Nov 26
| No significant events
|
Gold and
the Dollar
Reviewing our intermediate-term dollar outlook
...the
current-account situation tells us nothing about what the dollar is
likely to do over the next 12 months... ...changes in REAL interest
rates, where the real interest rate is calculated by subtracting the
EXPECTED inflation rate from the nominal interest rate, are the main
influence on the dollar's trend over any 12-month period. ...The US$ is
in the final blow-off stage of the decline that began between the final
quarter of 2000 and the first quarter of 2002.
Having spent much of the past 4 years arguing that the dollar was going
to fall we have, over the past several months, found ourselves in the
uncustomary position of explaining why a lengthy dollar rally was in
the offing. With the dollar hitting a new bear-market low last Friday
now is a good time to re-visit our bullish intermediate-term outlook,
starting with a summary of the bearish case against the dollar.
As far as the coming year is concerned, a VALID bearish case does not
revolve around the huge and growing US current account deficit. What
the huge US current account deficit does tell us is that the dollar
remains extremely over-valued despite its 3-year decline and that
long-term investments in US Treasury debt are almost guaranteed to
provide poor real returns over the coming 5 years. However, the
current-account situation tells us nothing about what the dollar is
likely to do over the next 12 months because it is not uncommon for
over-valued markets in long-term bearish trends to experience
counter-trend rallies lasting 12 months or longer, particularly after
they have become extremely oversold. The US stock market is a case in
point in that it is probably just as over-valued as the US dollar and
yet it is now in the 3rd year of an upward trend. Furthermore, a
comparison of the quarterly US current account balance and the US
dollar's exchange value over the past 33 years will reveal no
consistent relationship between the two as far as the dollar's
performance during any given 12-month period is concerned.
The huge and growing US budget deficit is also not a valid reason to be
bearish on the dollar because history tells us that there is no
consistent inverse correlation between the foreign exchange value of
the dollar and the US budget deficit.
So, given that we can eliminate two of the most popular reasons cited
for a continuation of the dollar's decline, is it possible to make a valid argument
that the dollar will be trading significantly lower in 12 months time
than it is today?
The answer is yes; a valid intermediate-term bearish case against the
dollar could be made by showing that inflation expectations were likely
to rise appreciably over the coming 12 months. Or, to be more accurate,
by showing that US inflation expectations were likely to rise at a
faster rate than nominal US interest rates. The reason is that changes
in REAL interest rates, where the real interest rate is calculated by
subtracting the EXPECTED inflation rate from the nominal interest rate,
are the main influence on the dollar's trend over any 12-month period.
Now, changes in the expected inflation rate can't be measured but their
effects can be observed. For instance, when inflation expectations are
rising it is likely that long-term interest rates will be increasing
relative to short-term interest rates because the longer the term of
the debt the more a lender will want to be compensated for the risk of
future currency depreciation.
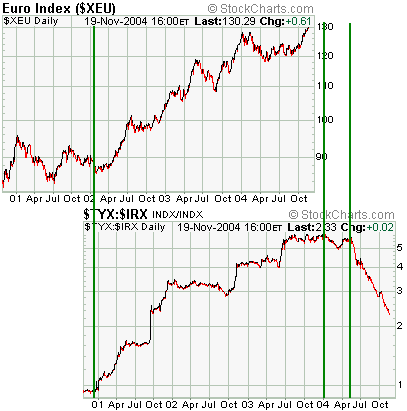
As such we've included, below, two charts that show how the currency
market has been affected by changes in long-term interest rates
relative to short-term interest rates.
The first chart shows the performance of the euro over the past 4 years
versus the performance of the TYX/IRX ratio (the 30-year T-Bond yield
divided by the 13-week T-Bill yield), with the charts offset by about
14 months to account for the currency market's delayed reaction to the
widening of the US yield-spread that began during the final quarter of
2000. Note, in particular, that the euro stopped falling once the US
yield-spread began trending higher but it wasn't until after the
yield-spread had been rising for about 14 months that the euro embarked
on a strong upward trend. Also, note that if there is a similar delay
at the completion of this trend as there was at its beginning then the
euro will remain reasonably firm until early-2005 and won't begin to
trend lower in earnest until the second quarter of 2005.
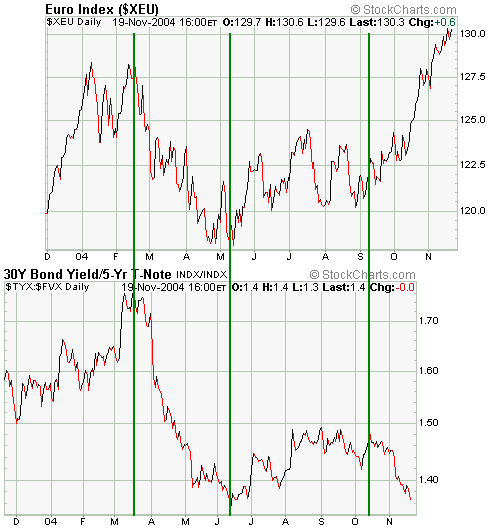
The second chart
shows the performance of the euro over the past 12 months versus the
performance of the TYX/FVX ratio (the 30-year T-Bond yield divided by
the 5-year T-Note yield), with the charts offset by about one month.
Note that there was a strong positive correlation between the two
markets until September-October of this year, at which point the euro
began to accelerate higher while the TYX/FVX began to decline. This
recent divergence between the two markets suggests that either we are
seeing a speculative blow-off in the euro which is not supported by the
underlying fundamentals or that we are about to see a surge in 30-year
interest rates RELATIVE TO 5-year interest rates to bring TYX/FVX into
line with the currency market. Our guess is that it will turn out to be
the former.
To sum up, the points we've just tried to make are:
a) Arguments to the effect that the dollar will continue to fall over
the coming 12 months BECAUSE OF the US current account deficit will
look right as long as the dollar remains in a short-term downtrend, but
are seriously flawed.
b) The US$ is in the final blow-off stage of the decline that began
between the final quarter of 2000 and the first quarter of 2002.
c) It's possible that the ultimate low for the dollar won't occur until
the first quarter of 2005 and that a strong upward trend won't begin
until the second quarter of 2005, but the dollar's downside potential
from here is minimal UNLESS inflation expectations begin to surge.
Our view, in a nutshell, is that the Dollar Index will be trading at a
much higher level in 12 months time than it is today. We stress,
though, that right now there is no evidence that the dollar's
short-term downward trend has ended. In particular, an end to the
short-term downward trend should become evident in the performances of
gold and gold stocks before it becomes evident in the currency market,
and at this stage there are no signs that the bullish trends in gold
and gold stocks have come to an end. For now, therefore, we remain
short-term BEARISH and intermediate-term BULLISH on the US$.
Gold Ratios
...we are far less bearish on the Dollar Index than we are bullish on gold...
We mentioned, above, that US inflation expectations would have to rise
in order for the dollar to continue its decline. However, it would be
more correct to say that the expected US inflation rate will have to
rise relative to the expected European inflation rate in order for the
dollar to continue its decline against the euro. In other words, it
would be quite conceivable for the dollar to rally against the euro
amidst rising US inflation expectations if European inflation
expectations were rising at an even faster rate. In fact, such a
situation is likely to occur at some point over the coming years and is
the reason we are far less bearish on the Dollar Index than we are
bullish on gold (central-bank-sponsored inflation will probably end up
pushing gold sharply higher in terms of ALL the major fiat currencies).
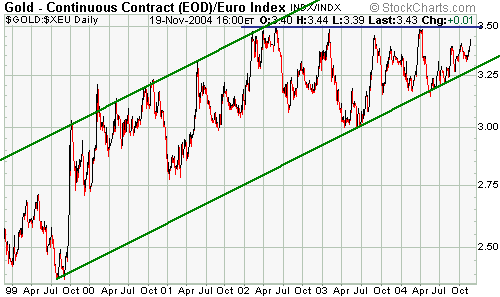
The below chart shows that gold has been trending higher against the
euro since July of 1999, but has spent the past 2.5 years in a sideways
consolidation with the top of this consolidation range (around 350
euros) having been tested several times. Now, each successful test of a
resistance level weakens the resistance and increases the probability
that the next test will be the one that fails, that is, the one that
leads to an upside breakout, so there's a good chance that when a
breakout in gold/euro does finally occur it will be to the upside. An
upside breakout, in turn, would project a move up to around 400 euros
(equivalent to US$520 at the current euro/US$ exchange rate).
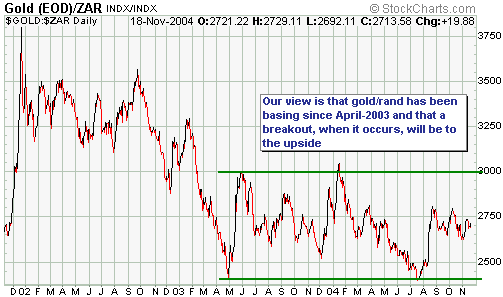
In terms of the South
African Rand, our view is that gold has been basing since May of 2003
(see chart below). A breakout from the lengthy basing pattern in
gold/rand would project a move up to around 3500, which would obviously
be a boon to marginal South African gold producers such as Harmony and
Durban Deep. The chart doesn't, however, provide any clues with regard
to the timing of a breakout.
Gold and Silver Stocks
...what
has occurred [in the HUI/gold ratio] over the past few weeks still
looks more like a sideways consolidation than a trend reversal. ...a
move to new highs by the HUI would suggest that we were going to get
another upside blow-off in the silver stocks.
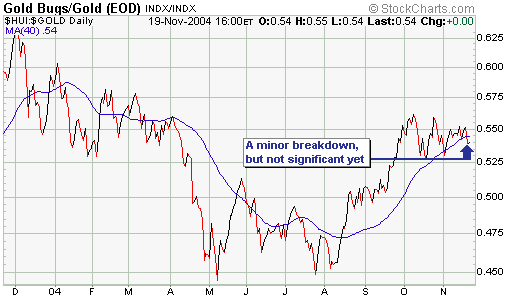
The HUI/gold ratio ended last week below its 40-day moving average (see
chart below), but the breakdown was too minor to be of any
significance. When the trend changes for real what we'd expect to see
is a sharp drop in HUI/gold, but what has occurred over the past few
weeks still looks more like a sideways consolidation than a trend
reversal.
Below is a chart
showing the stock price of Pan American Silver (NASDAQ: PAAS) divided
by the stock price of Newmont Mining (NYSE: NEM). PAAS is a lot more
speculative than NEM and is certainly not a "blue chip" stock, but it
is probably the closest thing to a blue chip stock within the silver
sector and is a reasonable proxy for the sector. The below chart
therefore indicates that:
a) Silver stocks have been trending higher relative to gold stocks since the second quarter of 2001
b) The more speculative precious metal stocks have been trending higher
relative to the "blue chips" since the second quarter of 2001
c) There was a spectacular surge in PAAS/NEM to its channel top during
the 3 months leading up to the 2002 and 2004 peaks in gold and silver
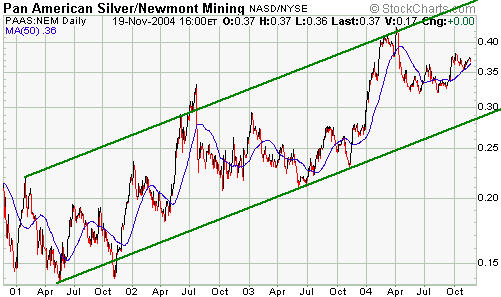
The rally in gold and
silver stocks that began in May of this year hasn't yet led to the type
of surge in PAAS/NEM that marked important tops in 2002 and 2004. This
either means that the May-November rally is a counter-trend rebound
within an on-going correction and that the next big move in PAAS/NEM
will be a drop to the channel bottom, or that a spectacular surge lies
ahead of us. We think it's more likely to be the former because
previous corrections in PAAS/NEM haven't ended until the channel bottom
has been reached, but a move to new highs by the HUI would suggest that
we were going to get another upside blow-off in the silver stocks.
The British Pound versus the Euro
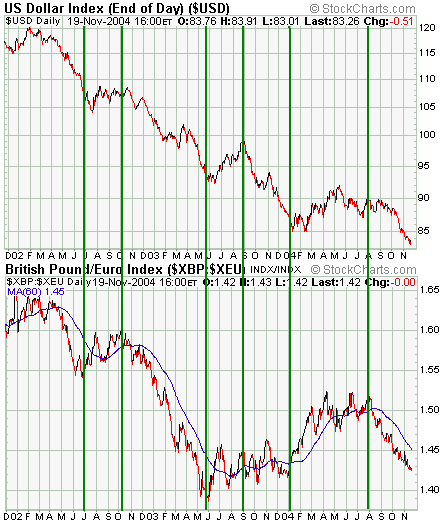
As illustrated on the below chart, the pound/euro exchange rate
generally moves in the same direction as the Dollar Index. In other
words, the Pound usually strengthens against the euro when the US$ is
trending higher and weakens against the euro when the US$ is trending
lower.
Also, although it's not readily apparent on the below chart the
pound/euro exchange rate tends to lead the Dollar Index by a short
amount of time at the intermediate-term turning points. So with
pound/euro hitting a new low for the move at the end of last week there
isn't yet any evidence of a trend reversal.
Current Market Situation
...the
currency and gold markets are potentially close to important turning
points but there are no signs of trend reversals at this time.
At the risk of sounding like a broken record we'll reiterate our view
that the currency and gold markets are potentially close to important
turning points but there are no signs of trend reversals at this time.
In particular, gold continues to move higher in orderly fashion and the
gold stocks have not demonstrated significant weakness relative to the
gold price.
However, just because nothing has changed doesn't mean that the current
situation is not interesting. In fact, we've found the market action
over the past couple of months to be fascinating, and continue to do
so, which might just mean that we are easily fascinated or that
following the tedium of May-August almost anything would be equivalent
to a breath of fresh air. In any case, when markets are trending as
they have been over the past 2-3 months, as opposed to oscillating
within trading ranges which is what they were doing over the preceding
four months, then a lot more money-making opportunities present
themselves.
Quick note on silver
With gold having broken decisively to new highs it's likely that silver will move up to test its April peak ($8.50).
The new gold ETF
GLD, the new gold ETF, began trading on the NYSE last week. Each GLD
share represents 0.1 ounce of gold and so far the shares have traded at
almost exactly 0.1-times the spot gold price, that is, they have traded
at a premium to net asset value of close to zero. As a consequence, the
premiums to net asset value at which competing investments such as the
Central Gold Trust (TSX: GTU.UN) and the Central Fund of Canada (CEF)
trade have continued to shrink.
Gold is classified as a collectible by the IRS and is therefore taxed
at a higher 28 percent capital-gains rate in the United States after
being held for more than one year. As a result, profits made by US
citizens on the sale of GLD shares will be taxed at a 28% rate assuming
the shares are held for more than one year, whereas, we believe,
profits made on the sale of GTU and CEF shares will attract a lower tax
rate (*). For this reason it might be reasonable for US citizens to pay
a small premium -- 2%-3%, for instance -- for shares of CEF or GTU
rather than buy the GLD shares at zero premium. Also, we like CEF at
its current premium of around 2.3% because it provides exposure to
silver as well as gold.
*We are definitely
NOT experts on the US tax code so you should not act on this
information before checking with your accountant or financial advisor
Update
on Stock Selections
 Last
Thursday First Majestic Resource (TSXV: FR) announced the purchase of
the Dios Padre silver mine in Mexico for a consideration of US$6.5M
(plus 500,000 FR shares) to be paid in stages over the coming 3 years. Last
Thursday First Majestic Resource (TSXV: FR) announced the purchase of
the Dios Padre silver mine in Mexico for a consideration of US$6.5M
(plus 500,000 FR shares) to be paid in stages over the coming 3 years.
The following information on resources at Dios Padre was included in
FR's press release, but note that these resource estimates do not
conform to National Instrument 43-101 and will need to be verified by
FR's due diligence over the coming six months before they can be relied
upon:
"As stated in the most
recent report known by the company, dated December, 2002, published by
David A. Bending, MSc, PGeo, of Reno, Nev.; using a conservative
resource model focusing on resources in the accessible upper levels of
the mine, 3.5 million tonnes grading 465 grams per tonne (g/t)
containing 57,211,000 ounces of silver has been estimated which appears
to be amenable to open pit mining. It also appears by reviewing this
and other reports on the Dios Padre silver mine, the ore responds well
to conventional milling and flotation. The on-site mill appears to have
yielded historic recoveries of up to 87 per cent silver."
So, assuming that FR's due diligence program is able to verify the
above-mentioned resource estimate then FR has just committed to spend
US$6.5M to buy a high-grade silver deposit amenable to open pit mining
containing US$427M of silver. Sounds like a good deal to us. Pending a
successful conclusion to the due diligence program FR will be out of
pocket to the tune of US$300K (the initial payment).
The FR stock price had moved up quite sharply during the two weeks
leading up to the announcement of its latest acquisition and therefore
didn't react much to what is potentially very good news. From a
technical perspective C$2.50 looks like a reasonable short-term target
for the stock and prior to last week's news we had a valuation-based
12-month target of C$3-C$4. Our valuation will increase substantially
if the aforementioned resource is confirmed, but at this stage we will
be conservative and stick with C$3-C$4.
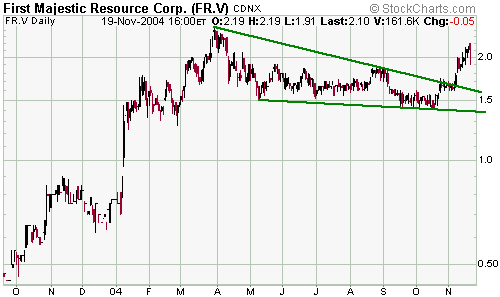
In general, it's not
a good idea to buy stocks after they have just run-up in price. In FR's
case, for example, we think the stock offers good value at Friday's
closing price of C$2.10 and might even work well as a short-term trade
if the silver price moves up to test its April peak, but note that the
short-term risk of buying now is higher than it was when we recommended
the stock in the 1.50s and 1.60s earlier this year (between July and
October we highlighted the stock 4 times at prices ranging from 1.51 to
1.64). The idea is to buy the stocks during consolidations when few
people are interested, so what we endeavour to do in the TSI
commentaries and e-mails is highlight our favourite stocks when the
short-term downside risk is relatively low. This is typically when they
look 'sold out' or when they are immersed in drawn-out consolidation
patterns. It doesn't always work well, but it beats jumping in after a
lot of other people have already jumped in.
 We
mention the cash percentage in our own account (to the nearest 5%) at
the top of the Stock Selections List at the TSI web site. This should
not be considered a recommendation because each person's goals and
financial situation will be different, but provides a way for us to
quantify how we view general market risk (the higher the cash % the
higher the perceived risk). We
mention the cash percentage in our own account (to the nearest 5%) at
the top of the Stock Selections List at the TSI web site. This should
not be considered a recommendation because each person's goals and
financial situation will be different, but provides a way for us to
quantify how we view general market risk (the higher the cash % the
higher the perceived risk).
We had planned to maintain the cash proportion at around 40%, but due
mostly to gains in some of our gold and silver stocks the cash
percentage actually fell below 30 at one point last week. We've since
boosted it to around 35% and plan to move back to around 40% cash
within the next two weeks.
Maintaining a sizeable cash percentage is, in our opinion, the best way
to hedge against general stock market risk, particularly if you own a
lot of speculative stocks (junior gold and silver stocks, for
instance). Another way is to buy put options.
In the TSI Stocks List we currently have a position in TLT January-2005
$85 put options. These options, which closed at US$0.50-0.55 on Friday,
are a bet that long-term interest rates will move higher over the
coming two months (TLT is an exchange-traded fund that moves in the
opposite direction to the yield on long-dated Treasury debt). The
options could also be considered as a hedge against a reversal in the
gold market because if we do get a jump in long-term interest rates
over the next two months it will probably be the result of an upward
reversal in the US$.
A more direct way to hedge against a reversal in the gold market would
be to purchase Newmont Mining put options. There are no signs of a
reversal at this stage, but we do see it as a significant short-term
risk and will therefore add a position in NEM January-2005 $42.50 put
options to the Stocks List at US$0.50 (the options closed at 0.45-0.55
on Friday).
With some commodity stocks having just experienced blow-off moves to
the upside and with the bond market appearing to be a bit shaky, Phelps
Dodge put options look interesting right now. However, given that a) we
only have two copper stocks in the TSI List, b) we are already hedging
against a rise in the US$ and a fall in the bond market via the TLT and
NEM puts mentioned above, and c) the general stock market trend is
likely to remain positive into early 2005, we won't add any PD puts to
the List.
Chart Sources
Charts appearing in today's commentary
are courtesy of:
http://stockcharts.com/index.html
http://www.futuresource.com/

|

