|
-- for the Week Commencing 22nd December 2003, 2nd Page
Bonds
The below weekly chart shows that Japanese
Government Bond (JGB) futures remain within consolidation between major
resistance at 139 and major support at 135.5. A decisive weekly close above
139 or below 135.5 by the JGBs would have huge ramifications for bonds
throughout the world.
As an aside, over the past few weeks
we've explained why an upside breakout in the oil price would probably
be followed, 3-4 months later, by an upside breakout in the US bond market.
However, we don't know yet whether the recent upside breakout in the oil
price is going to 'stick'.
Commodities
Relative weakness in the commodity
currencies (e.g., the A$, the C$, the Rand) over the past few weeks might
be forewarning of a substantial correction in commodity prices during the
first half of next year. This would, in turn, be consistent with our expectations
for stock market weakness beginning during the first quarter and economic
weakness beginning by early in the second quarter. We plan to cover this
topic in more detail in the next commentary.
As far as the next 6 months are concerned,
gold, the monetary metal, has an attractive risk/reward ratio due to its
counter-cyclical nature.
Gold and
the Dollar
Gold Stocks
From the 10th December Interim Update:
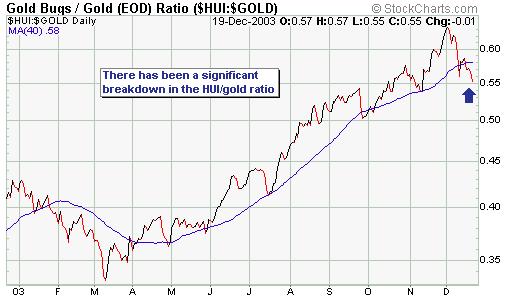
"A continued decline in HUI/gold
combined with a daily close below 223 in the HUI would be compelling evidence
that an intermediate-term peak was in place for the gold sector. However,
even if this evidence does materialise it should not be interpreted as
a signal to immediately liquidate all gold-stock holdings, for two reasons.
First, after a market makes an important peak and then drops sharply a
rally invariably occurs that retraces at least 50% (potentially as much
as 100%) of the initial decline. If you miss the chance to take profits
near the peak then the next best time to take them is during the retracement
rally following the initial decline. Second, even if the HUI has peaked
we expect that some of our junior gold (and silver) stocks will make new
highs over the coming months in response to exploration/acquisition news.
As far as we are concerned, now
is NOT an ideal time for a peak in the gold sector. This is because the
Dow Industrials Index has either just peaked this week or, more likely,
is going to peak early next year, and the strong tendency is for gold stocks
to peak a few weeks or more AFTER the Dow. It would therefore make more
sense to us if the HUI held above support and proceeded to new highs over
the next 1-2 months. We will, though, respect our indicators if they happen
to signal that a peak is already in place."
The Dow Industrials Index continues
to make new highs, suggesting that the ultimate peak for the gold sector
is not yet in place. However, we have seen a continuing decline
in HUI/gold and the HUI ended last week only marginally above important
short-term support (see charts below). This support has a good chance of
holding for now, but if it doesn't then, as mentioned in our 10th December
commentary, we will have some compelling evidence that an intermediate-term
peak is in place for the gold sector.
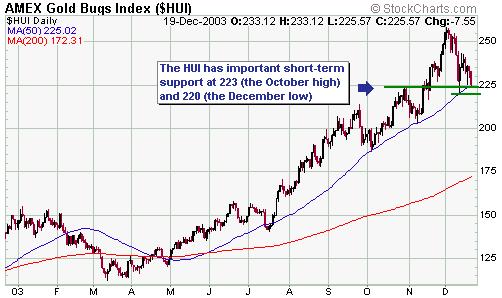
If the HUI does close below support
(we'll use last week's low of 220 as the critical level rather than 223)
then we think it will be appropriate to scale back on exposure to the gold
stocks following the retracement rally that will most likely occur over
the next few weeks. It will, however, be important to retain significant
exposure to the gold sector because it is unlikely that a major peak is
already in place (a major peak in the gold sector is only likely to occur
after the Dow makes a major peak of its own).
If support holds then it might still
be appropriate to scale back on exposure to gold stocks following a
partial retracing of this month's losses. We'll continue to assess
the situation as it develops.
As an aside, it is impossible for us
to provide a 'one size fits all' trading/investment strategy. Instead,
you should use the analyses provided at TSI, as well as the other resources
to which you have access, in ways that fit your own financial situation,
experience and objectives. It might, for example, be appropriate for
someone with 70% of their liquid assets tied up in the gold sector to scale
back on their exposure in anticipation of short-term price weakness while
someone with only a 15% exposure might be better served by just sitting
tight and using any weakness as a buying opportunity. Furthermore, whereas
it might be appropriate for a short-term trader to exit a position in response
to technical weakness it makes no sense for a long-term investor who has
purchased a stock based on a careful consideration of the stock's value
to exit simply because the price drops. In other words, it is very important
to know yourself. Are you a short-term trader, or a long-term investor,
or a long-term investor with a few short-term positions? What is your financial
and emotional tolerance for losses? What is your level of confidence in
the stocks you own and your outlook for the markets?
Of course, many people consider themselves
to be long-term holders until price starts to drop sharply, then they start
agonising over the daily fluctuations in the prices of their stocks and
start wondering whether they should sell before more of their net-worth
evaporates. These doubts emerge because they are over-exposed relative
to their tolerance for risk and/or because they aren't really confident
that they have done the right thing in the first place. It is easy to be
confident when you are running with the herd, but in order to 'stay the
course' when the herd momentarily stampedes in the opposite direction requires
both knowledge that the herd is wrong and genuine confidence in the veracity
of that knowledge.
Silver and Silver Stocks
Our short-term target for silver is
$5.80, a level that corresponds to major resistance (refer to the below
monthly chart of silver futures). For all intents and purposes, silver
has reached this target.
Normally, the first one or two attempts
to surmount a major resistance level will be unsuccessful so we should
expect that silver will soon commence a pullback. We don't have any specific
targets in mind for this pullback although we would be surprised if silver
moved back below 5.20.
The performance of silver stocks over
the past few weeks supports the idea that the silver price is not going
to move considerably higher in the short-term. To be specific, silver stocks
have been falling over the past three weeks while the silver price has
made new highs for the year. This is a bearish divergence because the stocks
have been leading the metal.
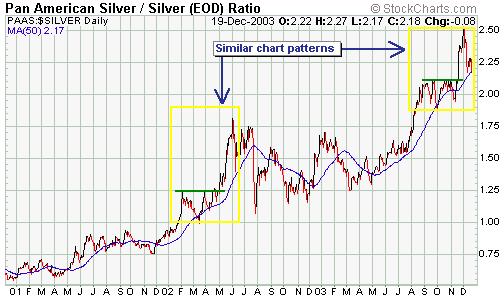
The below chart of the ratio of the
Pan American Silver (NASDAQ: PAAS) stock price and the silver price is
interesting in that the chart pattern over the past 5 months is quite similar
to the chart pattern that occurred during February-June of 2002. A continuation
of this pattern would result in a strong rally in the PAAS/silver ratio
over the next few weeks to a lower high, followed by a plunge.
By the way, while there's a reasonable
chance that we'll see new highs in the gold and silver stocks within the
next few months in US$ terms it is probable that these stocks have seen
their best levels relative to the metals. In other words, for the major
gold and silver stocks to exceed their recent highs during the first half
of next year it will probably be necessary for gold to move well above
$420 and for silver to move well above $5.80.
The South African Gold Stocks
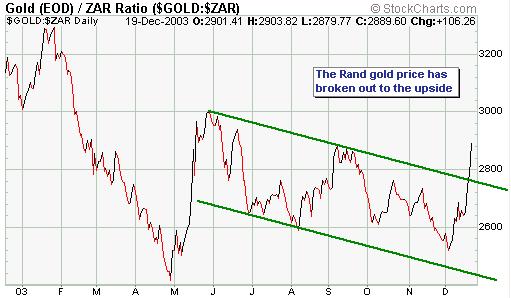
The Rand gold price has broken out
to the upside and is probably headed up to 3100 (or thereabouts) over the
coming months.
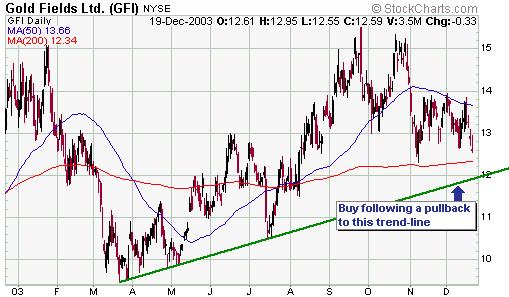
In the 8th December Weekly Update we
said that the next big move in the Rand gold price would probably be to
the upside and that we would consider adding another SA gold stock to the
Stocks List following a general pullback in the gold sector. In this regard
we think Gold Fields Ltd (NYSE: GFI) would be a reasonable buy, for a trade,
if it dropped back to near the trend-line shown on the below chart.
We continue to like Afrikander Lease
(OTC: AFKDY) at around US$0.45. Interestingly, the operation that Aflease
recently said would be closed due to the low Rand gold price would probably
be cash-flow positive at the current Rand gold price.
A rally in the Rand gold price is obviously
beneficial to the SA gold miners and should result in the major SA gold
stocks out-performing their North American counterparts over the next few
months. However, whether this means they will go up more or just go down
less will be determined by the overall trend in the gold sector.
Current Market Situation
The Swiss Franc moved up to the top
end of its 78-80 major resistance range last week while the euro moved
slightly above equivalent resistance. At the same time, gold moved up to
the middle of the 410-420 resistance range that has been our focus for
several months and the Dollar Index hit important trend-line support. We
have therefore reached a point where a Dollar rebound is highly probable.
The only thing we haven't seen, as yet, is any significant sign of strength
in the US$ to indicate that a short-term bottom is already in place. As
such, it is still possible that we'll get a final downward spike in the
Dollar before a counter-trend move gets underway.
As previously discussed, if a US$ rally
began from around the current level it would probably last for only 1-2
months.
Gold could drop all the way back to
around 375 in the short-term without doing any significant technical damage,
although we doubt that it will go that low. It is more likely that any
pullback would hold in the 390s. It is also possible that gold and gold
stocks have already discounted a 1-2 month US$ rebound (remember that gold
leads the dollar and gold stocks lead gold).
Update
on Stock Selections
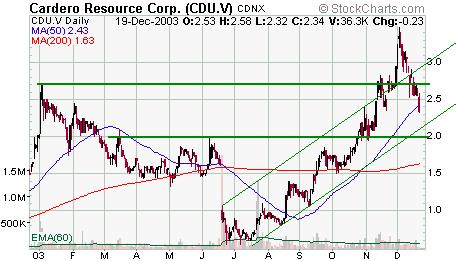
 Cardero
Resource (TSXV: CDU) has broken below support at C$2.70 and is closing
in on support at C$2.00. If we've drawn the channel correctly on the below
chart there is also some trend-line support at around C$2.15. This stock
has a lot of potential and would be a reasonable one to accumulate, for
those who can tolerate high volatility, if it became available in the low-$2
area. Cardero
Resource (TSXV: CDU) has broken below support at C$2.70 and is closing
in on support at C$2.00. If we've drawn the channel correctly on the below
chart there is also some trend-line support at around C$2.15. This stock
has a lot of potential and would be a reasonable one to accumulate, for
those who can tolerate high volatility, if it became available in the low-$2
area.
Because
the stock market is so extended there might not be much of a "January effect"
this year (the "January effect" refers to the stock market strength that
often occurs in the US after year-end tax-related selling is complete).
However, we will mention some stocks that could see good moves if the market
is able to continue along its upward path for several more weeks.
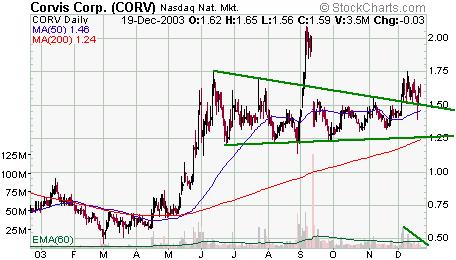
Two stocks that appear to have good
potential from both fundamental and technical standpoints are Corvis Corp.
(NASDAQ: CORV) and Lynx Therapeutics (NASDAQ: LYNX).
CORV was originally a manufacturer
of optical communications equipment for the telecom industry, but virtually
all of its revenue is now generated by its Broadwing subsidiary (Broadwing
is a telecom service provider that owns the only fully-optical telecom
network in the US). CORV currently has a market cap of US$780M, no debt,
and about US$300M in cash, giving it an enterprise value (EV) of $480M.
It is currently generating revenue at the annual rate of around $573M and
is therefore trading at an EV/sales ratio of only 0.84. This is low if
the company is able to become profitable within the next two years. We
think it will become profitable, but in any case we would be buying it
now as a trade, not a long-term investment.
Technically, we've seen a breakout
followed by a low-volume pullback to 'test' the breakout.
LYNX provides genomic analysis solutions
to companies in the pharmaceutical, biotechnology and agricultural industries
using proprietary cloning and gene-sequencing technologies. Its customers
include DuPont, Pfizer, Millennium Pharmaceuticals, National Institute
on Aging, Genome Institute of Singapore and University of Delaware.
LYNX has a market cap of around US$25m,
net cash of around $6.4M, and is trading at an EV/sales ratio of approximately
1. What we find particularly interesting about this company is that its
sales were up by 53% over the first 9 months of this year (versus the same
period last year).
LYNX would be a reasonable buy following
a pullback to the trend-line shown on the below chart.
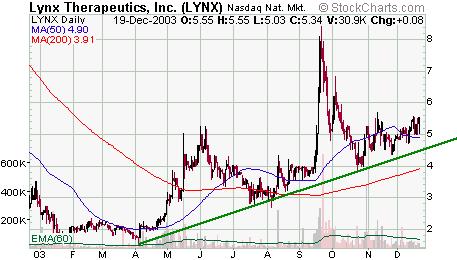
We will add CORV and LYNX to the TSI
Stocks List if they trade down to US$1.55 and US$4.80, respectively (if
they don't trade at those prices within the next two weeks then they won't
be added to the List).
Exeter
Resource (TSXV: XRC) is close to completing its C$4M financing (increased
from the original $3.6M due to strong demand) and has pulled back to around
C$1.00, a level at which we think it is a low-risk buy (at least, as low-risk
as a small gold exploration stock can be).
Chart Sources
Charts appearing in today's commentary
are courtesy of:
http://stockcharts.com/index.html
http://www.futuresource.com/
http://www.economagic.com/

|
