|
-- Weekly Market Update for the Week Commencing 22nd December 2014
Big Picture
View
Here is a summary of our big picture
view of the markets. Note that our short-term views may differ from our
big picture view.
In nominal dollar terms, the BULL market in US Treasury Bonds
that began in the early 1980s ended in 2012. In real (gold)
terms, bonds commenced a secular BEAR market in 2001 that will continue
until 2018-2020. (Last
update: 20 January 2014)
The stock market, as represented by the S&P500 Index,
commenced
a secular BEAR market during the first quarter of 2000, where "secular
bear market" is defined as a long-term downward trend in valuations
(P/E ratios, etc.) and gold-denominated prices. This secular trend will bottom sometime between 2014 and 2020.
(Last update: 22 October 2007)
A secular BEAR market in the Dollar
began during the final quarter of 2000 and ended in July of 2008. This
secular bear market will be followed by a multi-year period of range
trading.
(Last
update: 09 February 2009)
Gold commenced a
secular bull market relative to all fiat currencies, the CRB Index,
bonds and most stock market indices during 1999-2001.
This secular trend will peak sometime between 2014 and 2020.
(Last update: 22 October 2007)
Commodities,
as represented by the Continuous Commodity Index (CCI), commenced a
secular BULL market in 2001 in nominal dollar terms. The first major
upward leg in this bull market ended during the first half of 2008, but
a long-term peak won't occur until 2014-2020. In real (gold) terms,
commodities commenced a secular BEAR market in 2001 that will continue
until 2014-2020.
(Last
update: 09 February 2009)
Copyright
Reminder
The commentaries that appear at TSI
may not be distributed, in full or in part, without our written permission.
In particular, please note that the posting of extracts from TSI commentaries
at other web sites or providing links to TSI commentaries at other web
sites (for example, at discussion boards) without our written permission
is prohibited.
We reserve the right to immediately
terminate the subscription of any TSI subscriber who distributes the TSI
commentaries without our written permission.
Outlook Summary
Market
|
Short-Term
(1-3 month)
|
Intermediate-Term
(6-18 month)
|
Long-Term
(2-5 Year)
|
|
Gold
|
N/A |
Bullish
(26-Mar-12) |
Bullish
|
|
US$ (Dollar Index)
|
N/A |
Neutral
(29-Sep-14) |
Neutral
(19-Sep-07) |
|
US Treasury Bonds (TLT)
|
N/A |
Neutral
(18-Jan-12)
|
Bearish |
|
Stock Market
(DJW)
|
N/A |
Bearish
(28-Nov-11) |
Bearish
|
|
Gold Stocks
(HUI)
|
N/A |
Bullish
(23-Jun-10) |
Bullish
|
|
Oil |
N/A |
Bullish
(17-Dec-14) |
Bullish
|
|
Industrial Metals
(GYX)
|
N/A |
Neutral
(15-Sep-14) |
Bullish
(28-Apr-14) |
Notes:
1. Our short-term expectations are discussed in the commentaries, but except in
special circumstances we won't attempt to assign a "bullish", "bearish" or
"neutral" label to these expectations.
2. The date shown below the current outlook is when the most recent outlook change occurred.
3. "Neutral" means that we think risk and reward are roughly in balance with respect to the timeframe in question.
4. Long-term views are determined almost completely by fundamentals and intermediate-term views
are determined by a combination of fundamentals, sentiment and technicals.
Schedule reminder
and best wishes
As advised in the last Interim Update, we are taking a break and
therefore won't be publishing any regular commentaries until the
Interim Update scheduled for 8th January. As also advised, during
the intervening period there will be one or two brief updates via
email and there will probably be a couple of posts at the
TSI Blog.
By the way, less than one-third of TSI subscribers have signed up to
receive email notification whenever there's a new blog post. This is
fine, but if you are interested in the blog posts and don't want to
waste time checking the site to see if anything has changed then it
makes sense to submit your email address via the box at the right
hand side of the page at
http://tsi-blog.com/.
Our very best wishes for Hannukah, the Northern Hemisphere Winter
Solstice, the Southern Hemisphere Summer Solstice, Christmas, and
(according to the Gregorian calendar) the start of a new year! Real
Performance
Rapid economic growth is never the primary driver
of the long-term bull markets in commodities that are often referred to as
"commodity supercycles". There is actually no such thing as a "commodity
supercycle". Instead, there are periods when commodity prices are among the main
beneficiaries of inflation, where inflation is defined as an expansion of the
money supply. One of the consequences of inflation is a reduction in the value
of money relative to some of the things that money can buy, with different
goods, services and assets benefiting to different extents at different times.
Another and more important consequence of inflation is the slowing of economic
progress (the rate of improvement in the general standard of living) that stems
from the distortion of the relative price signals upon which markets rely.
Due to the effects of inflation on nominal prices, to determine which assets are
'really' in long-term bull markets we must first adjust nominal prices in a way
that accounts for the inflation. As advised in many previous commentaries, we
use a method of adjusting for the effects of US$ inflation that was first
described in a
2010
article. This method isn't reliable over periods of two years or less, but
it should come close to reflecting reality over the long term.
Using this method, here are monthly charts showing the inflation-adjusted (IA)
performances of some important commodities and indices. In these charts the last
point is the closing price on 18th December, with all historical prices being
shown in current dollar terms.
1) Gold
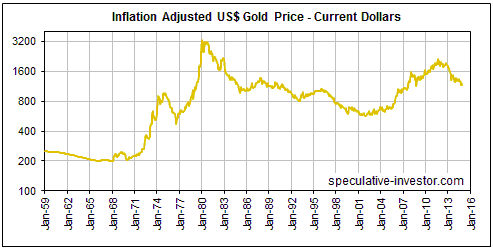
The performance of IA Gold during 2001-2014 looks like an elongated version of
its performance during 1971-1976. As previously explained, this makes sense on
the basis that gold's official link to the US$ prior to 1971 caused the
compression of what would have been a much longer cycle.
One of the most interesting aspects of the long-term chart of IA Gold is that it
suggests a multi-generational upward trend in real terms. This is very
significant, given that commodity prices, in general, still appear to be in
ultra-long-term downward trends. Moreover, it is exactly what would be expected
if, as is our firm belief, the increasingly frequent and aggressive
interventions of the Fed since its ability to meddle was unshackled from gold
are generally leading to greater uncertainty and slowing the long-term rate of
real economic growth. The less productive the economy becomes and the more
uncertain the future seems, the greater will be the demand for safe havens.
2) Silver
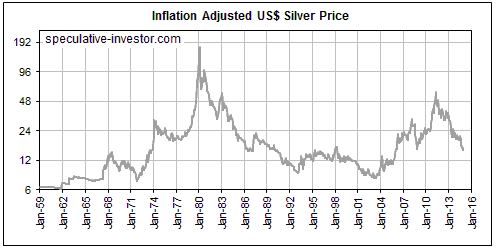
Unlike the IA gold price, the IA silver price shows no signs of being in a
multi-generational upward trend. However, it now looks cheap (it's back to 1973
levels) and poised to outperform gold over the coming three years.
3) Oil
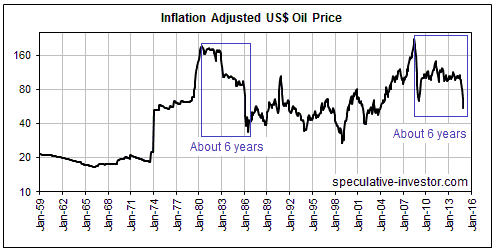
The IA oil price has essentially oscillated within a wide horizontal range since
the 1973-1974 surge.
Interestingly, in IA terms the 1980 and 2008 tops were roughly the same. Also,
the decline in the IA oil price from its 2008 top to its recent bottom now looks
similar to the decline in the IA oil price from its 1980 top to its 1986 bottom,
although to match its 1986 bottom in IA terms the nominal oil price will have to
drop to the high-$30s over the next few months.
We think that the high-$30s defines oil's maximum downside potential. We can
envisage a scenario under which it would drop that far, but it's a
low-probability scenario involving a major deflation scare. A far more likely
scenario involves the oil price bottoming at around $50 during the first half of
next year.
4) Copper
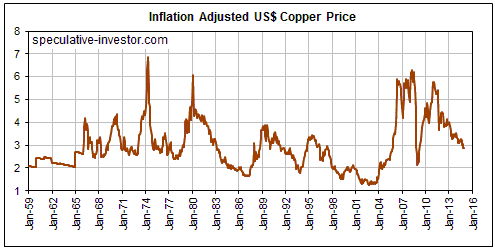
Over the past 60 years the IA copper price has oscillated within a very wide
range. The range appears to have a slight downward bias, in that the 2008 peak
was a little lower than the 1974 peak and the 2002 low was below the mid-1980s
low, which, in turn, was below the mid-1960s low.
In IA terms that current copper price is close to the long-term average, but
previous cyclical bear markets haven't ended until after IA Copper moved well
below its long-term average. Unlike oil and silver and the grains and many other
commodities, which have already collapsed to levels where the remaining downside
risk is low, a collapse in copper could still lie ahead.
5) Platinum
The IA platinum price's 2008 peak was below its 1980 peak, but it has made
progressively higher lows over the past 60 years. This means that, like gold,
there is some evidence that platinum is in a multi-generational upward trend in
IA terms. If this is the case it is because at those times when the industrial
demand for platinum is weak, the platinum price gets supported by
safe-haven-related strength in the gold price.

6) Continuous Commodity Index (CCI)
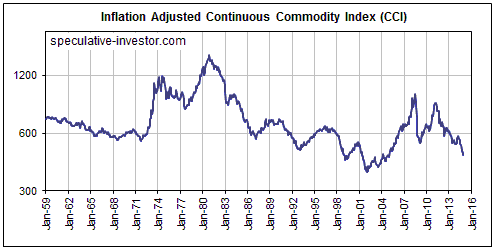
As noted in the above discussion of the IA gold price, commodity prices, in
general, still appear to be in ultra-long-term downward trends. This is
evidenced by the following chart of the IA CCI. Notice that the IA CCI's 2008
peak was a long way below its 1980 peak and that the IA CCI's 2001 bottom was a
long way below its 1971 bottom. While this implies that the CCI will eventually
make a new all-time low in real terms, it doesn't imply that commodity prices
have much further to fall between now and the start of their next multi-year
advance.
Commodity prices are generally now very cheap in real terms. In fact, apart from
2001-2003, they have never been cheaper. This means that they are positioned to
be among the main beneficiaries of future monetary inflation.
7) The Dow Industrials Index
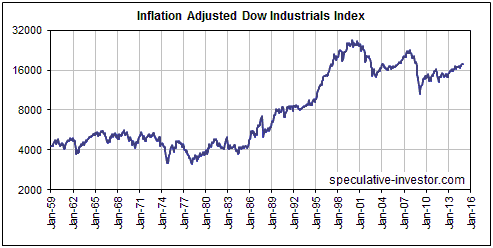
The main reason we believe that the US stock market remains in the secular bear
market that commenced in 2000 is that the average valuation at the 2009 bottom
was nowhere near as low as it was at previous secular bottoms. The following
chart of the IA Dow is consistent with this belief, because it shows that in
real terms the Dow has been making lower lows and lower highs since 2000.
 The Stock
Market
Long-Term Sell Signal
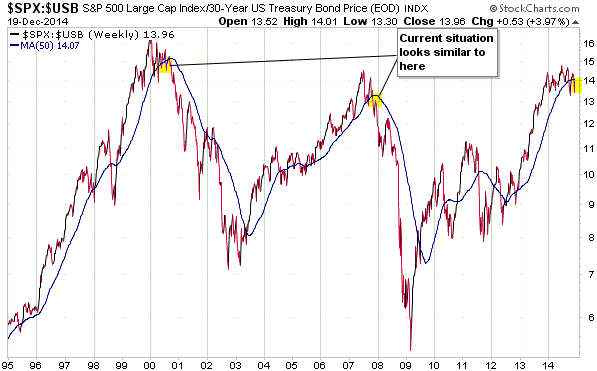
Two months ago we pointed out that the SPX/USB ratio (the S&P500 Index divided
by the price of the 30-year T-Bond) had signaled a major top by doing what it
did at the major tops of 1999-2000 and 2007: rising above 14 and then breaking
below its 50-week moving average. Nothing has since happened to negate the
signal.
The signal would be negated by a rise in the ratio to above its mid-2014 peak,
while a decline by the ratio to below its October low would be additional
evidence of a major top.
Current Market Situation
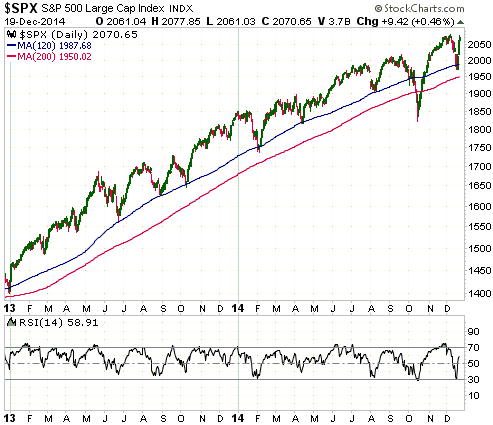
As it had done on seven previous occasions over the past two years, the SPX
pulled back to its 120-day MA (the blue line on the following chart) over the
past two weeks and then quickly moved back to the vicinity of its 12-month (and
all-time) high. Only in October of 2014 did a pullback extend beyond the 120-day
MA.
Many bearish divergences continue to point to a far more substantial decline,
chief among them being the divergence between credit spreads, which have been in
a widening trend since the middle of this year, and the SPX. Under normal
circumstances credit spreads contract when the SPX is trending upward.
Considering the seasonal tail-wind it isn't surprising that there wasn't any
significant follow-through to the downside last week. However, we doubt that the
seasonal tail-wind is capable of generating much additional upward progress.
Our best guess is that there will be choppy price action over the next 2 weeks,
with a marginal new high during the week ahead and then another marginal new
high in early January followed by a decline of greater magnitude than any of the
declines that occurred over the past two years. The most likely alternative is
that the aforementioned decline of greater magnitude gets underway during the
coming week.
This week's
significant US economic events
(The most important events are shown
in bold)
| Date |
Description |
| Monday Dec 22 |
Existing Home Sales | | Tuesday
Dec 23 |
Durable Goods Orders
Q3 GDP (revised)
Personal Income and Spending
New Home Sales
Consumer Sentiment | | Wednesday
Dec 24 |
No important events scheduled | | Thursday
Dec 25 |
Markets closed for Xmas
|
| Friday Dec 26 |
No important events scheduled |
Gold and
the Dollar
Gold
Fundamentals
At this time gold's fundamental drivers could either be described as mixed or
slightly bearish, depending on how much weight is placed on each driver. We
think that 'mixed' is the most appropriate term.
With the Dollar Index having made another multi-year high last week, the US
dollar's exchange rate is clearly in gold-bearish territory. However, the US
dollar's exchange rate is just one of several fundamental drivers of the US$
gold price. Of the other drivers, the real US interest rate, the US yield-spread
(or yield curve) and the average US credit spread are three of the most
important.
Inflation expectations are important for gold, but only to the extent that they
affect real interest rates (the real interest rate being the nominal interest
rate minus the EXPECTED rate of currency depreciation). The real interest rate
is bullish for gold if it is trending lower and bearish for gold if it is
trending higher.
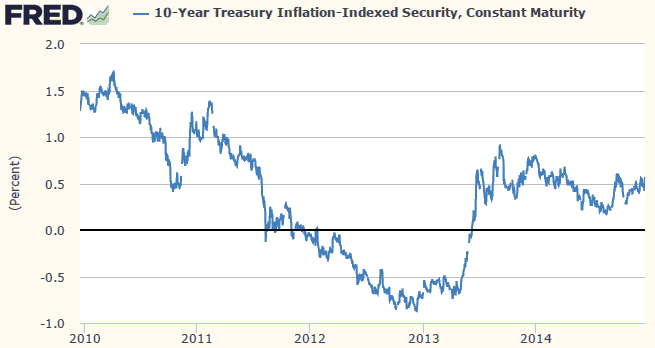
As illustrated by the following chart, the 10-year TIPS yield, an indicator of
the real US 10-year interest rate, trended upward from late-2012 until mid-2013
and was therefore gold-bearish during this period. It then began to work its way
downward and made a multi-month bottom in early-August of this year. During this
period (mid-2013 through to early-August of this year) it was therefore
gold-bullish. In early-August it stopped being a supportive influence on the
gold price, but the overall downward trend that began in mid-2013 could still be
intact. We therefore currently rate the real interest rate as neutral for gold.
The biggest fundamental negative for gold right now isn't the upward trend in
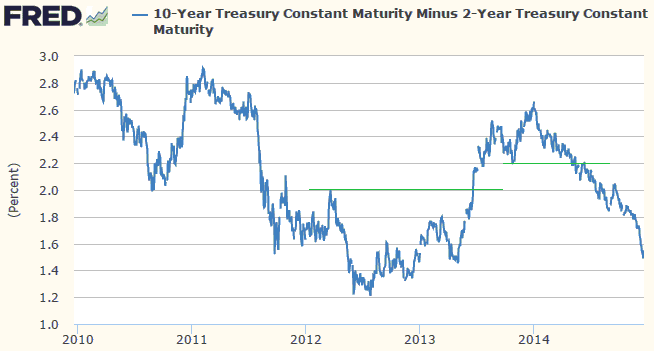
the Dollar Index, it's the downward trend in the US yield-spread (the flattening
of the US yield curve). The following chart shows our preferred indicator of the
US yield-spread (the 10-year T-Note yield minus the 2-year T-Note yield).
The yield-spread started to turn gold-bearish at the beginning of 2014 and
turned definitively bearish in May. From May until early-August its effect on
the gold market was offset by the decline in the real interest rate, but once
the real interest rate stopped declining the effect of the contracting
yield-spread was felt.
We expect that the yield-spread will turn higher and start becoming supportive
for gold at around the same time as the US stock market makes an
intermediate-term peak.
The main reason that the gold price has held up quite well over the past few
months despite getting pressured lower by the contracting yield-spread and the
rallying Dollar Index is illustrated by the following chart. The chart shows
that there has been a very significant widening of US credit spreads over the
past 6 months. The trend in credit spreads is gold-bullish and incongruous with
the persistent upward trend in the S&P500 Index.

Price Action
The gold price pulled back sharply on Monday of last week, but there was no
follow-through to the downside. Instead, the price chopped back and forth around
a horizontal line during the rest of the week.
The 20-day and 50-day MAs are at $1202-$1203, so a daily close above $1203 would
be the first sign that the recent consolidation is over.
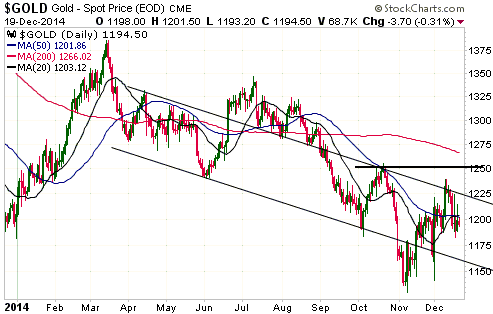
With regard to gold's short-term prospects, the most important resistance lies
at $1240-$1250. Our view has been that this resistance would probably cap gold's
upside during December and be breached during January. That's still the case.
Gold Stocks
Current Market Situation
For a change, today we'll review a couple of XAU charts.
Like the HUI, at the close of trading on Tuesday 16th December the XAU had
fallen for five days in a row and was near its early-November crash low.
Wednesday's rise then suggested that a successful test of the crash low had been
completed. Another rise on Thursday provided additional evidence that a
successful test had occurred and that an intermediate-term rally had begun. A
third consecutive up-day on Friday would have virtually 'sealed the deal' (left
little room for doubt that the bottom was in), but the following daily chart
shows that the XAU reversed lower from its 20-day MA on Friday and ended the day
with a small loss. This keeps alive the possibility that some additional testing
of the low will precede the start of a meaningful rally.
If a successful test of the early-November crash low did, indeed, occur last
week then there shouldn't be more than one additional down-day prior to a
resumption of the rally.
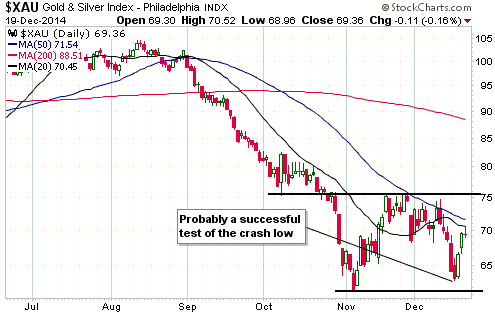
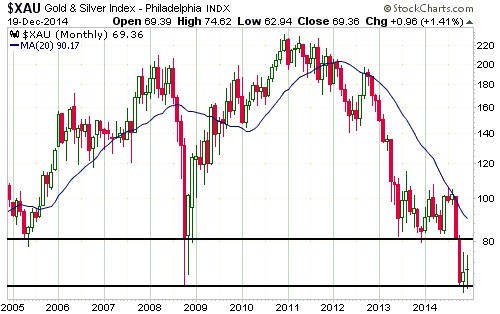
On a daily closing basis the XAU's most important nearby resistance is at 76. A
daily close above this level would leave no room for doubt that the
early-November low had been successfully tested. However, on a longer-term,
monthly-closing basis the most important nearby resistance levels are at 80 and
the 20-month MA.
The following monthly chart shows that 80 was the lowest monthly close during
the 2008 financial crisis and coincides with intermediate-term lows in 2005 and
2013. Also, the chart shows that the 20-month MA acted as intermediate-term
support during 2010-2011 and limited the multi-month counter-trend rebounds of
2012 and 2013-2014.
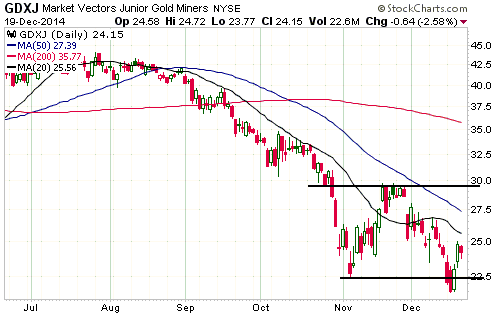
Unlike the HUI and the XAU, GDXJ broke below its early-November crash low during
the first half of last week. However, it quickly reversed upward and negated the
downside breakout. Consequently, GDXJ appears to have also completed a
successful test of its low.
Crazy volumes and price changes due to GDXJ's quarterly rebalancing
Changes to GDXJ components and component weightings took effect at the close of
trading last Friday. Furthermore, whereas GDXJ's buying and selling associated
with the September quarterly balancing happened over the space of a week, it
looks like all trading required to implement the changes associated with the
December quarterly rebalancing took place on a single day (Friday). That's why
there were many big price moves on massive volumes within the ranks of the
junior gold miners last Friday.
Most of GDXJ's existing components were negatively affected by the December
rebalancing. This is because:
1) There were 14 additions and only 6 deletions from GDXJ, meaning that the
total number of GDXJ components increased by 8.
2) 11 of GDXJ's 13 highest-weighted components were not part of this ETF prior
to 19th December.
3) To make way for many additions with relatively high weightings, the
weightings of most of the existing components had to be reduced. In some cases
this required GDXJ to sell tens of millions of shares, almost all of which, it
seems, were dumped onto the market on Friday 19th December.
Of the TSI stocks, the most obvious negative effects of GDXJ's rebalancing were
evident in EDV.TO, GSS, SBB.TO and TGD (TMM.TO). Other stocks on our radar that
were negatively affected include BCM.V, LSG.TO, LYD.TO, MDW, TGZ.TO, and TRX.
PVG was the only TSI stock to be helped by the GDXJ rebalancing, as it was one
of the additions.
Strangely, due to the changes implemented on Friday several of the top holdings
of GDXJ, an ETF that is supposed to be focused on juniors, are now mid-tier
miners. For example, GDXJ's ten largest holdings now include IAMGold (IAG),
Hecla Mining (HL), AuRico Gold (AUQ), Alamos Gold (AGI) and Harmony Gold (HMY).
The Currency Market
During the week just past the Dollar Index invalidated the short-term reversal
signal generated at the end of the preceding week. It did this by closing at a
new high for the move.
As has been the case for all the new highs achieved by the Dollar Index since
early October, the latest one was not confirmed by the daily RSI shown at the
base of the following chart. It was also not confirmed by gold. However, it was
confirmed by the relative strength of the S&P500 Index.
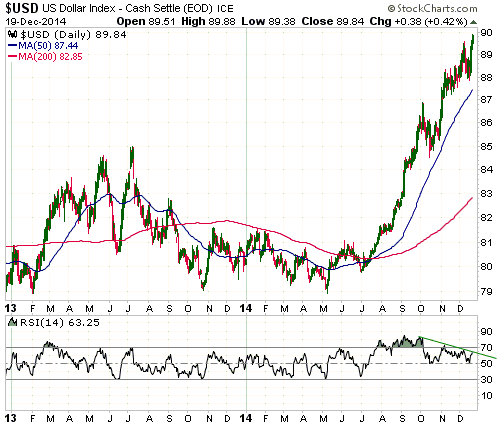
Both the Dollar Index and the S&P500 remain extremely extended to the upside by
multiple measures, although whereas the S&P500 is probably close to a high of at
least intermediate-term importance the Dollar Index is probably only close to a
high that will hold for a few months.
85 remains a reasonable target for the coming downward correction in the Dollar
Index, but as at the end of last Friday a downward correction had not begun.
Updates
on Stock Selections
Notes: 1) To review the complete list of current TSI stock selections, logon at
http://www.speculative-investor.com/new/market_logon.asp
and then click on "Stock Selections" in the menu. When at the Stock
Selections page, click on a stock's symbol to bring-up an archive of
our comments on the stock in question. 2) The Small Stock Watch List is
located at http://www.speculative-investor.com/new/smallstockwatch.html
 Company
news/developments for the week ended Friday 19th December 2014: Company
news/developments for the week ended Friday 19th December 2014:
[Note: AISC = All-In Sustaining Cost, FS = Feasibility Study, IRR = Internal
Rate of Return, MD&A = Management Discussion and Analysis, M&I = Measured and
Indicated, NAV = Net Asset Value, NPV(X%) = Net Present Value using a discount
rate of X%, P&P = Proven and Probable, PEA = Preliminary Economic Assessment,
PFS = Pre-Feasibility Study]
*Almaden Minerals (AAU) announced that it is deferring shareholder
approval of the spinout of its early stage exploration projects and royalty
interests (everything except the Tuligtic project), which was originally
expected to happen in December-2014, to the company's 2015 annual general
meeting in June-2015. This is being done to avoid the expense of an additional
shareholders' meeting and to allow more time for an internal restructuring of
the assets to be spun out.
This schedule change isn't a big deal, but despite the additional expense we
would prefer that the company had gone ahead and held a special shareholders
meeting in December as originally planned. The spinout is important for
shareholders as it will force the stock market to value assets that are
currently being assigned no value as part of AAU.
*Evolution Mining (EVN.AX) advised that it has rolled over its
existing A$200M credit facility into a new, lower-cost revolving credit facility
of the same amount. $127M had been drawn on the previous facility and has now
been drawn on the new facility.
EVN also announced that it has increased its gold hedging by 225K ounces. The
company now has forward sales over the next three years of 347K ounces of gold
at an average price of A$1541/oz. This represents less than 25% of expected gold
production over the period, so EVN retains plenty of exposure to the spot gold
price.
*Timmins Gold (TGD) announced that it has purchased the Caballo
Blanco exploration-stage gold project from Goldgroup Mining (GGA.TO).
When we saw the press-release headline that TGD had purchased Caballo Blanco, we
cringed. The reason is that we are well aware of the permitting obstacles facing
this project. When we read the press release and saw the price tag (US$10M plus
16M TGD shares, or US$25M at TGD's current stock price), we cringed again.
Caballo Blanco is a small (around 1M-oz total resource), low-grade deposit that
could potentially be developed into a profitable, 90K-oz/yr open-pit heap-leach
gold mine at the current gold price IF it were possible to get all the necessary
approvals to construct a mine. And there's the rub, because the project
effectively came to a standstill about two years ago due to Goldgroup's
inability to get the necessary approvals from the relevant authorities.
Furthermore, according to the most recent information from Goldgroup (in the
MD&A published last month), nothing has changed.
It's quite possible that TGD's managers know something about Caballo Blanco's
permitting issues that we don't. We certainly hope that's the case. At this
stage, however, it looks like they've agreed to pay $26M for a liability.
As an aside, Caballo Blanco was originally discovered by Almaden Minerals (AAU)
and Almaden retains a 1.5% NSR royalty on the project. This is one of the assets
that will end up in the AAU spin-out. Therefore, AAU shareholders stand to
benefit if, by some remote chance, TGD is able to build a mine at Caballo
Blanco.
 List of candidates for new buying
From within the ranks of TSI stock selections the best candidates
for new buying at this time, listed in alphabetical order, are:
1) AAU (last Friday's closing price: US$0.96).
2) AKG (last Friday's closing price: US$1.58).
3) EDV.TO (last Friday's closing price: C$0.41).
4) EVN.AX (last Friday's closing price: A$0.57).
5) TGD (last Friday's closing price: US$0.92). (Due to its price and
its profitable current production, TGD has an attractive short-term
risk/reward despite what appears, on the surface, to be a
hare-brained asset purchase by its management.)
Note that the above list is limited to five stocks. It will
sometimes contain less than five, but it will never contain more
than five regardless of how many stocks are attractively priced for
new buying.
 Update on our Japanese pair trade
In the 5th November Interim Update we added a "Japanese pair trade"
to the TSI Stocks List. The 'pair' is a long position in the Yen via
the January-2016 $90 FXY call options and a long position in the
Japanese stock market via January-2016 EWJ (Japan iShares) $12 call
options. These positions, together, create a higher probability of
success than would be obtained by either position alone.
As explained at the time, there is a realistic possibility that we
will make a profit on both of these option positions. However, there
is a much higher probability that only one of them will be
profitable, with the gains on the winner potentially dwarfing the
losses on the loser. The reason is that Yen strength over the coming
6-12 months will likely go with a downward-trending Japanese stock
market and Yen weakness over the coming 6-12 months will likely go
with an upward-trending Japanese stock market.
The basis for the pair trade is illustrated by the following chart.
The chart shows that there has been a strong positive correlation
over the past three years between the Yen and the inverse of the
Nikkei. To put it another way, the chart shows that there has been a
strong inverse relationship between the Yen and the Nikkei.
We continue to like this trade.
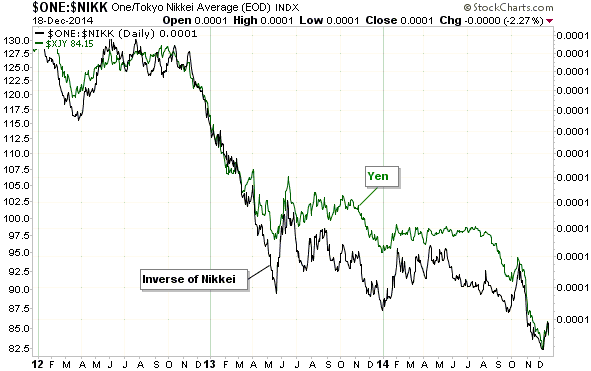
Chart Sources
Charts appearing in today's commentary
are courtesy of:
http://stockcharts.com/index.html
http://research.stlouisfed.org/

|

