|
-- Weekly Market Update for the Week Commencing 23rd February 2004
Big Picture
View (Most recent update: 12 January 2004)
Here is a summary of our big picture
view of the markets. Note that our short-term views may differ from our
big picture view.
Bond yields (long-term interest
rates) bottomed in June of 2003 and will move considerably higher during
2004 and 2005.
The stock market rally that
began in October of 2002 will end during the first half of 2004. The October-2002
bottom will be tested during 2005.
The Dollar will make an intermediate-term
bottom during the first half of 2004 in the vicinity of its 1995 low and
then rally for at least 6 months, but a long-term bottom won't occur until
2008-2010.
Gold will make an intermediate-term
peak during the first half of 2004 and then consolidate for at least 6
months, but a long-term peak won't occur until 2008-2010.
Commodities, as represented
by the CRB Index, will make an intermediate-term peak during the first
half of 2004 and then consolidate for at least 6 months, but a long-term
peak won't occur until 2008-2010.
Copyright
Reminder
The commentaries that appear at TSI
may not be distributed, in full or in part, without our written permission.
In particular, please note that the posting of extracts from TSI commentaries
at other web sites or providing links to TSI commentaries at other web
sites (for example, at discussion boards) without our written permission
is prohibited.
We reserve the right to immediately
terminate the subscription of any TSI subscriber who distributes the TSI
commentaries without our written permission.
Overview
During those periods when we perceive
that one or more of the major markets are approaching, or working through,
significant trend changes, we tend to get a little edgy. We are therefore
more than a little edgy right now because we are expecting important trend
changes to occur in all the markets we follow (the gold, stock, commodity,
currency and bond markets) over the next few months. Specifically, we are
anticipating intermediate-term peaks in the gold, stock and bond markets
as well as in the prices of the industrial metals, and an intermediate-term
bottom for the US$. The main effect of this edginess, by the way, is to
make us pay more attention than usual to signs of technical strength and
weakness.
There is presently some evidence that
the aforementioned trend changes are already in progress. For example,
Friday's close by the Dollar Index above its 50-day moving average is potentially
a sign that a bottom for the US$ is already in place. This, in turn, would
suggest that an intermediate-term peak was put in place for the AMEX Gold
BUGS Index (HUI) at the beginning of December (a possibility we've broached
at TSI several times over the past 10 weeks) and that an important peak
in the gold market was put in place in early January when the gold price
spiked up to $430 (not a possibility we've seriously considered until now).
Also, the recent weakness in the NDX/Dow ratio is potentially a sign that
a peak for the US stock market is already in place.
However, while we must remain open
to the possibility that important extremes are already in place for gold,
the stock market and the US$, this is not our favoured scenario. There
are a few reasons for this, the most significant two of which are:
1. Gold and gold stocks are not currently
behaving as if a major peak in the stock market had just been put in place.
In particular, we expect gold stocks to be strong during the weeks immediately
following a major peak in the Dow as money rotates away from those sectors
that are perceived to be more risky towards those sectors that are perceived
to offer greater safety. They are, however, behaving as if the stock and
currency markets were experiencing routine corrections to their on-going
trends (similar to what happened during June-August of last year).
2. It would be very strange if the
US$ reversed higher without the Fed having made any effort to stem the
tide and at the first whiff of intervention by the ECB. On the contrary,
as long as fundamentals strongly favour a further weakening of the US$
an intermediate-term bottom for the dollar will, we think, require concerted
intervention by the ECB over the space of a few months. The markets could,
of course, begin to discount a change in the fundamentals long before that
change becomes apparent, and this is why we can't afford to ignore signs
of US$ strength at the present time. However, with US bond prices near
a 6-month high and the Fed still talking about "policy accommodation" we
doubt that the markets have already begun to discount a significant reduction
in the spread between euro and US$ interest rates (the main fundamental
driver of US$ weakness versus the euro in the intermediate-term).
The most likely explanation for the
current action, in our opinion, is that the corrections that began in the
stock, gold and currency markets at various times over the past 2 months
are going to continue for at least another month; meaning that the cycle
that began in March-2003 would extend for 1-2 months longer than we have
previously forecast. For instance, rather than a major peak occurring in
the stock market during March-April (our previous expectation) we might
get a correction LOW in March followed by a rally to a new recovery high
during April-May, thus pushing out the most likely time for a peak in the
gold sector to May-June.
Long-term investors (those with time
horizons measured in years, not months) who are emotionally and financially
prepared to ride-out the intermediate-term swings in the markets should
find the above discussion to be of academic interest only because the longer-term
trends (for example, up for gold and down for the dollar) have years to
run. Those with 3-12 month time horizons might, however, need to take into
account the lower-probability outcome discussed above (the possibility
that extremes are already in place for gold, stocks and the dollar); although
anyone who has employed our approach of scaling into stocks when the risk/reward
looks favourable and scaling out when it appears unfavourable should not
be in a position where they feel compelled to take much action at the present
time. For example, as far as the gold sector is concerned we emphasised
the downside risk during January when the HUI was trading in the 240s and
250s and this was the time that anyone who felt over-exposed to a sharp
correction in the gold stocks should have been taking some money off the
table; not now after the downside risk has been substantially reduced via
the corrective activity of the past 2.5 months.
The Stock
Market
The golds versus the chips
Below is a chart comparison of the
AMEX Gold BUGS Index (HUI) and the Philadelphia Semiconductor Index (SOX).
The chart shows that the HUI and the SOX have trended higher since March
of 2003 with pullbacks for each tending to end near their 50-day moving
averages.
The HUI and the SOX peaked at the beginning
of December and then pulled back. They both bottomed in mid December and
then rallied into early January, but while the SOX made a new high at this
time the HUI just tested its December peak. They both then pulled back
into early February with the SOX, once again, demonstrating some relative
strength (the SOX made a higher low while the HUI dropped below its December
low). We then saw concurrent rebounds during the first half of February
and then a pullback in both indices over the past week.
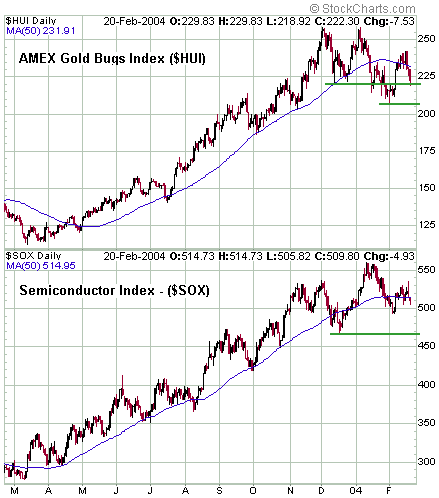
Since March of last year there has
been an uninterrupted sequence of higher highs and higher lows in the SOX,
so a drop by this index to below its December low would be a significant
change of character for the market. Having already broken its sequence
of higher highs and higher lows the HUI looks more bearish, although this
could just mean that a correction low is already in place for the HUI whereas
the SOX has a lot more work to do on the downside. In any case, the SOX
and the HUI are clearly moving together so it wouldn't, for example, make
sense to be wildly bullish on the gold sector if you thought the chip sector
was about to crash.
Current Market Situation
Our view is that the correction that
began in January is still underway. Furthermore, it appears as though this
correction is going to continue for at least a few more weeks.
From a slightly longer-term perspective,
we expect the Dow and the S&P500 to make new recovery highs following
the current correction. However, there's a reasonable chance that a major
peak is already in place for the NASDAQ100 Index. This view (that the NDX
has already peaked) would be given a boost if the NDX were able to end
this week below its January low of 1458.
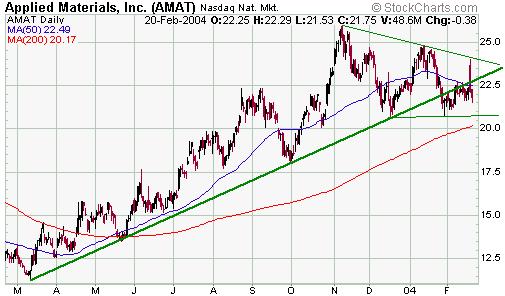
We are now going to take a look at
two stock-charts that are quite interesting at the current time; the first
being a one-year daily chart of Applied Materials (NASDAQ: AMAT), the world's
largest semiconductor equipment manufacturer.
AMAT breached trend-line support in
late January and then rebounded whilst remaining below its former upward
trend-line. Then, after the close of trading last Wednesday the company
reported what were widely described in the media as "blow-out sales and
profit numbers" for its most recent quarter, causing the stock to spike
sharply higher at the start of trading on Thursday. However, the blow-out
numbers had clearly already been factored into the stock price because
the upward spike on Thursday morning prompted a deluge of selling and by
the end of the day the stock was actually lower than it had been prior
to the announcement of the good news. It then dropped again on Friday.
Key support for AMAT is at the December
and January lows. A daily close below this support ($20.50) would be the
second sign that a major peak was in place for AMAT (the first sign was
January's breach of trend-line support).
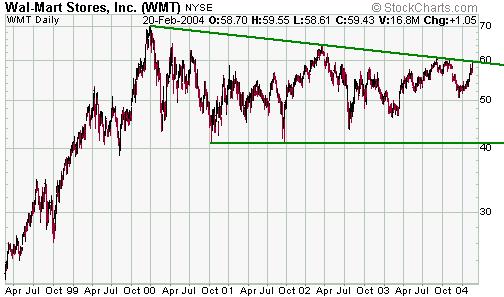
We mentioned, in a previous commentary,
that the long-term chart of Walmart (NYSE: WMT) -- the world's largest
company in terms of annual revenue and number of employees -- looked bullish.
Specifically, the action of the past few years looks quite similar to the
lengthy consolidation that occurred during 1993-1996 and is the type of
pattern that would be expected to eventually resolve to the upside.
As at the end of last week WMT was
positioned right at the top of its 4-year consolidation pattern, so any
significant strength from here would create an upside breakout on the long-term
chart. However, this also means that now is a likely time for a downward
reversal.
This week's
important US economic events
| Date |
Description |
| Monday Feb 23 |
No significant events |
| Tuesday Feb 24 |
Consumer Confidence |
| Wednesday Feb 25 |
Existing Home Sales |
| Thursday Feb 26 |
Durable Goods Orders
New Home Sales |
| Friday Feb 27 |
GDP (Q4 2003) |
 Click
here to read the rest of today's commentary Click
here to read the rest of today's commentary

|
