|
-- Weekly Market Update for the Week Commencing 23rd March 2015
Big Picture
View
Here is a summary of our big picture
view of the markets. Note that our short-term views may differ from our
big picture view.
In nominal dollar terms, the BULL market in US Treasury Bonds
that began in the early 1980s ended in 2012. In real (gold)
terms, bonds commenced a secular BEAR market in 2001 that will continue
until 2018-2020. (Last
update: 20 January 2014)
The stock market, as represented by the S&P500 Index,
commenced
a secular BEAR market during the first quarter of 2000, where "secular
bear market" is defined as a long-term downward trend in valuations
(P/E ratios, etc.) and gold-denominated prices. This secular trend will bottom sometime between 2014 and 2020.
(Last update: 22 October 2007)
A secular BEAR market in the Dollar
began during the final quarter of 2000 and ended in July of 2008. This
secular bear market will be followed by a multi-year period of range
trading.
(Last
update: 09 February 2009)
Gold commenced a
secular bull market relative to all fiat currencies, the CRB Index,
bonds and most stock market indices during 1999-2001.
This secular trend will peak sometime between 2014 and 2020.
(Last update: 22 October 2007)
Commodities,
as represented by the Continuous Commodity Index (CCI), commenced a
secular BULL market in 2001 in nominal dollar terms. The first major
upward leg in this bull market ended during the first half of 2008, but
a long-term peak won't occur until 2014-2020. In real (gold) terms,
commodities commenced a secular BEAR market in 2001 that will continue
until 2014-2020.
(Last
update: 09 February 2009)
Copyright
Reminder
The commentaries that appear at TSI
may not be distributed, in full or in part, without our written permission.
In particular, please note that the posting of extracts from TSI commentaries
at other web sites or providing links to TSI commentaries at other web
sites (for example, at discussion boards) without our written permission
is prohibited.
We reserve the right to immediately
terminate the subscription of any TSI subscriber who distributes the TSI
commentaries without our written permission.
Outlook Summary
Market
|
Short-Term
(1-3 month)
|
Intermediate-Term
(6-18 month)
|
Long-Term
(2-5 Year)
|
|
Gold
|
N/A |
Bullish
(26-Mar-12) |
Bullish
|
|
US$ (Dollar Index)
|
N/A |
Bearish
(26-Jan-15) |
Neutral
(19-Sep-07) |
|
US Treasury Bonds (TLT)
|
N/A |
Neutral
(18-Jan-12)
|
Bearish |
|
Stock Market
(DJW)
|
N/A |
Bearish
(28-Nov-11) |
Bearish
|
|
Gold Stocks
(HUI)
|
N/A |
Bullish
(23-Jun-10) |
Bullish
|
|
Oil |
N/A |
Bullish
(17-Dec-14) |
Bullish
|
|
Industrial Metals
(GYX)
|
N/A |
Neutral
(15-Sep-14) |
Bullish
(28-Apr-14) |
Notes:
1. Our short-term expectations are discussed in the commentaries, but except in
special circumstances we won't attempt to assign a "bullish", "bearish" or
"neutral" label to these expectations.
2. The date shown below the current outlook is when the most recent outlook change occurred.
3. "Neutral" means that we think risk and reward are roughly in balance with respect to the timeframe in question.
4. Long-term views are determined almost completely by fundamentals and intermediate-term views
are determined by a combination of fundamentals, sentiment and technicals.
Last
week's posts at the TSI Blog
Ignore per-ounce valuations for gold deposits
Interesting US oil-production and price-inflation charts
Commodities
The commodity bear market is (probably)
winding to a close
The length and severity of the commodity bear market are such that it is
probably almost over. Here are some examples that illustrate the bear market's
extent:
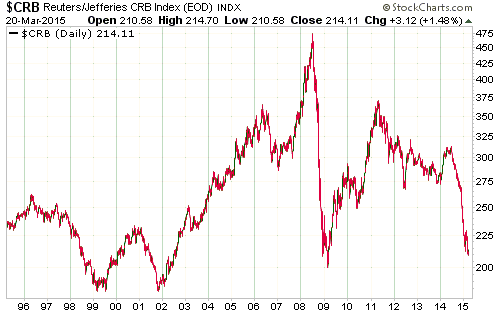
First, the CRB Index at its lowest level since March-2009 and within 5% of a
13-year low. It's also worth noting that although a lot of commodities didn't
peak until 2011, the CRB Index peaked in 2008 and has therefore been in a
bearish trend for almost 7 years.
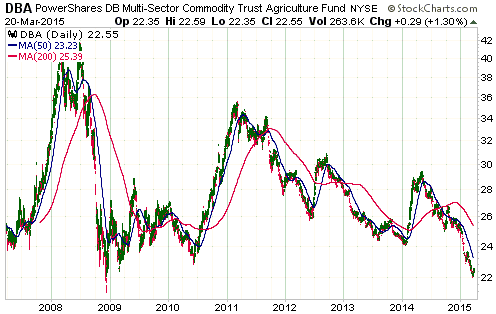
Second, the
PowerShares DB Agriculture Fund (DBA), a proxy for agricultural commodities
such as cattle, cocoa, coffee, hogs and various grains, came within spitting
distance of its 2008 Global Financial Crisis bottom last week.
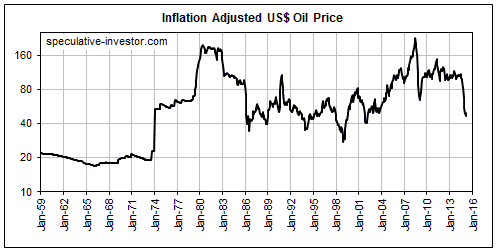
Third, the inflation-adjusted oil price is now within $10 of its 1986 bottom.
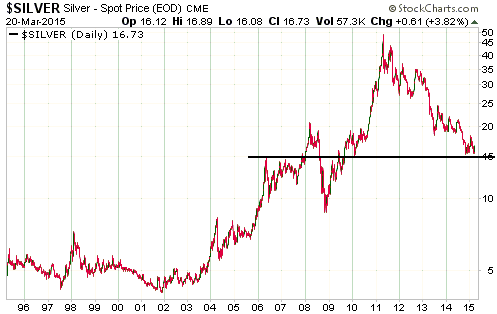
Fourth, silver's bear market is 5 weeks away from being 4 years old, which is
long in the tooth, and has reduced the price by 70%.
Given the across-the-board magnitudes and durations of the declines in commodity
prices and the likelihood that monetary conditions will remain very inflationary
for the foreseeable future (in 2015 there will not be anything resembling
deflation in the US, the euro-zone, Japan, China, or anywhere else we can think
of), there's a good chance that a commodity turnaround will happen this year.
For a clue as to whether the turnaround will happen during the first or the
second half of the year, we shift our attention to gold.
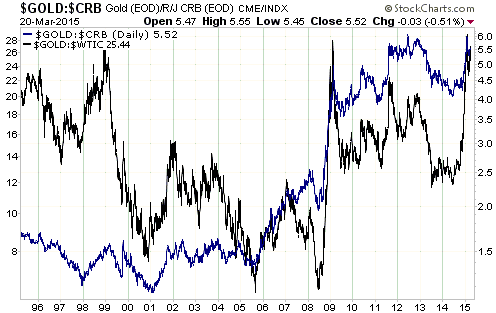
Gold is expensive relative to silver, platinum, oil, agriculture, and
commodities in general. For example, the following chart shows that gold is near
a multi-decade high relative to the CRB Index and oil. Why? Is it being
manipulated upward?
We doubt it. There is manipulation in both directions in every market, but for
gold and any other scarce commodity a long-term price suppression scheme is
impossible and a long-term price elevation scheme is extremely unlikely. It's
far more likely that gold is being supported relative to other commodities
because there are plenty of well-heeled people in the world who are aware of the
eventual consequences of the current monetary experiments. Gold, we suspect, is
being steadily accumulated as insurance.
With regard to commodities in general, a concern we have is that gold's current
fundamentals and recent price action point to the US$ gold price breaking below
last year's low before making a long-term reversal to the upside. Since gold
tends to lead most other commodities at major bottoms, this indicates that a
long-term reversal to the upside for commodities in general (as represented by
the CRB Index) might not happen until the second half of this year.
We'll see. On the question of the commodity-turnaround's exact timing we don't
have any preconceived opinions. It could be that gold remains above last year's
low, which would suggest a first-half bottom for many other commodities
including oil and the industrial metals.
Copper Bottom
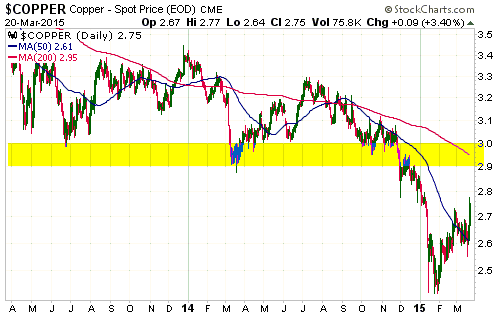
The first of the following charts shows that the copper price moved sharply
higher over the final two days of last week and made a 2-month high on Friday.
Last week's strength was at least partly due to the temporary production halt at
Freeport's huge Grasberg mine in Indonesia. Given that
the mine re-started on Saturday, it's reasonable to assume that some of the
recent price gain will be given back this week.
The $2.90-$3.00 range that acted as support for years will now be formidable
resistance for the copper market. It would take a weekly close above this
resistance to confirm that the copper price made an intermediate-term, rather
than just a short-term, bottom in late-January.
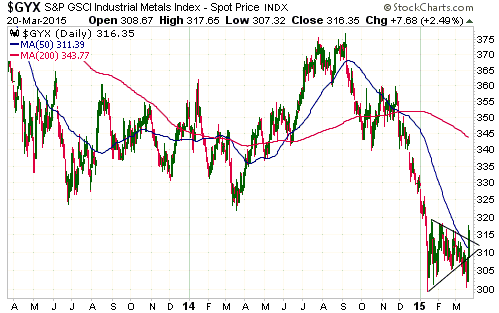
The second of the following charts shows that the Industrial Metals Index (GYX)
also moved sharply higher over the final two days of last week. Although GYX
hasn't been as strong as the copper price over the past 2 months, GYX has the
more bullish chart pattern. The reason is that GYX broke out to the downside and
dropped to its January low before rebounding by enough to negate the breakdown
and indicate that a successful test of the multi-year low had taken place.
Before drawing any conclusions we'll need to see how the copper price and GYX
respond to the news that the Grasberg mine is back on-line.
Trade
gaps and currency exchange rates revisited
We take our publishing deadlines
seriously. As a consequence, there are times when we end up
publishing something that we aren't satisfied with. Occasionally we
read what we've written and realise that we weren't clear enough or
made less sense than we'd hoped, but with the publishing deadline
approaching there isn't time for a re-write. This happened with the
discussion on trade gaps and currency exchange rates in last week's
Interim Update. We tried to make a complex subject simple by staying
away from theory and presenting a numbers-based hypothetical
example. In doing so we succeeded in making the subject more
confusing.
In the hypothetical 'all else remaining equal' example presented in
the Interim Update, we gave some benefit of the doubt to the
devaluation proponents by assuming that a 10% reduction in the
exchange rate would lead to a 10% increase in export VOLUMES and a
10% rise in import COSTS. However, it would more likely result in no
change in trade volumes and a 10% rise in import costs. The reason
is that prior to the exchange-rate change the economy would be
structured to produce certain things and to import certain things.
Devaluing the currency by 10% would not magically realign the
economy such that some of the things that were being imported would
now be produced locally. All it would do is force people to pay more
for the imported things. On the export side the devaluation would
temporarily enable exporters to make more profit in terms of the
devalued currency, but it would not magically change the production
structure on both the domestic front and the international front
such that the exporting industries in the country with the devalued
currency would suddenly be able to sell more things.
That's what could -- and probably would -- happen in the short-term
in response to currency devaluation. By the same token, a likely
short-term result of an upward revaluation of the currency would be
1) a reduction in the total cost of imported goods, 2) no change in
export or import volumes, and 3) lower profits for unhedged
exporters in terms of the upwardly-revalued currency.
This means that exporters would generally be the short-term
beneficiaries of a downward currency revaluation and the rest of the
economy would generally be the short-term beneficiary of an upward
currency revaluation. That's why exporters often lobby hard for
policies designed to reduce the currency's value on the FX market.
In the short-term, these policies effectively siphon money from the
rest of the economy into their pockets.
The long-term results of currency devaluation and revaluation are
more difficult to appreciate, because they can't be understood
without some knowledge of good economic theory. This means that it
is not possible to 'see' the long-term effects of currency changes
through a Keynesian lens.
Over the long-term, neither producers nor consumers can benefit from
currency devaluation. The reason is that a large and sustained
reduction in a currency's value on the FX market requires monetary
policies that a) raise domestic prices by enough to counteract any
benefit that exporters would achieve from currency devaluation, and
b) distort relative prices in a way that makes the economy less
efficient. That's why countries with strong manufacturing sectors
tend to have strong currencies and why countries with weak
manufacturing sectors tend to have weak currencies. It's also why a
weak manufacturing sector cannot be made sustainably strong by
devaluing the currency.
Wrapping up, there's an inter-relationship between the currency,
including the currency's relative value on the FX market, and the
economy, such that the policies that lead to a persistently strong
currency also promote greater efficiency and a stronger economy, and
a stronger economy will tend to result in a stronger currency.
Therefore, as well as often being a reflection of a strong economy,
long-term currency strength is a necessary precondition for
long-term economic strength.
The Stock
Market
An update on the strange bedfellows
As we noted in a post
last month at the TSI Blog, over the past few years every short-term trend
in Japan iShares (EWJ) has been mimicked by London’s FTSE Index. In other words,
there has been a strong positive correlation between the Japanese stock market’s
performance in US$ terms and the UK stock market’s performance in Pound terms.
We don't know why.
Based on the aforementioned relationship, it was reasonable to expect that if
EWJ was able to sustain its February upside breakout then London's FTSE would do
the same. The chart displayed below shows that EWJ clearly did sustain its
breakout and that the FTSE, after making one failed attempt to break out, is now
following suit.
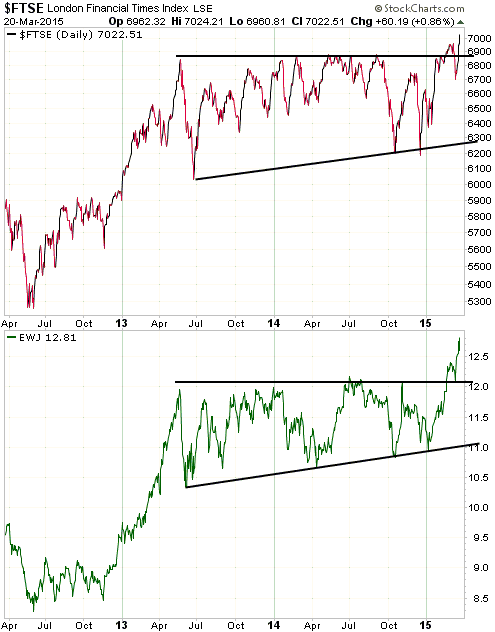
We don't have any opinion about the FTSE, except that its breakout shouldn't be
ignored. Breakouts following long-term consolidations can lead to substantial
moves in the direction of the breakout.
Regarding EWJ, $14-$15 is a plausible 2-3 month target.
For both the FTSE and EWJ, a sizable downturn in the US stock market represents
the biggest potential short-term obstacle. As a result of the downward pull from
a declining US market, one possibility is that EWJ and the FTSE will pull back
to test their breakouts before returning to their upward paths.
We continue to like our Japan pair trade, which involves being long EWJ and long
the Yen. There's a high probability that at least one side of this trade will
work very well and a realistic possibility that both sides will work well. The
EWJ side is working well at the moment, but the Yen side will probably come to
life after the US stock market starts showing clear-cut signs of weakness.
The US
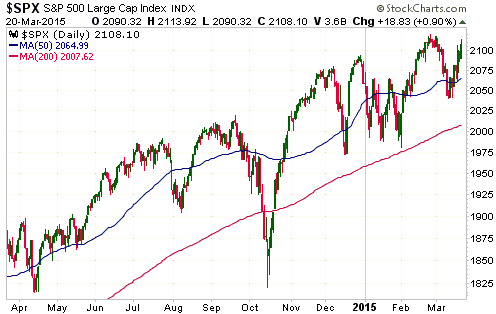
It's possible that the S&P500 Index (SPX) peaked in late-February, suffered an
initial decline, and is now testing its peak prior to suffering a much larger
decline. This is the short-term scenario that we favour, but there are obviously
other possibilities. The good news is that we should find out this week if our
favoured scenario is valid, because this scenario will be rendered invalid
unless the SPX reverses lower within the coming few days without making
significant additional headway. That makes risk management straightforward for
any bearish speculations.
Making the situation even more straightforward is the fact that the NYSE
Composite Index (NYA) has just moved up to resistance defined by multiple highs
over the past 9 months. It would clearly take only a small amount of additional
strength from here to effect a breach of this resistance.
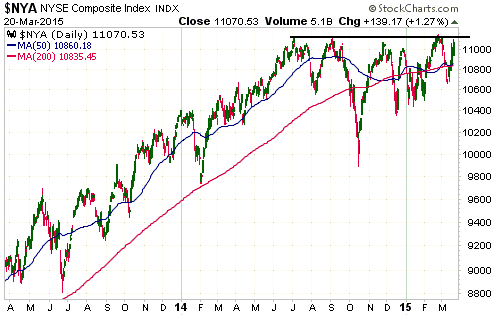
A move to a new high within the coming week wouldn't necessarily mean that
another bull-market leg was underway. It could, instead, be the type of break
above obvious resistance or below obvious support that often occurs near the end
of a major trend. However, traders shouldn't automatically assume that breakouts
in the SPX and the NYA will fail. It would be more prudent to give the benefit
of the doubt to the breakout until subsequent price action created evidence of a
failure.
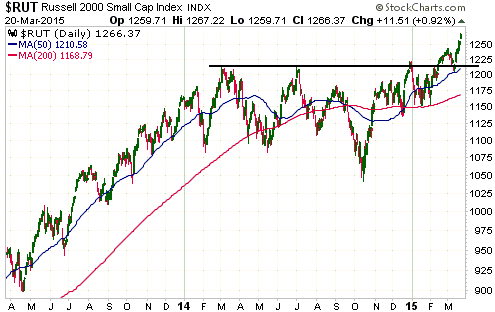
On the positive side of the ledger, the Russell2000 SmallCap Index (RUT), which
was a laggard last year, has definitively broken out to the upside.
Europe
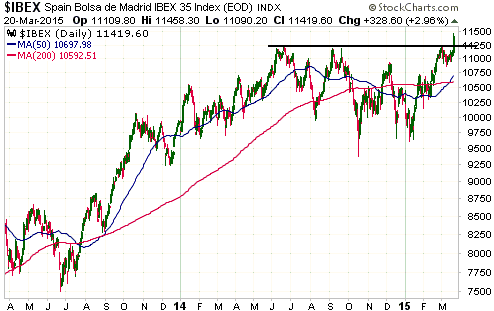
Accelerating monetary inflation in the euro-zone is continuing to levitate the
prices of financial assets in the region. Last week Spain's stock market, which
is represented on the following chart by the IBEX Index, joined the stock
markets of Germany, France and Italy by moving to a new multi-year high.
This week's
significant US economic events
(The most important events are shown
in bold)
| Date |
Description |
| Monday Mar 23 |
Existing Home Sales | | Tuesday
Mar 24 |
CPI
New Home Sales | | Wednesday
Mar 25 |
Durable Goods Orders | | Thursday
Mar 26 |
No important events scheduled
|
| Friday Mar 27 |
Q4-2014 GDP (second revision)
Consumer Sentiment |
Gold and
the Dollar
Gold and Silver
The speculative net-long position in COMEX gold futures reached a 2-year high in
late-January and has since fallen back to near the 12-month low reached last
November. That's not surprising, given that the US$ gold price tested its
November low last week.
At this stage it looks like the test of the low was successful and that a
multi-week rebound has begun, with upside potential to the vicinity of the
200-day MA (currently at $1240).
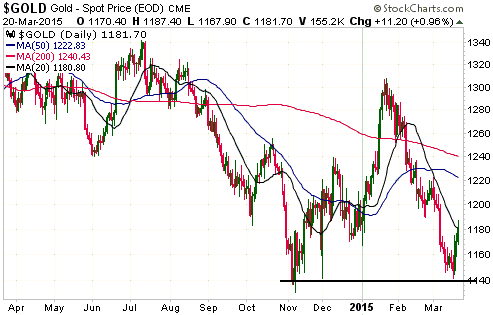
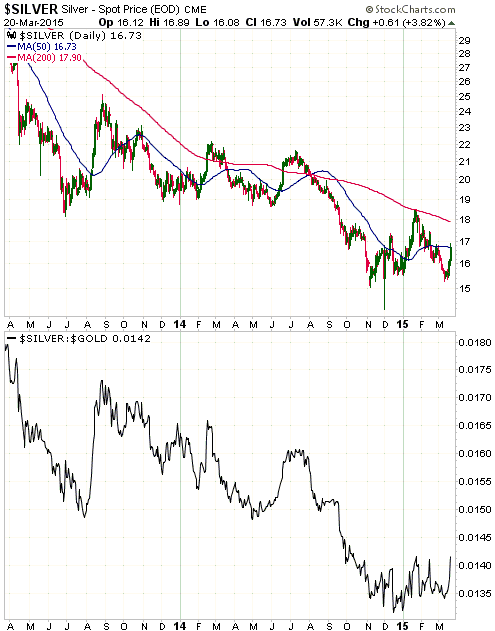
Silver was strong relative to gold last week. Whereas gold only rose to its
20-day MA in the low-$1180s, silver managed to rise to its 50-day MA (equivalent
to a gold price of $1223). This relative strength pushed the silver/gold ratio
up to near its highest level in more than 5 months.
Silver has strong resistance at $18-$19, which we expect to be re-tested as part
of a multi-week rebound.
Gold Stocks
For the second week in a row there was no immediate follow-through in the
gold-mining indices after a Wednesday reversal to the upside. As it turned out,
the HUI was flat on Thursday and gained 2.7% on Friday. This was not enough
strength to signal a short-term trend reversal, especially considering that
Friday's rise was limited by the 20-day MA.
With last week's rebound and the late-February rebound both being limited by the
20-day MA, a daily close above this MA could reasonably be viewed as a
confirming signal of a short-term trend reversal.
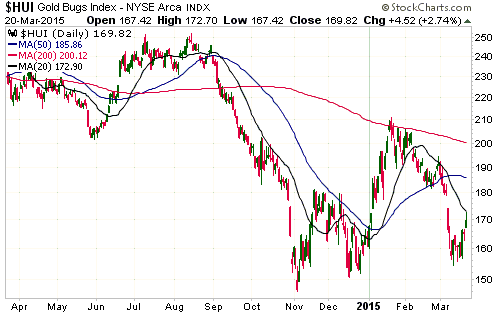
Although it hasn't yet been confirmed by the price action, we guess that the HUI
made a multi-week bottom last week. If so, a rebound over the next few weeks
could take the price as high as, but probably no higher than, the 200-day MA.
The Currency Market
Why have 'the Commercials' been so wrong about the euro?
The following chart shows that Commercial traders have, as a group, been heavily
net-long euro futures almost all of the way down (the blue bars indicate the
net-position of the Commercials). Since the Commercials are reputedly the "smart
money", how could they have been so wrong?
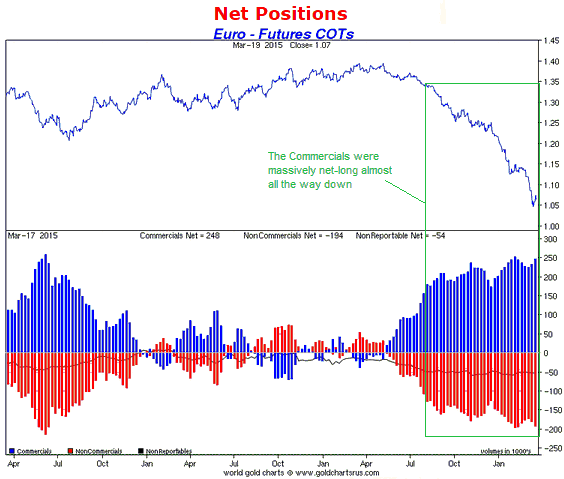
The answer is that they haven't been wrong. Here's why.
First, if we lump large speculators and small traders together under a category
labeled "speculators", then the commercial net-position is simply the
mathematical offset of the speculative net-position. If speculators, as a group,
are net long to the tune of X contracts, then commercials, as a group, will be
net short to the tune of X contracts. Second, in the currency market and
especially in the gold market (gold trades like a currency), speculators drive
short-term price moves. This is evidenced by the fact that speculators (as a
group) become increasingly 'long' as the price rises and then become
increasingly less long, or short, as the price declines.
Due to the fact that every long position in the futures market must be
associated with a short position (it's a zero-sum game), speculators cannot
increase their long exposure in the futures market unless commercials increase
their short exposure by exactly the same amount. To put it another way, it would
not be possible for speculators to drive the price upward by going 'long' if
there weren't commercials prepared to take the other side of the trade and 'go
short', and it would not be possible for speculators to go short or liquidate
their long positions unless commercials were prepared to go long or exit their
short positions.
Looking at it from a different perspective, it would not be possible for
commercials to hedge their long exposure in the cash market by going short in
the futures market unless speculators were prepared to do the opposite (go long)
in the futures market, and it would not be possible for commercials to hedge
their short exposure in the cash market by going long in the futures market
unless speculators were prepared to do the opposite.
Both commercials and speculators are needed to establish a liquid futures
market. The speculators create the opportunity for commercials to hedge by
selling into strength and buying into weakness, and commercials create the
opportunity for speculators to do what they do -- speculate on price direction.
That's why the relentless complaining in some quarters about commercial short
selling of gold futures and other precious-metals futures is so silly.
Complaining about a large commercial net-short position is the same as
complaining about a large speculative net-long position, because they are two
sides of the same coin -- you can't have one without the other. Limit the extent
to which the commercials can go short and you also limit the extent to which
speculators can go long.
Getting back to the euro futures market, it's not correct to say that the
commercials have been wrong, because a substantial commercial net-long position
in the futures market does not imply that the commercials are betting on a
rising euro. In general, the commercials don't bet on price direction; that's
what speculators do.
In the euro futures market the commercials haven't been wrong, but it's fair to
say that speculators, as a group, have been very right all the way down. That's
unusual. The Commitments of Traders (COT) situation is nothing more than a
sentiment indicator, and it's rare for speculative sentiment to reach either a
bullish or a bearish extreme and for the price to continue in the direction
expected by speculators with almost no interruption for many months thereafter.
So rare, in fact, that we can't recall ever seeing it before.
Current Market Situation
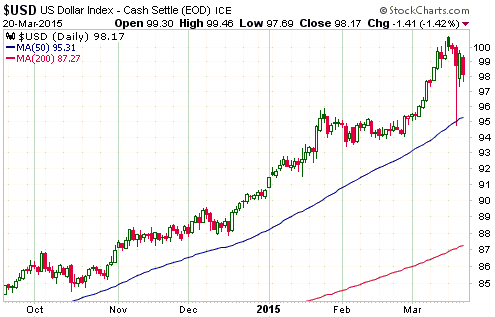
Volatility in the currency market has become extreme, with the Dollar Index
having its biggest intra-day trading range in many years last Wednesday in
reaction to a few words from the Fed.
We suspect that a top that holds for at least a few months is now in place, but
the price action hasn't yet confirmed this suspicion. Also, part of the topping
process could involve a test of last week's peak within the coming week or so.
If a multi-month peak has finally been put in place, then, based on what
happened following similar previous extremes, a decline to near the 200-day MA
is likely within the next 2 months.
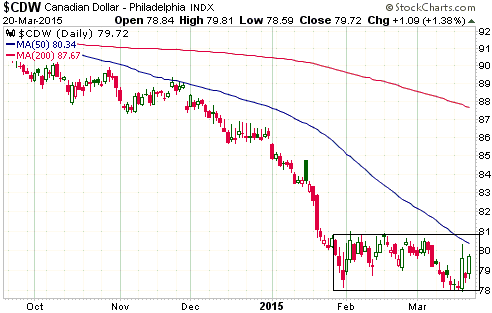
The Canadian Dollar (C$) reversed upward last week after testing its January
low. A daily close above 81 would now confirm that the C$ had 'double-bottomed'
at 78 and project an initial upside target of 84.
Updates
on Stock Selections
Notes: 1) To review the complete list of current TSI stock selections, logon at
http://www.speculative-investor.com/new/market_logon.asp
and then click on "Stock Selections" in the menu. When at the Stock
Selections page, click on a stock's symbol to bring-up an archive of
our comments on the stock in question. 2) The Small Stock Watch List is
located at http://www.speculative-investor.com/new/smallstockwatch.html
 Company
news/developments for the week ended Friday 20th March 2015: Company
news/developments for the week ended Friday 20th March 2015:
[Note: AISC = All-In Sustaining Cost, FS = Feasibility Study, IRR = Internal
Rate of Return, MD&A = Management Discussion and Analysis, M&I = Measured and
Indicated, NAV = Net Asset Value, NPV(X%) = Net Present Value using a discount
rate of X%, P&P = Proven and Probable, PEA = Preliminary Economic Assessment,
PFS = Pre-Feasibility Study]
*Asanko Gold (AKG) published its financial reports for the quarter
and year ending 31st December 2014.
Based on the balance sheet at 31st December and accounting for the equity
financing completed in February, we estimate that AKG currently has about
US$190M of net cash and $70M of undrawn credit. We also estimate that it will
need to spend about $180M to complete the construction of Phase 1 of its Asanko
gold mine in Ghana by the scheduled time of Q1-2016. Allowing $20M for the costs
of running the business and completing the engineering work associated with
Phase 2 of the project, this should mean that AKG will have about US$60M of cash
plus long-term debt of $130M when the 190K-oz/yr Phase 1 operation comes on line
in early 2016.
Completion of the PFS for Phase 2 was previously scheduled for Q1-2015, but is
now scheduled for Q2-2015. This is the next big milestone for AKG. It will, we
think, shine a spotlight on AKG's value.
We are comfortable with the way AKG is progressing. By this time next year it
should be a low-cost gold producer (the Phase 1 AISC is expected to be about
US$780/oz) with a solid balance sheet and substantial organic growth potential.
*Energy Fuels (EFR.TO, UUUU) published its financial reports for
the quarter and year ending 31st December 2014. The reports show that EFR's
balance sheet remains healthy, with $39M of working capital and only $16M of
long-term debt.
EFR is biding its time until the uranium price moves higher. The company limited
its production to 900K pounds of uranium in 2014 and plans to limit its
production to only a few hundred thousand pounds in 2015. At the same time it is
working down its inventory and delivering into long-term contracts at $57/pound,
thus generating positive operating cash flow despite the low uranium price.
It maintains the flexibility to quickly and substantially increase production
when the uranium price recovers (the company's White Mesa mill has the capacity
to process 8M pounds per year). We suspect that a spot price above $50/pound
would prompt the company to start ramping up its production. The current spot
price is around $39/pound.
The uranium market began to strengthen during the second half of last year, but
the crash in the oil price prevented the spot uranium price from making a
sustained break above $40. There's a realistic chance that the uranium price
will be at $50/pound or higher by year-end, but for that to happen there will
probably have to be an upward reversal in the oil price by mid-year and
additional progress on the
restart of nuclear reactors in Japan.
Note that an upward reversal in the oil market and continuing progress on
re-starting Japan's reactors are not totally independent events. This is because
the longer the oil price stays in the $40s or lower, the lesser the economic
fallout from the disastrous set of policies known as "Abenomics" and the lesser
the financial incentive to restart nuclear reactors.
*Pilot Gold (PLG.TO) announced that it has completed its 60%
earn-in at the TV Tower project in Turkey. There was never any doubt that this
would happen, but it's a significant milestone because it means that PLG's joint
venture partner (Teck) must fund 40% of all future exploration work. In other
words, reaching this milestone means that PLG will now be able to carry out a
larger amount of exploration at a lower cost to itself.
*Sabina Gold and Silver (SBB.TO) published its financial reports
for the quarter and year ending 31st December 2014. The company ended 2014 with
about C$32M of working capital, which should be more than enough to fund the
business for the next 12 months.
SBB plans to publish the results of the Back River FS during the second quarter
of this year. This will be a very important milestone for the company. It will
determine whether Back River has real value at current metal prices or is purely
an option on an eventual metal-price recovery.
*UEX Corp. (UEX.TO), an exploration-stage uranium miner, reported
that it had about C$8M of working capital at 31st December. Its exploration
budget for 2015 is $4.6M, which means it should have enough money to make it
through this year. However, the company will no doubt want to maintain a
significant cash reserve, so we expect that it will do a small equity financing
during the second half of the year.
Along with the shares of most other uranium-mining companies, the shares of UEX
will probably be 'dead money' until signs emerge of a sustained turnaround in
the uranium price.
 List of candidates for new buying
From within the ranks of TSI stock selections the best candidates
for new buying at this time, listed in alphabetical order, are:
1) AKG (last Friday's closing price: US$1.51).
2) EDV.TO (last Friday's closing price: C$0.54).
3) EVN.AX (last Friday's closing price: A$0.76).
4) RMS.AX (last Friday's closing price: A$0.10).
5) TGD (last Friday's closing price: US$0.69).
Note that the above list is limited to five stocks. It will
sometimes contain less than five, but it will never contain more
than five regardless of how many stocks are attractively priced for
new buying.
Chart Sources
Charts appearing in today's commentary
are courtesy of:
http://stockcharts.com/index.html
http://www.sharelynx.com/

|

