|
-- Weekly Market Update for the Week Commencing 23rd April 2007
Big Picture
View
Here is a summary of our big picture
view of the markets. Note that our short-term views may differ from our
big picture view.
Bonds commenced a secular BEAR market in
June of 2003. (Last
update: 22 August 2005)
The stock market, as represented by the S&P500 Index, commenced a secular BEAR market during the first quarter of 2000. The rally
that
began in October of 2002 will end during the first half of 2007. The ultimate bottom of
the secular bear market won't occur until the next decade. (Last update: 02 October 2006)
The Dollar commenced a secular BEAR market during the final quarter of 2000. The
first major downward leg in this bear market ended during the first
quarter of 2005, but a long-term bottom won't occur until 2008-2010. (Last update: 28 March 2005)
Gold commenced a
secular bull market relative to all fiat currencies, the CRB Index,
bonds and most stock market indices during 1999-2001. The first major
upward leg in this secular bull market ended in December of 2003, but a
long-term peak won't occur until at least 2008-2010. (Last update: 13
February 2006)
Commodities, as
represented
by the CRB Index, commenced a secular BULL market in 2001. The first
major upward leg in this bull market ended during the second quarter of
2006, but a long-term
peak won't occur until at least 2008-2010. (Last update: 08 January 2007)
Copyright
Reminder
The commentaries that appear at TSI
may not be distributed, in full or in part, without our written permission.
In particular, please note that the posting of extracts from TSI commentaries
at other web sites or providing links to TSI commentaries at other web
sites (for example, at discussion boards) without our written permission
is prohibited.
We reserve the right to immediately
terminate the subscription of any TSI subscriber who distributes the TSI
commentaries without our written permission.
Outlook Summary
Market
|
Short-Term
(0-3 month)
|
Intermediate-Term
(3-12 month)
|
Long-Term
(1-5 Year)
|
Gold
|
Neutral
(23-Apr-07)
|
Neutral
(23-Apr-07)
|
Bullish
|
US$ (Dollar Index)
|
Bullish
(23-Apr-07)
| Bullish
(31-May-04)
|
Bearish
|
Bonds (US T-Bond)
|
Neutral
(26-Mar-07)
|
Bearish
(26-Mar-07)
|
Bearish
|
Stock Market (S&P500)
|
Neutral
(19-Mar-07)
|
Neutral
(26-Mar-07)
|
Bearish
|
Gold Stocks (HUI)
|
Neutral
(23-Apr-07)
|
Neutral
(23-Apr-07)
|
Bullish
|
| Oil | Neutral
(12-Mar-07)
| Neutral
(25-Sep-06)
| Bullish
|
Industrial Metals (GYX)
| Neutral
(15-Jan-07)
| Neutral
(26-Mar-07)
| Bullish
|
Notes:
1. In those cases where we have been able to identify the commentary in
which the most recent outlook change occurred we've put the date of the
commentary below the current outlook.
2. "Neutral", in the above table, means that we either don't have a
firm opinion on which way the market will move or that we expect the
market to be trendless during the timeframe in question.
3. Long-term views are determined almost completely by fundamentals,
intermediate-term views by giving an approximately equal weighting to
fundmental and technical factors, and short-term views almost
completely by technicals.
The Fed's Dilemma
...a
break to new highs by the gold price has the potential to de-rail any
realistic possibility of a 2007 rate cut and shift the odds decisively
in favour of the next move being a rate hike.
Many analysts fixate on economic problems directly and indirectly
related to the downturn in the US housing market, and, as a result,
arrive at the conclusion that the Fed's next move will have to be a
rate cut. Their assessment of the situation could prove to be right,
but only under certain conditions because they are failing to account
for the Fed's greatest fear: an out-of-control rise in inflation
expectations. This is where gold comes in.
The gold price is steadily approaching its May-2006 peak, and although
we do not view a sustained move above this peak to be the most likely
short-term outcome there is a significant risk that an upside breakout
will soon occur. If it were to occur then the Fed might be forced to
commence another rate-HIKING campaign, an eventuality that would
obviously come as a big surprise to the financial markets and analysts
that expect the Fed to remain on hold over the next few months and to
commence a rate-CUTTING campaign well before year-end.
To the extent that gold is viewed as a barometer of inflation
expectations, a break to new highs by the gold price could provoke
unexpected -- unexpected, that is, from the mainstream financial
world's perspective -- actions from the Fed, especially if such a gold
market event were to happen while cyclical markets (equities and
industrial commodities) remained strong. The important thing to
understand is that the Fed has the tools to cope with most threats to
the monetary system. It can, for example, always arrange for more money
to be created and will therefore always be able to handle any
deflation-related threat with ease. It will hit a brick wall, however,
at the point where inflation EXPECTATIONS (expectations regarding the
currency's future loss of purchasing power) begin to run way ahead of
actual monetary inflation. This is the point at which increasing the
money supply will become counter-productive because it will result in
further outsized gains in inflation expectations, but increase the
money supply is what the Fed MUST continue to do to prevent the
largest-ever "Ponzi scheme" from unraveling.
In other words, in the current environment a break to new highs by the
gold price has the potential to de-rail any realistic possibility of a
2007 rate cut and shift the odds decisively in favour of the next move
being a rate hike. However, it seems that some high-profile commentators on the interest rate outlook don't even give the gold market a moment's thought when penning their forecasts.
The Gold Speculator's Dilemma
As a result of the global growth theme's resilience we have downgraded our intermediate-term gold market outlook to "neutral"...
In the 29th January 2007 Weekly Update we described what we perceive to
be the two most likely intermediate-term scenarios for gold. Both
scenarios entailed gold rising to test its May-2006 peak within the
ensuing few months, but after that they took very different paths. The
first scenario had gold testing its May-2006 peak and then dropping
back to test its June-2006 bottom (around $550) later in the year,
while the second scenario was based on the premise that a new
multi-year advance began last October. Under this more bullish scenario
a test of the May-2006 peak during the first half of the year would be
followed by a moderate pullback to around 630-650 and then an upward
move that took the gold price well beyond last year's high.
At that time we said we favoured the second (more bullish) scenario
because it meshed with our stock market and economic outlooks.
Specifically, we expected stock markets and industrial commodities to
start weakening by the second quarter of the year in anticipation of a
global growth slowdown, leading to wider yield and credit spreads and,
ultimately, to interest rate reductions on the part of the central
banking community.
Up until now gold's price action has been consistent with both of our
scenarios because the monetary metal has gained about $50 during the
intervening period and appears to be set for a test of its May-2006
peak in the near future. The challenge is in figuring out what's likely
to happen AFTER this test.
Looking at what's going on across the financial world we see a set of
circumstances that is slightly LESS bullish for gold -- from an
intermediate-term perspective -- than would be the case if our second
scenario still had a definitive advantage. In particular, although the
US yield-spread has shown signs of reversing upward, gold has recently
been under-performing the industrial metals and credit spreads are, on
average, narrower than they have ever been. This, along with the
performances of most stock markets throughout the world, tells us that
investors have not yet begun to discount a global growth slowdown. It
is, of course, possible for gold to continue its upward trend under
such conditions, but the reason we have headed this section "The Gold
Speculator's Dilemma" is that an upside breakout by the gold price in
the face of widespread strength in cyclical assets would likely provoke
a serious tightening of monetary policy, which would, in turn, have the
potential to halt the gold rally in its tracks. Or, to put it another
way: in the absence of sufficient weakness in growth-oriented
investments to mask an inflation threat and, thus, to prevent the Fed
from fighting the breakout, a move to new highs by the gold price would
probably contain the seeds of its own quick reversal.
As a result of the global growth theme's resilience we have downgraded
our intermediate-term gold market outlook to "neutral", meaning that we
now assign approximately equal odds to the two different scenarios
outlined in our 29th January commentary.
To avoid being whipsawed -- it's possible that we will be forced to
switch back to "bullish" at some point over the coming 6 weeks -- we
wrestled with the idea of leaving our intermediate-term bullish view in
place while awaiting further developments. However, "neutral" most
accurately reflects our assessment of the current situation. We hope
(and expect) that the performances of the financial markets between now
and the end of May will bring enough clarity to allow us to 'get off
the fence', but for now there's too much uncertainty to commit to a
more definitive view.
Grain prices in real terms
When looking at the
nominal price charts of corn, soybeans and wheat you might get the
impression that the grains have become expensive due to the price gains
of the past year or so. However, if you look at the following
CPI-adjusted charts (courtesy of www.fullermoney.com)
you should get a very different impression. These charts show that
grain prices would have to approximately quadruple from where they are
now just to bring them back to where they were in the 1970s, assuming
that changes in the CPI accurately reflect changes in the dollar's
purchasing power.
Of course, changes in the CPI do not accurately reflect changes in the
dollar's purchasing power. Even an honest attempt to come up with a
single number that represents the economy-wide change in the dollar's
purchasing power would necessarily fail because there can never be any
such thing as the average price within an economy. To paraphrase
Einstein: some things that can be measured aren't worth measuring, and
some things that are worth measuring can't be measured. The
economy-wide purchasing power of a currency falls into the latter
category. We can observe the effects of a change in purchasing power,
but it is not possible to calculate a meaningful number that represents
this change.
But the Government's attempts to calculate changes in purchasing power
are not honest; rather, they are designed to come up with a number that
understates the effects of inflation. Therefore, although we can't
accurately measure the change in the 'real' price of anything, we can
be sure that in real terms today's grain prices are even lower than
suggested by the following charts.
The Stock
Market
The US stock market in real terms
...all the price gains achieved since early October have been the result of currency depreciation.
Over the very long-term, changes in the gold price probably do a better
job than anything of reflecting changes in the official currency's
purchasing power. Therefore, changes in real prices can, over
multi-decade periods, be 'seen' by dividing nominal prices by the price
of gold.
Over shorter time periods the gold price reflects financial-market mood
swings rather than changes in purchasing power, so when we chart
gold-denominated prices over periods of a few years or less and refer
to the chart as being a reflection of real performance -- as we've done
below with the S&P500 -- we are using poetic license (we are
deviating from the strictly-correct definition of the word "real").
What we are endeavouring to show, with such charts, is the financial
markets' PERCEPTION of whether price increases are real or
inflation-induced.
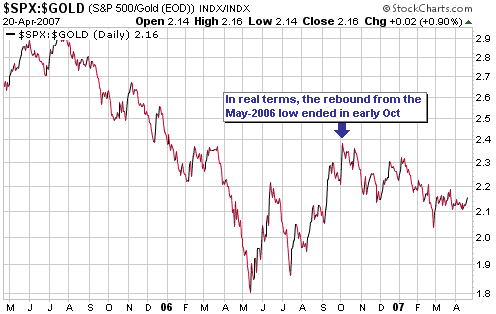
The message of the following S&P500/gold chart is that the US stock
market experienced a good rally during June-September of last year, but
despite the reams of bullish commentary to the contrary the market's
perception is that all the price gains achieved since early October
have been the result of currency depreciation.
It's worth pointing
out, though, that while the people who have been 'long' the S&P500
Index since early October haven't really achieved anything, the people
who have been 'short' have suffered real losses. In a high-inflation
world the odds are stacked heavily against anyone who attempts to
profit from a fall in nominal prices.
Current Market Situation
We doubt that the ultimate highs are in place, but the market is very
'overbought' and desperately needs a pullback to restore balance. When
some Asian markets dropped sharply last Thursday it momentarily looked
like such a pullback was about to begin, but this was not the case as
the S&P500 closed only two points lower that day and then surged to
new multi-year highs on Friday. There have now been 14 trading days
since the beginning of this month and the S&P500 has risen on 12 of
them.
The Yen carry trade continues to be a very important driver of stock
markets throughout the world. Over the past month the US$ has been very
weak relative to most major currencies, but relative to the Yen it has
strengthened as speculators have continued to take advantage of the
almost-free money being made readily available to the world by the Bank
of Japan (BOJ). With official overnight interest rates throughout the
non-Japanese developed world ranging from the ECB's 3.75% to the Bank
of New Zealand's 7.5%, there is an enormous incentive to borrow Yen at
less than 1% to finance investments almost anywhere else.
The central bankers of Europe, the US, Australia, New Zealand and
Canada must be getting extremely frustrated because their attempts to
reduce the global liquidity deluge are being rendered futile by the
idiocy of Japan's monetary policy. The Japanese are blowing bubbles
everywhere...except Japan.
The Yen carry trade has become a drug and global stock markets appear
to be hopelessly addicted. This sets the stage for substantial stock
market declines and a simultaneous Yen rally at some point in the
future. The risk is high, but the timing is unknowable.
This week's
important US economic events
| Date |
Description |
Monday Apr 23
| No important events scheduled
|
Tuesday Apr 24
| Consumer Confidence
Existing Home Sales
| | Wednesday Apr 25
| Durable Goods Orders
New Home Sales
Fed's Beige Book
| | Thursday Apr 26
| No important events scheduled
| | Friday Apr 27
| GDP
Employment Cost Index
|
Gold and
the Dollar
Currency Market Update
It would be an understatement to say that the currency market is extended at this time. For example:
a) Before experiencing a small bounce on Friday, the Dollar Index had fallen for 8 days in succession.
b) The euro has risen for 6 weeks in a row and 11 of the past 12 weeks.
c) Last week, Market Vane's bullish consensus for the euro and the
British Pound hit 2-year highs of 81% and 89%, respectively, while the
Dollar Index's bullish consensus dropped to 28% (within 2% of a 2-year
low).
d) The following chart shows that the Dollar Index touched the bottom
of what COULD be a large declining wedge pattern late last week in
parallel with a POTENTIAL positive divergence of momentum indicators.
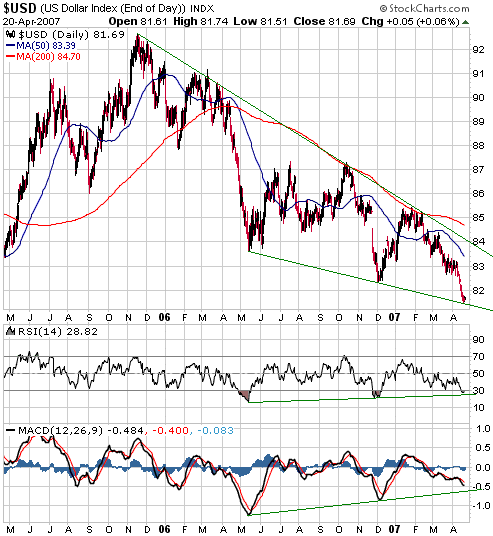
There is not yet any
evidence that the US$ has bottomed, but we think the dollar's
short-term risk/reward is now skewed toward the reward side of the
equation. We have therefore upgraded our short-term US$ outlook to
"bullish", although if we were short-term traders of currencies (we
aren't) we would wait for an upward reversal before making a leveraged
bet on a US$ rally.
Note that while there appears to be excessive bullishness toward some
US$ alternatives -- the euro, the Pound and the Australian Dollar, in
particular -- universal bullishness toward US$ alternatives is not
apparent. The latest Commitments of Traders data, for instance, show
that speculators are bearish on the Yen and the Swiss Franc and neutral
on the Canadian Dollar.
The euro appears to be the US$ alternative most vulnerable to a downward reversal.
Gold
Below is a weekly chart of gold futures.
The May-2006 peak was the end result of 9 up-weeks in a row. The
current sequence of up-weeks is 7, although the most recent rise has
been a lot weaker than the rise that resulted in the May-2006
intermediate-term peak. Whereas the relentless surge during March-May
of last year was clearly a blow-off move, gold has not made substantial
progress despite having risen for the past 7 weeks in succession and 14
of the past 15 weeks. In fact, it has just taken gold 7 weeks to
recover the ground it lost during a single week in the February-March
correction.
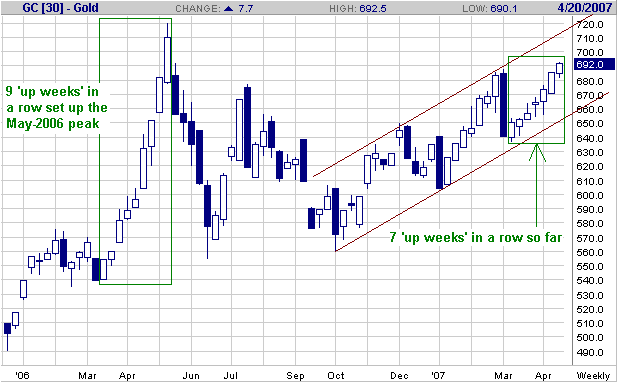
Since early October
of last year we've had the range between the May-2006 and July-2006
peaks in mind as a short-term upside target. The bottom end of this
target range has just been reached near a time when cycle analysis
projects a turning point. We've therefore downgraded our short-term
outlook from "bullish" to "neutral".
Ideally, gold will make some additional gains over the coming 1-3 weeks
(based on cycles, the 'ideal' time for a peak is the first half of
May), but the risk/reward no longer justifies a short-term bullish
view. In downgrading our gold market outlook we are also taking into
account the likelihood of an upward reversal in the US$ at some point
over the next few weeks.
Gold Stocks
We have been short-term bullish on the gold sector since 4th October of
last year in anticipation of the AMEX Gold BUGS Index (HUI) rising to
370-400 during the first half of 2007. The bottom of this target range
was touched over the past week, so our short-term price objective has
essentially been achieved. Also, we've been expecting that a short- or
intermediate-term peak would be in place by mid May, so our time
objective is close to being achieved. As a result, we have downgraded
our short-term outlook on the HUI from "bullish" to "neutral".
A confusing aspect of the current market environment is the investing
public's lack of enthusiasm for the major gold stocks. Given that gold
has been rising in parallel with a strong stock market we would have
expected the gold stock indices to be livelier than they have been over
the past few months. In particular, we would have expected to see
significant strength in the major gold stocks relative to gold bullion.
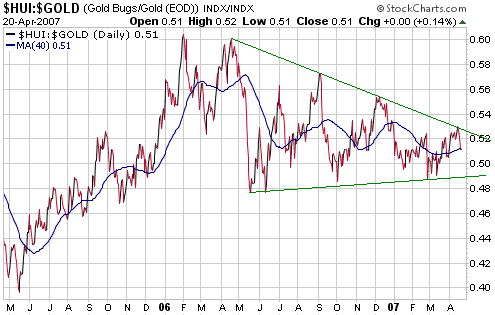
However, the following chart shows that the HUI/gold ratio ended last
week not far above its lows of the past 18 months. Additionally, the
amount of cash invested in the Rydex Precious Metals fund (RydexPM)
dropped to a new 3-year low last Friday. RydexPM could well be in a
terminal decline due to competition from various ETFs, but it has
continued to work as a sentiment indicator provided the downward trend
in its size is taken into account. Its current message is that
sentiment is more consistent with a short-term bottom than a short-term
peak.
The sentiment
backdrop makes further gains likely over the coming 2-3 weeks. We
don't, however, think there is sufficient additional upside potential
relative to the downside risk to warrant maintaining a short-term
bullish outlook.
How each person approaches the market will always depend on individual
circumstances. For example, it could be appropriate for someone with
heavy exposure to a long-term bull market to be clipping profits and,
at the same time, be appropriate for someone with minimal exposure to
be doing some buying.
With respect to the gold sector's current situation, we think people
who are substantially overweight the sector should be looking for
opportunities to scale back to their "core" position whereas people who
are yet to build a core position should be looking for opportunities to
scale-in. A core position should be small enough that a 20-30% decline
would not be unduly stressful and large enough that you would welcome
20-30% of additional upside. It is, in effect, the psychological
break-even point between hoping for a large correction so that you can
put some cash reserves to work at lower prices and hoping for a large
rally so that you can take profits at higher prices.
During the course of a long-term bull market there will invariably be
some big upside surprises, so those who attempt to avoid the
corrections altogether by getting completely out of the market will
eventually come unstuck. In our opinion, you position yourself to get
the most from a long-term bull market by maintaining core exposure at
all times.
Non-Gold Mining Stocks
Below is a chart comparing junior copper/gold producer Northgate
Minerals (AMEX: NXG), a stock that was added to the TSI List as a
short-term trade about two weeks ago, with Peabody Energy (NYSE: BTU),
a major coal producer. We don't have an interest in Peabody -- our only
coal play is Red Hill Energy (TSXV: RH), a stock that has recently
begun to perk-up due to the growing interest in its Mongolia-based coal
deposit -- but thought the similarities between Peabody's chart and
that of NXG were worth highlighting.
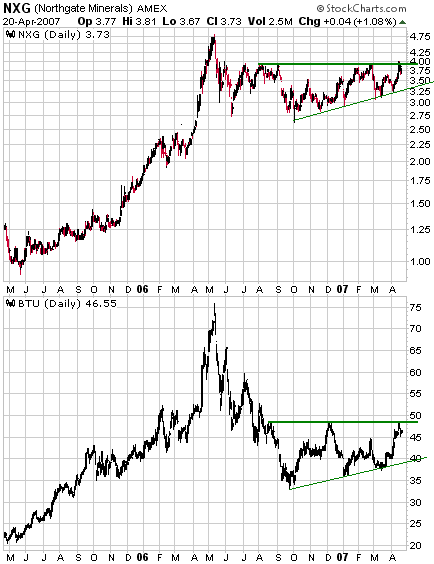
Patterns similar to
the ones revealed in the charts of NXG and BTU keep popping up
throughout the non-gold mining world. The pattern entails a spectacular
upside blow-off followed by a sharp decline and then an extended period
of base building. In the cases of NXG and BTU, a break above the top of
the base has not yet occurred but appears to be close-at-hand. In the
cases of some other stocks, such as the two TSI stock selections
charted below (Taseko Mines and Northern Orion Resources), a break
above the top of the base has already occurred.
The short-term outlook for non-gold mining stocks remains bullish.
Update
on Stock Selections
(Note: To review the complete list of current TSI stock selections, logon at http://www.speculative-investor.com/new/market_logon.asp
and then click on "Stock Selections" in the menu. When at the Stock
Selections page, click on a stock's symbol to bring-up an archive of our comments on the stock in question)
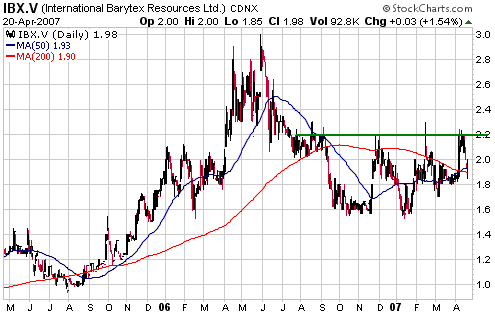
 International Barytex Resources (TSXV: IBX). Shares: 36M issued, 53M fully diluted. Recent price: C$1.98 International Barytex Resources (TSXV: IBX). Shares: 36M issued, 53M fully diluted. Recent price: C$1.98
IBX is a very speculative stock -- the company is exploring a copper
project in the Democratic Republic of Congo and hasn't yet released an
initial estimate of the in-ground resource -- and is too illiquid to be
purchased as a short-term trade. However, a speculator who buys with
the aim of holding for up to 2 years if need be will potentially be
rewarded with a good short-term gain. This is because a break above the
resistance at C$2.20 would create a short-term technical objective of
C$2.70-$3.00.
The initial resource estimate due next month could be the catalyst for such a move.
 Hecla Mining (NYSE: HL). Shares: 119M issued, 120M fully diluted. Recent price: US$9.69 Hecla Mining (NYSE: HL). Shares: 119M issued, 120M fully diluted. Recent price: US$9.69
Since adding HL to the Stocks List last October we've had US$9-$10 in
mind as a profit-taking range. With the stock now in the upper half of
this range and with the gold sector probably within three weeks of a
peak, we've decided to make our exit. The profit on the trade, based on
our original price of US$5.48 and Friday's closing price of US$9.69,
was 77%.
 Metallica Resources (AMEX: MRB, TSX: MR). Shares: 92M issued, 118M fully diluted. Recent price: US$5.36 Metallica Resources (AMEX: MRB, TSX: MR). Shares: 92M issued, 118M fully diluted. Recent price: US$5.36
We currently have Metallica Resources stock and warrant positions in the TSI Stocks List.
The warrants were added in November-2005 to provide leveraged exposure
to a deeply under-valued gold stock. We think that now is an opportune
time to exit these warrants -- firstly because the stock is no longer
deeply under-valued; secondly because the sector-wide risk/reward has
deteriorated; and thirdly because we can (the TSI Stocks List is not
run like a portfolio so in most cases we can't use it to demonstrate
good money-management practice, but in this case we effectively have
two positions in the one stock and therefore have the ability to make a
partial exit in response to increasing market risk).
The profit on the warrants, based on our original price of C$0.37 and Friday's closing price of C$3.00, was 711%.
We still consider MR to be one of the best long-term speculations in
the gold sector and would maintain significant exposure to this company
via the stock and/or the warrants. This is just an opportunity to take
partial profits -- something we are able to do in this case by virtue
of having two entries in our Stocks List for the one stock.
Chart Sources
Charts appearing in today's commentary
are courtesy of:
http://stockcharts.com/index.html
http://www.futuresource.com/
http://www.fullermoney.com/

|

