|
-- Weekly Market Update for the Week Commencing 23rd April 2012
Big Picture
View
Here is a summary of our big picture
view of the markets. Note that our short-term views may differ from our
big picture view.
In nominal dollar terms, the BULL market in US Treasury Bonds
that began in the early 1980s will end by 2013. In real (gold)
terms, bonds commenced a secular BEAR market in 2001 that will continue
until 2014-2020. (Last
update: 23 January 2012)
The stock market, as represented by the S&P500 Index, commenced
a secular BEAR market during the first quarter of 2000, where "secular
bear market" is defined as a long-term downward trend in valuations
(P/E ratios, etc.) and gold-denominated prices. This secular trend will bottom sometime between 2014 and 2020. (Last update: 22 October 2007)
A secular BEAR market in the Dollar
began during the final quarter of 2000 and ended in July of 2008. This
secular bear market will be followed by a multi-year period of range
trading. (Last
update: 09 February 2009)
Gold commenced a
secular bull market relative to all fiat currencies, the CRB Index,
bonds and most stock market indices during 1999-2001. This secular trend will peak sometime between 2014 and 2020. (Last update: 22 October 2007)
Commodities,
as represented by the Continuous Commodity Index (CCI), commenced a
secular BULL market in 2001 in nominal dollar terms. The first major
upward leg in this bull market ended during the first half of 2008, but
a long-term peak won't occur until 2014-2020. In real (gold) terms,
commodities commenced a secular BEAR market in 2001 that will continue
until 2014-2020. (Last
update: 09 February 2009)
Copyright
Reminder
The commentaries that appear at TSI
may not be distributed, in full or in part, without our written permission.
In particular, please note that the posting of extracts from TSI commentaries
at other web sites or providing links to TSI commentaries at other web
sites (for example, at discussion boards) without our written permission
is prohibited.
We reserve the right to immediately
terminate the subscription of any TSI subscriber who distributes the TSI
commentaries without our written permission.
Outlook Summary
Market
|
Short-Term
(0-3 month)
|
Intermediate-Term
(3-12 month)
|
Long-Term
(1-5 Year)
|
| Gold
|
Bullish
(26-Mar-12)
|
Bullish
(26-Mar-12)
|
Bullish
|
| US$ (Dollar Index)
|
Neutral
(22-Nov-11)
| Neutral
(09-Jan-12)
|
Neutral
(19-Sep-07)
|
| Bonds (US T-Bond)
|
Neutral
(11-Apr-12)
|
Neutral
(18-Jan-12)
|
Bearish
|
| Stock Market
(DJW)
|
Bearish
(23-Jan-12)
|
Bearish
(28-Nov-11)
|
Bearish
|
| Gold Stocks
(HUI)
|
Bullish
(26-Mar-12)
|
Bullish
(23-Jun-10)
|
Bullish
|
| Oil | Neutral
(31-Jan-11) | Neutral
(31-Jan-11)
| Bullish
|
| Industrial Metals
(GYX)
| Neutral
(22-Nov-11)
| Neutral
(29-Aug-11)
| Neutral
(11-Jan-10)
|
Notes:
1. In those cases where we have been able to identify the commentary in
which the most recent outlook change occurred we've put the date of the
commentary below the current outlook.
2. "Neutral", in the above table, means that we either don't have a
firm opinion or that we think risk and reward are roughly in balance with respect to the timeframe in question.
3. Long-term views are determined almost completely by fundamentals,
intermediate-term views by giving an approximately equal weighting to
fundamental and technical factors, and short-term views almost
completely by technicals.
A note on
"austerity"
Once an entity has taken on too much debt or has reached the point where the current level of its spending is not justified based on its current income and/or assets, that entity must practice financial austerity. This is the case regardless of whether the entity in question is a government, a corporation or an individual. To get back to financial health it will be necessary for spending to be less than income, usually for a lengthy period. This period of austerity will undoubtedly be tough to deal with, but there is simply no alternative if the goal is to return to financial health.
That being said, the rules that apply to government austerity are different to the rules that apply to austerity on the part of an individual or a corporation, although not in the way that Keynesian economists believe. Keynesian economists typically believe that if the economy is weak then the government should keep spending and borrowing aggressively, regardless of how bad the government's financial situation happens to be.
Different rules apply to the government because the government can only pay down its debt via some form of theft (taxation or inflation). A consequence is that whereas private entities should always attempt to make good on their debts, government austerity should always involve direct debt default. Ideally, the government should default on all of its debt, substantially reduce its spending and use any surplus resulting from the elimination of debt repayments and other reductions in spending to finance tax cuts. By doing so the government will greatly lessen the burden it places on the economy, thus paving the way for a more expeditious return to health by the private sector.
Further to the above, European governments are presently going about "austerity" in completely the wrong manner. The focus is on paying down government debt and increasing taxes, which means that the extent of government theft and the burden placed on the economy by the government are being ramped up. This version of "austerity" is bound to end in disaster.
Interesting and Relevant
Quote
"In periods that are relatively loss free, people tend to think of risk as volatility and become convinced they can live with it. If that were true, they would experience markdowns, invest more at the lows and go on to enjoy the recovery, coming out ahead in the long run. But if the ability to live with volatility and maintain one's composure has been overestimated -- and usually it has -- that error tends to come to light when the market is at its nadir. Loss of confidence and resolve can cause investors to sell at the bottom, converting downward fluctuations into permanent losses and preventing them from participating fully in the subsequent recovery. This is the greatest error in investing -- the most unfortunate aspect of pro-cyclical behavior -- because of its permanence and because it tends to affect large portions of portfolios."
- From Howard Marks' book "The Most Important Thing"
Many investors exited the gold sector in disgust during October-November of 2008, vowing never to return. Consequently, they turned what should have been a large temporary draw-down into a permanent loss. It looks like something similar is happening this year.
The Stock
Market
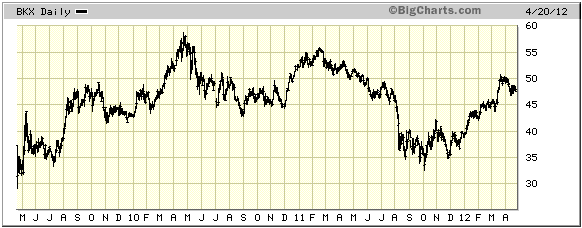
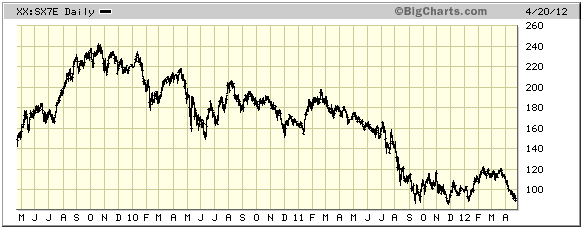
A tale of two bank-stock indices
The first of the following daily charts shows how US bank stocks (as represented by the BKX) have performed over the past three years. The second chart shows how European bank stocks (as represented by the EURO STOXX Banks Index) have performed over the same period. A comparison of these charts reveals that US bank stocks have generally outperformed European bank stocks since October of 2009, and that the outperformance has been dramatic since last December. This means that the Fed has been doing a better job than the ECB of supporting poorly-managed financial institutions.
The dramatic outperformance of US bank stocks over the past 5 months is difficult to explain because it occurred in parallel with massive monetary injections into Europe's banks via the ECB's LTROs. We suspect that the recent huge divergence will soon have to close, either via a large decline in the US banking sector or via sufficient additional money creation on the part of the ECB to bring about a large rebound in Europe's banking sector.
Stocks around the world
There is no change in our outlook for the senior US stock indices. The downward corrections that began about three weeks ago are probably not yet complete, but major weakness is unlikely in the short-term.
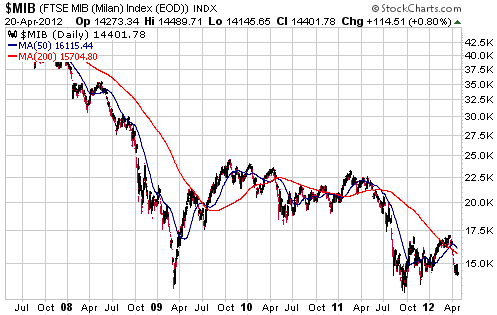
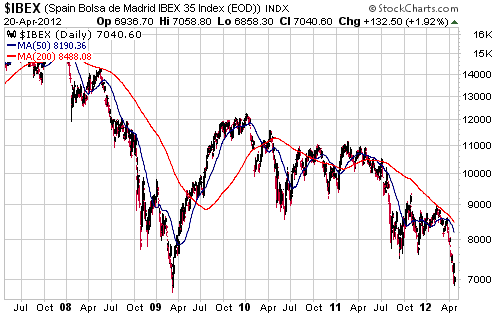
As mentioned in last week's Interim Update, the senior US stock indices have been poor proxies for what has been happening to equities around the world. For example, whereas the S&P500 Index recently made a new multi-year high and is still close to this high, we have:
1. The Italian stock market (as represented by the MIB Index) not far above the 5-year low reached last year.
2. The Spanish stock market (as represented by the IBEX Index) well below last year's low and closing in on its March-2009 low, having recently experienced a bona fide crash.
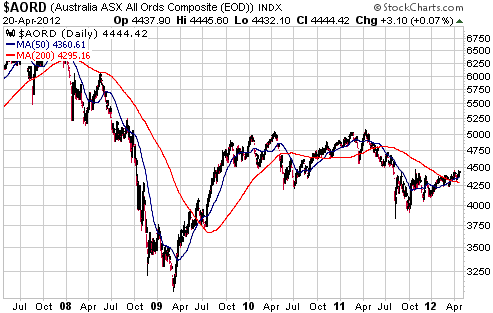
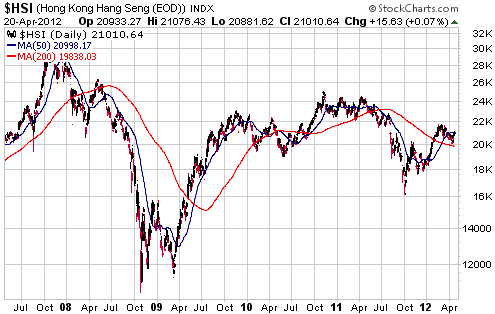
3. The Australian and Hong Kong stock markets (as represented by the All Ordinaries Index and the Hang Seng Index, respectively) still well below last year's highs and no higher than they were in August of 2009.
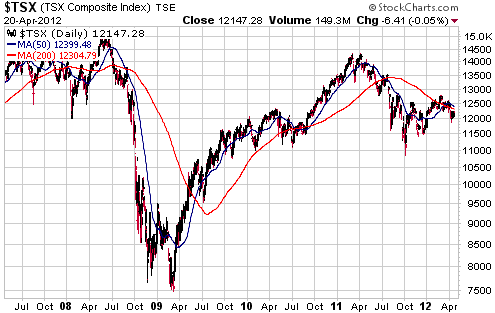
4. The Canadian stock market (as represented by the TSX Composite Index) still well below last year's high and no higher than it was in early 2010.
This week's
important US economic events
| Date |
Description |
| Monday Apr 23 | No important events scheduled
| | Tuesday Apr 24 | Case-Shiller
Home Price Index
Consumer Confidence
New Home Sales
| | Wednesday Apr 25 | FOMC
Announcement
Durable Goods Orders | | Thursday
Apr 26 |
Pending Home Sales
|
| Friday Apr 27 | Q1
GDP
Employment Cost Index
Consumer Sentiment
|
Gold and
the Dollar
Gold
Is gold still cheap?
We addressed the above question last year and arrived at the answer: no, gold left bargain territory long ago. We remain bullish on gold not because we think gold is still cheap, but because we expect it to get a lot more expensive.
This isn't a "greater fool" game that we are playing, in that our belief that gold will become a lot more expensive over the years ahead isn't based on the expectation that people will be silly enough to pay a much higher valuation in the future for an asset that is already over-valued today. It is, instead, a position based on the observation that the world's most important central banks and governments remain committed to a course that ends in catastrophe for their economies and currencies. To put it another way, gold may well be expensive relative to the current economic backdrop, but it is cheap relative to what the economic backdrop will be 5 years from now if the current policy course is maintained. And at this stage there are no signs that the current policy course will not be maintained.
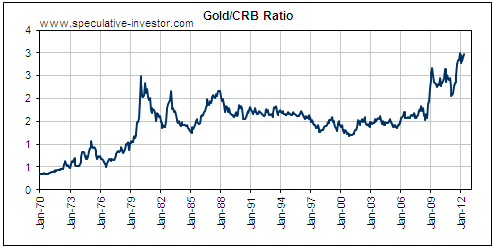
Evidence that gold is no longer in the bargain basement is provided by the following long-term monthly chart of the gold/commodity ratio. Relative to commodities in general, gold hit a 50-year high late last year. In fact, last December's peak in the gold/commodity ratio could have been an all-time high. This tells us that the gold market has fully discounted the bad policies of the past several years. As an aside, it also tells us that the fabled gold market manipulators are doing a lousy job and should be fired (gold's excellent performance over any reasonable investment timeframe is no doubt why promoters of gold-suppression theories tend to focus on timeframes that could only be of interest to
daytraders).
Evidence that the gold market hasn't yet discounted the effects of continuing along the current policy path is the general lack of understanding of the damage that these policies cause. Almost everyone in power or in a position to influence those in power believes that the economy can be helped by the artificial lowering of interest rates, the creation of money out of nothing, and increased government spending. And almost everyone believes that the government is responsible for creating jobs and managing the international trade balance. This means that almost everyone is oblivious to the fact that whenever the government intervenes in the economy it causes distortions that impede real economic progress. As long such beliefs are dominant, economic weakness will lead to counterproductive policy responses, which will lead to additional economic weakness, and so on.
The gold bull market is being driven by the vicious cycle whereby bad policy begets economic weakness, which provides the excuse for more bad policy. It won't end until there is an economic and monetary catastrophe or there is widespread understanding of the root of the problem, because one or the other will have to happen before a major constructive political change will be possible. Hopefully the latter will happen first, because living through the former wouldn't be fun even for those who had taken all the right protective measures.
How would we be able to tell that widespread understanding of the root of the problem was developing, and, therefore, that the gold bull market was in its final phase?
There would be many indicators. Of greatest importance, the Fed would be demonstrating the resolve to severely restrict growth in the money supply regardless of the short-term consequences for equity prices and GDP growth. Also, politicians that were genuine advocates of small government (along Ron Paul lines) would be taken seriously by the mainstream media and would be frontrunners in elections, whereas advocates of Keynesian economic policies (along Paul Krugman lines) would not be taken seriously.
Current Market Situation
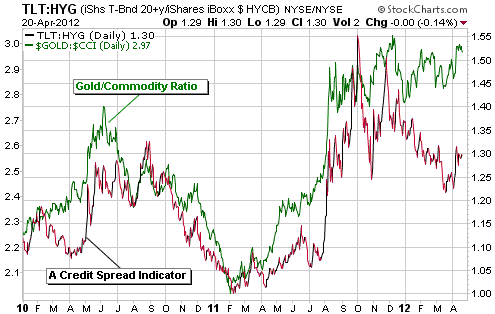
The gold/commodity ratio's long-term performance is illustrated by the chart displayed above. The chart displayed below zooms in on its performance since the beginning of 2010 and compares this performance with the TLT/HYG ratio. The TLT/HYG ratio is a credit-spread indicator that rises when credit spreads widen and falls when credit spreads contract. Credit spreads, in turn, are indicators of economic confidence. The positive correlation reflected by the following chart therefore suggests that gold does better than most commodities when economic confidence is falling (as indicated by widening credit spreads) and worse than most commodities when economic confidence is rising (as indicated by narrowing credit spreads).
Over the past 6 months gold has done surprisingly well relative to commodities in general considering the narrowing of credit spreads over this period. This can possibly be explained by the fact that the TLT/HYG ratio is a US-centric indicator. Rightly or wrongly (in our opinion: wrongly), confidence in the US economy has improved over the past 6 months. However, gold and commodities are global markets and the same cannot be said about confidence in the economies of other important regions and countries, most notably Europe and China.
Due to general weakness in commodity prices as opposed to strength in the gold price, the gold/commodity ratio remains near last year's multi-decade high. We expect it to move a lot higher over the next two years, but we don't have a strong opinion on what it will do over the next two months. One plausible short-term possibility is that it will begin to pull back next month due to a general rebound in commodity prices.
With regard to the US$-denominated gold price, the continued absence of sufficient strength to confirm a low leaves open the possibility of a quick -- and likely final -- decline to support at $1550-$1600. As a result of last week's price action, this is now the possible near-term outcome with the highest probability.
Silver
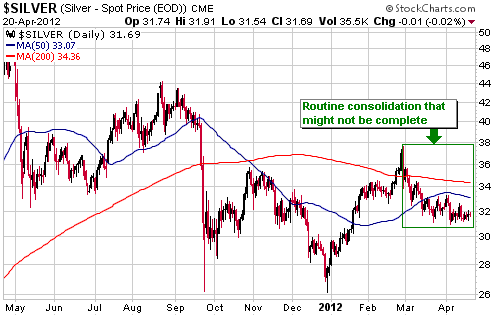
Silver has had a downward bias since late February, but the decline continues to look more like a consolidation than the start of a new trend. There is no evidence that the consolidation is complete, so it won't be surprising if a decline to a new 2-month low (to around $29-$30) happens within the coming fortnight. It will, however, be surprising if last December's low is tested prior to the start of the next tradable rally.
Gold Stocks
A note on sentiment
The water torture continues in the gold sector. The HUI hasn't made a new low for 12 trading days, but it is showing no signs of strength and many individual gold stocks have been making new lows each day. The price declines in the gold-stock indices over the past several weeks have been nowhere near as substantial as the declines that occurred during August-October of 2008, but sentiment is probably worse today than it was in 2008. At least in 2008 there was a lot of excitement to keep people interested. Recently there has been an almost total absence of excitement, with prices edging lower most days as another batch of retail investors 'throws in the towel'.
We haven't experienced such a depressed market for gold shares at any time over the past 10 years, but we did experience something along these lines in 2000. In the months leading up to the major bottom of November-2000 the HUI lost a lot of ground in a slow and steady manner. There was no scary plunge, just a gradual capitulation that tried the patience and the staying power of even the most resolute long-term bulls.
Current Market Situation
The gold sector's situation at the end of last week was almost identical to its situation a week earlier and a week before that. It remains very 'oversold', but hasn't signaled an upward reversal.
That the market has come this far without reversing opens up the possibility that we will get a traditional May turning point this year. We say "traditional" because during the first 6 years of its long-term bull market there was a strong tendency for the gold sector to make an intermediate-term reversal during May (usually the first half of May).
When a multi-month trend reverses direction within a traditional turning point window, the reversal will usually 'stick'.
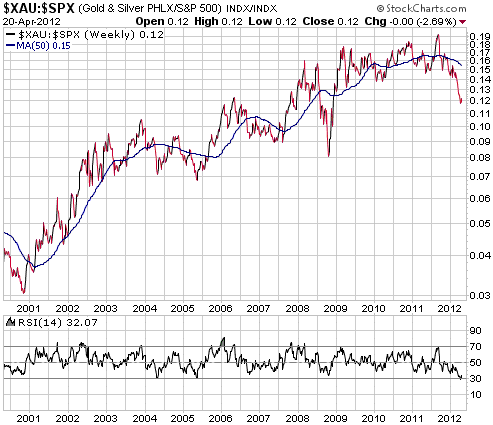
As mentioned in previous commentaries, in addition to being extremely 'oversold' in nominal currency terms the gold sector is also extremely 'oversold' relative to the broad stock market. This is evidenced by the RSI at the bottom of the following weekly chart of the XAU/SPX ratio. Based on the historical record, an upward reversal in the XAU/SPX ratio will probably be followed by at least 6 months of relative strength in the gold sector.
Currency Market Update
The daily chart of the Dollar Index (see below) continues to indicate that the next 3-point move is just as likely to be to the upside as the downside. In other words, the price action remains noncommittal.
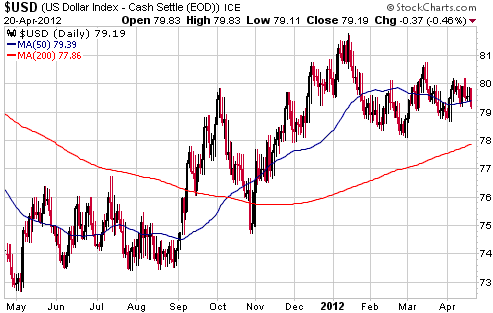
For the direction of the Dollar's next 2-3 point move to be to the upside, the S&P500 index will probably have to drop at least a few percent below its recent low. The reason is that in the absence of 'safe haven' demand stemming from significant stock market weakness, the Dollar Index will have difficulty making much headway in the face of the massive speculative short position in euro futures that continues to underpin the euro (the USD/EUR exchange rate is almost 60% of the Dollar Index, so strength in the Dollar Index requires weakness in the euro relative to the US$). We expect the covering of this short position to propel the euro to a new high for the year -- and the Dollar Index to a new low for the year -- during the next multi-week period of strength in the stock market.
If there is sufficient stock market weakness within the coming fortnight to push the Dollar Index up to 81-82, then we will probably downgrade our short-term US$ outlook to "bearish".
Update
on Stock Selections
Notes: 1) To review the complete list of current TSI stock selections, logon at
http://www.speculative-investor.com/new/market_logon.asp
and then click on "Stock Selections" in the menu. When at the Stock
Selections page, click on a stock's symbol to bring-up an archive of
our comments on the stock in question. 2) The Small Stock Watch List is
located at http://www.speculative-investor.com/new/smallstockwatch.html
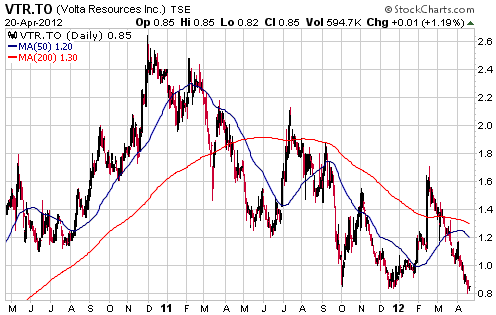
 Volta Resources (TSX: VTR). Shares: 155M issued, 165M fully diluted. Recent price: C$0.85 Volta Resources (TSX: VTR). Shares: 155M issued, 165M fully diluted. Recent price: C$0.85
We entered 2012 anticipating a strong rebound in junior gold stocks that would extend through the first quarter. The first two months of the year went according to plan, but the market went astray in March when a pullback evolved into a relentless downward trend.
Very few junior gold stocks have escaped the downward trend of the past two months. In most cases, even the companies that have delivered good results have been hit hard in the stock market. For example, VTR has delivered good results -- better than expected results, actually -- on the exploration front, but this hasn't prevented its stock price from falling back to last December's low in response to the sector-wide malaise.
More good news from VTR is probably on the way in the form of a Pre-Feasibility Study (PFS) for its Kiaka gold project. Unless the PFS contains blowout numbers it might not have an immediate positive effect on the stock price, but the value that continues to be built by VTR's exploration and engineering work will eventually pay dividends.
We suggest the accumulation of VTR shares on weakness, either as a long-term speculation or in anticipation of a strong rebound once the overall sector makes a short-term bottom.
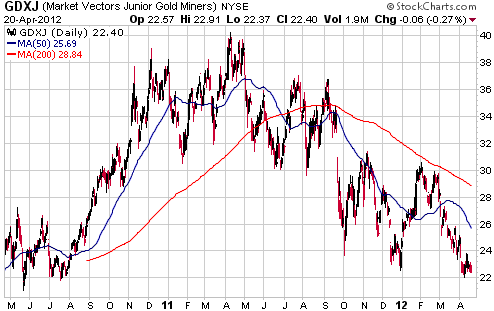
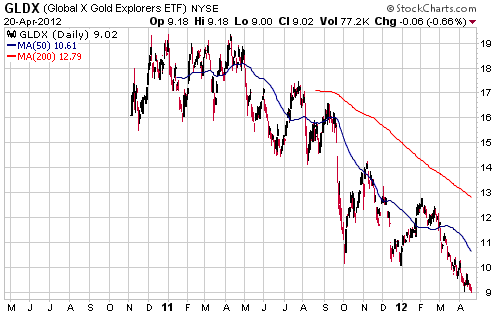
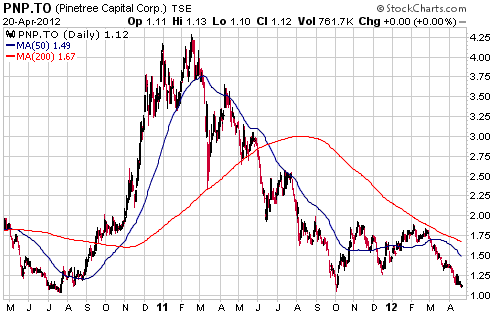
Plays on the junior end of the gold sector
GDXJ, GLDX and PNP.TO are three securities that offer diversified exposure to junior gold stocks. The relevant daily charts are displayed below.
GDXJ provides exposure to the larger and more liquid junior gold stocks, many of which are in production and some of which could more aptly be defined as mid-tiers than juniors. Furthermore, GDXJ is, itself, very liquid.
GLDX provides exposure to exploration-stage junior gold stocks, which tend to have relatively small market caps. Although it trades with reasonable liquidity, it is nowhere near as liquid as GDXJ. Large traders looking for a single-security play on junior gold stocks should therefore choose GDXJ over GLDX, but either of these sector plays would be OK for small traders. For small traders, the choice would come down to whether the desired exposure was to exploration-stage juniors (GLDX) or production-stage juniors (GDXJ).
PNP.TO provides diversified exposure to very small-scale companies in the resource sector, with an emphasis at this time on gold-mining companies. It is less liquid than GLDX and has a much more costly management structure than either GDXJ or GLDX, but as a short-term or a long-term trading vehicle it offers the advantage of sometimes being priced a great distance from its net asset value (GLDX and GDXJ always trade near their net asset values). Currently, for example, PNP.TO is trading at less than half its net asset value.
PNP will probably outperform GLDX and GDXJ during the next multi-month rally in the juniors, the reason being that PNP will benefit from both an increase in junior stock prices and a reduction in its discount to net asset value. However, it is the riskiest of the three plays.
GLDX short-term trading position
Our latest attempt to trade GLDX hasn't worked, in that the ETF has lost about 10% since being added to the TSI List on 26th March. We aren't prepared to give this trade any more rope and have therefore removed it from the List. It will go into the books as a loss of 10.2% based on Friday's closing price of US$9.02 and our starting price of US$10.04.
We will be looking for an opportunity to establish a new trading position in either GLDX or GDXJ.
Chart Sources
Charts appearing in today's commentary
are courtesy of:
http://stockcharts.com/index.html
http://bigcharts.marketwatch.com/

|
