![]()
![]()
![]()
![]()
-- Weekly Market Update for the Week Commencing 23rd April 2018
Big Picture
View
Here is a summary of our big picture
view of the markets. Note that our short-term views may differ from our
big picture view.
The BULL market in US Treasury Bonds that began in the early 1980s ended in mid-2016, but there will be many years of topping action in bond prices and bottoming action in bond yields before major new trends get underway. A major decline in government bond prices will unfold during the 2020s. (Last update: 11 September 2017)
The stock market, as represented by the S&P500 Index, commenced a secular BEAR market during the first quarter of 2000, where "secular bear market" is defined as a long-term downward trend in valuations (P/E ratios, etc.), gold-denominated prices and inflation-adjusted prices. This secular trend will bottom in 2020 or later. (Last update: 11 September 2017)
A cyclical BEAR market in the US Dollar began in 2016-2017. (Last update: 11 September 2017)
Gold commenced a secular bull market relative to all fiat currencies, the CRB Index, bonds and most stock market indices during 1999-2001. This secular trend will peak in 2020 or later. (Last update: 11 September 2017)
Commodities,
as represented by the CRB Index, commenced a
secular BULL market in 2001 in nominal dollar terms. The first major
upward leg in this bull market ended during the first half of 2008, but
a long-term peak won't occur until 2020 or later.
(Last
update: 11 September 2017)
Copyright
Reminder
The commentaries that appear at TSI
may not be distributed, in full or in part, without our written permission.
In particular, please note that the posting of extracts from TSI commentaries
at other web sites or providing links to TSI commentaries at other web
sites (for example, at discussion boards) without our written permission
is prohibited.
We reserve the right to immediately
terminate the subscription of any TSI subscriber who distributes the TSI
commentaries without our written permission.
True
Fundamentals Summary
[Notes:
1) The date shown next to the current True Fundamentals Model (TFM) signal is
when the most recent change occurred. 2) Charts of the Gold and Equity
TFMs are included in the "Charts and Indicators" section of the TSI web
site]
| Market | True Fundamentals Model (TFM) |
| Gold (US$ Price) | Bearish (12 Jan 2018) |
| US Equity (SPX) | Neutral (20 Apr 2018) |
| Currency (Dollar Index) | Neutral (20 Apr 2018) |
| Commodities (GNX) | Neutral (20 Apr 2018) |
Last week's posts at the TSI Blog
Bull market correction or bear market?
A dramatic upward reversal in US monetary inflation
Summary of current
thinking/positioning
1) A number of markets are set
up for trend reversals or accelerations, with the US$ being the linchpin.
If the DX breaks out to the downside from its recent narrow range, rallies
should begin or accelerate across the commodity world with silver bullion
and gold-mining stocks leading the way higher. However, if the DX breaks
out to the upside from its recent range then the commodity world will be
pressured downward for at least a few weeks thereafter.
2) The SPX
is about to either end its correction or escalate the significance of the
January-2018 top by breaking to a new low for the year. The former outcome
is the more likely, but mainly due to rising interest rates there remains
the threat of a trend-ending plunge to a new low for the year.
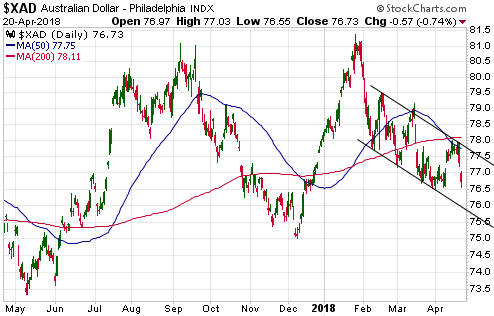
3)
The multi-year upward trend in commodity prices that got underway in
early-2016 appears to have resumed. If so, the Australian and Canadian
dollars should be relatively strong over the next few months.
4) We
expect the next downward leg in the bond bear market to begin within the
next few weeks, but due to the huge speculative net-short position in
10-year T-Note futures we aren't yet interested in placing a new bearish
bet.
5) Holding a cash reserve of around 30%.
The burgeoning
economic war between governments
The US government has threatened
to implement tariffs on $150B of imported goods from China. It isn't yet
known what the final tariff tally will be and which products will be
affected, because there will be a great deal of lobbying between now and
when the threats are transformed into actions. China's government, of
course, has threatened to retaliate. The full details of the Chinese
retaliation also aren't yet known, but US companies that are heavily
reliant on doing business in China should be worried. The war recently
moved beyond tariffs, though, when the US government fired a shot against
Russia by imposing sanctions on a number of Russian oligarchs and major
Russian commodity-producing companies. This led to rapid rises in the
prices of aluminium and nickel. Then, over the past week, there was
another development in the expanding economic war, with the US government
firing potentially the most important shot to date.
Potentially the
most important shot to date is the US ban on sales of American components
to ZTE Corp, a large Chinese manufacturer of telecommunications equipment.
The ban was put in place because ZTE broke a 2017 settlement agreement
relating to the sale of equipment to off-limit countries such as Iran.
Regardless of whether or not ZTE's actions justified severe
punishment, the US government has inserted itself between international
trading partners in a way that not only could destroy a large Chinese
company, but also could have negative effects on many US companies and the
overall US economy. In the short-term the negative effects will be limited
to the US companies that were suppliers to ZTE (e.g. Qualcomm) and the US
companies that end up getting targeted for punishment by China's
government in retaliation for the heavy-handed treatment of ZTE, but there
is a much bigger issue here. The bigger issue is that the US government
has, in effect, just made the following announcement to the world: "If at
all possible, do not put yourself in the position where you are reliant on
US technology".
Many governments and corporations around the world
will take notice. Moreover, the US government's ban on the sale of US-made
components to ZTE has been a propaganda victory for Xi Jinping, China's
dictator. Xi has warned for years that it was dangerous to depend on
technology purchased from the US, and he has just been proved right. This
will give additional impetus to the "Made
In China 2025" program. Refer the article posted
HERE for more information on how the ZTE decision is being portrayed
in China.
Furthermore, the increasing politicisation of
international trade and the retaliations of other governments to the
actions of the US government will make US corporations more wary about
relying on foreign suppliers, especially foreign suppliers of critical
commodities. In an effort to avoid a politically-motivated supply
disruption it is therefore conceivable that in the future US manufacturers
and utilities will be willing to pay substantially higher prices for
locally-sourced commodities and will encourage local supply by making
investments in US-based commodity producers.
In summary,
economically-important parts of the world are being forced to turn inward.
The economies of all countries will be hurt by this war, with
consumers taking the brunt of the punishment. Economic progress will be
slowed, many consumer goods will become more expensive and living
standards will be lowered. However, there will be winners. For example,
gold and gold-mining shares are potential winners from declining
confidence associated with the economic war, and some industrial-commodity
producers will be able to sell at higher prices due to being 'local'.
Also, there will be winners from specific policy missteps, such as the
aluminium and nickel producers that benefited from the Russia sanctions
and the phone makers that will benefit from the destruction of ZTE's
business.
Oil & Gas
Oil versus oil stocks
Last week the oil price made a small gain, thus solidifying the break
to a new 3-year high that happened during the preceding week. Speculative
sentiment remains riskily stretched into optimistic territory, but the
physical supply-demand situation remains bullish. So, there was no change
of significance in the oil market last week.
Today we'll take a
look at how oil equities trade relative to the commodity, using XLE (the
Energy Select Sector SPDR ETF) and XOP (the SPDR S&P Oil and Gas E&P ETF)
as proxies for oil equities.
Displayed below are charts that
compare the oil price with the XLE/oil ratio and the XOP/oil ratio. These
charts show that there is a strong INVERSE correlation between the price
of oil and the performances of oil stocks relative to oil. Putting it
another way, the charts show that there is a strong tendency for oil
stocks to rise by less than the spot price of oil when the oil price is in
an upward trend and to fall by less than the spot price of oil when the
oil price is in a downward trend.
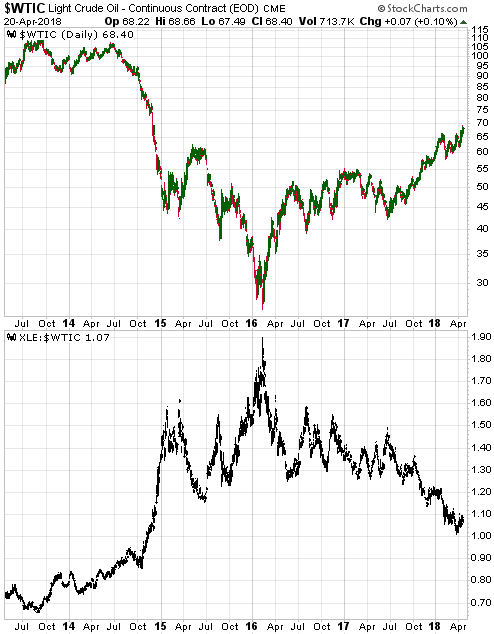
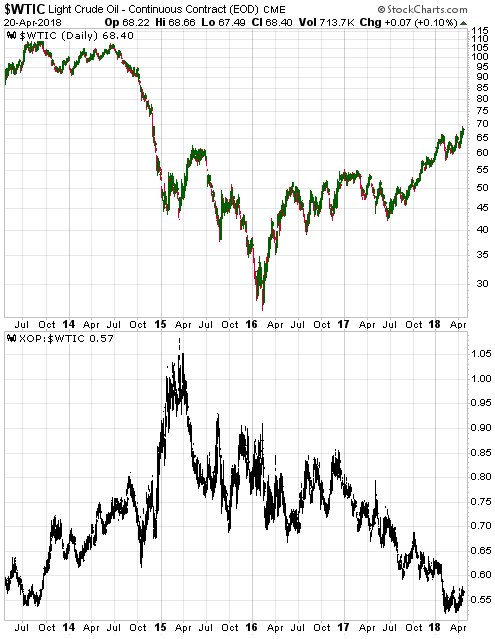
Oil stocks are generally the opposite of leveraged plays on the oil
price because most oil producers do not sell most of their oil in the spot
market. Instead, they make extensive use of hedging, so that in a rising
oil-price environment they typically will be delivering the bulk of their
production into contracts that were entered into at lower prices and in a
falling oil-price environment they typically will be delivering most of
their production into contracts that were entered into at higher prices.
Also of significance is that when oil fundamentals are bullish the spot
oil price will tend to be high relative to prices for delivery in 1-2
years' time, which means that new hedging will be undertaken at prices
that do not fully reflect the rise in the spot price. The opposite occurs
when oil fundamentals are bearish.
This doesn't mean that you
shouldn't buy oil stocks if you are bullish on oil. The reality is that
unless you have a large oil-storage facility and the financial ability to
fill the facility, it will be difficult for you to purchase an investment
that tracks or leverages changes in the spot price of oil. You will have
to make do with oil futures or ETFs that hold oil futures contracts or the
stocks of companies that deliver oil into futures contracts. An
alternative would be to buy the stocks of companies that are focused on
oil exploration, but these stocks will tend to be driven as much or more
by exploration results than by changes in the oil price.
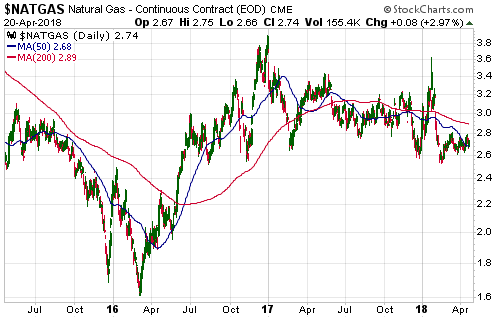
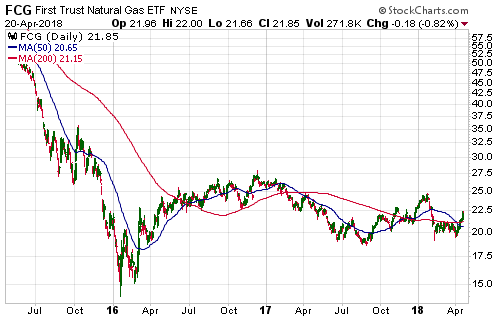
The natgas market is overdue for a rally
The oil-price
strength of the past 8 months has done nothing for the natural gas (NG)
market. As illustrated by the following chart, the NG price has been
working its way downward in 'choppy' fashion since the end of 2016. It
made a new 12-month low in February-2018 and remains close to its 12-month
low.
The relatively low NG price has affected supply in a predictable way
(supply has reduced). This is evidenced by the next chart, which shows
that the amount of NG in below-ground storage in the US is 26% below the
5-year average for this time of the year and 38% below the year-ago level.
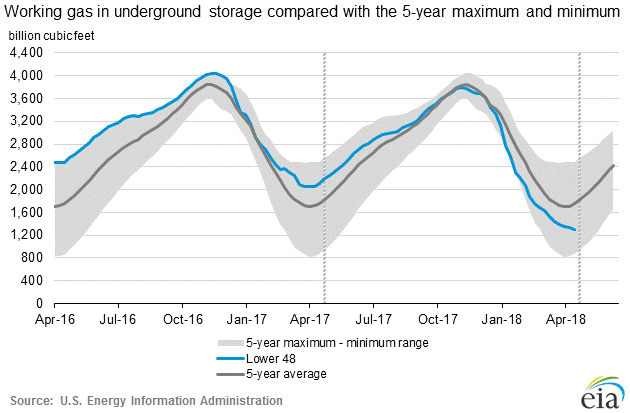
It's likely that a significant price increase will be required to
encourage producers to boost NG supply. At the same time, the market is
now acutely vulnerable to a positive shift in demand.
The upshot is
that there's a good chance of a tradable rally in the NG price over the
coming few months.
One of the simplest and safest ways to
participate in the rally would be by purchasing shares of the
First Trust Natural Gas ETF (FCG), a chart of which is displayed
below. This ETF has languished along with the NG market since late-2016
but is beginning to show signs of life.
A higher-risk/higher-reward
alternative to FCG would be a beaten-down junior producer such as Petrus
Resources (PRQ.TO).
The Stock Market
Sentiment, the yield
curve and credit spreads
Here's how we concluded a
post at the TSI blog early last week:
"While sentiment was
consistent with a major top and valuations, on average, were definitely
high enough to usher in a major top, an end to the long-term upward trend
was not signaled by several important indicators. For example, there would
normally be a pronounced widening of credit spreads at or before a bull
market top, but credit spreads remain near their narrowest levels of the
past 10 years. For another example, there is likely to be a reversal in
the yield curve from flattening to steepening at or prior to a bull market
top, but at the end of last week the US yield curve was at its 'flattest'
in more than 10 years. For a third example, there has been more strength
in market internals over the past two months than there normally would be
if we were dealing with the early stage of a bear market.
So,
despite the rampant optimism evident in January-2018, the decline that
followed the January peak probably will turn out to be a bull-market
correction."
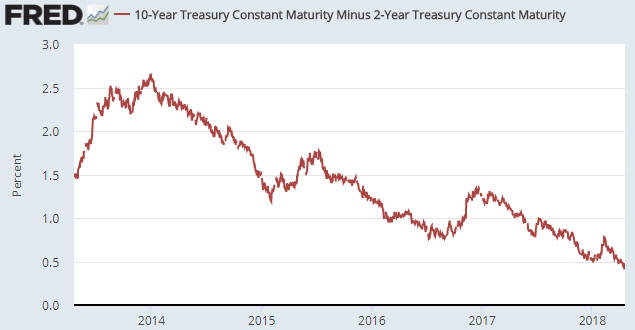
The blog post referred to the absence of
reversals in the yield curve and credit spreads, but didn't provide any
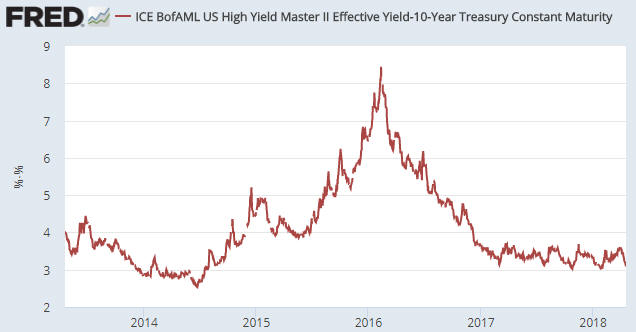
evidence. The relevant evidence is in the following two charts.
The
first chart shows that the 10yr-2yr yield spread, a proxy for the US yield
curve, has been in a major downward (flattening) trend since early-2014.
This yield spread hit its lowest level in more than 10 years last Tuesday.
The second chart shows the spread between an index of non-investment grade
publicly-issued corporate debt yields and the 10-year T-Note yield -- a
proxy for US credit spreads. This spread did not widen to a significant
degree during the January-March stock market turmoil and has since
returned to near its narrowest level in many years.
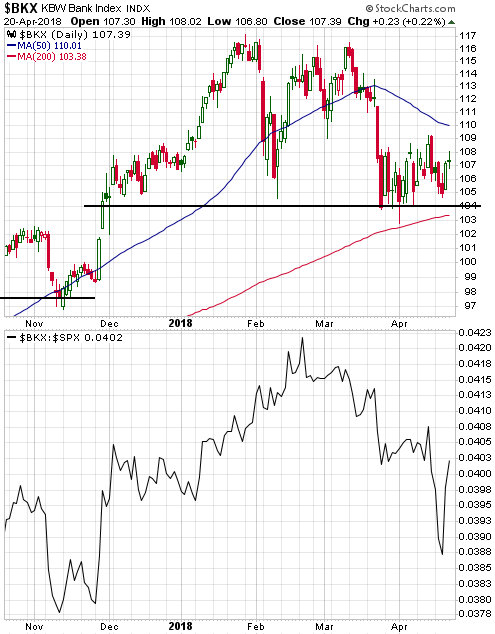
Current Market Situation
In last week's
Interim Update we mentioned the sudden and pronounced relative weakness in
the banking sector as indicated by a plunge, over the first three days of
the week, in the BKX/SPX ratio. We went on to write:
"We can't
come up with a good explanation for the sudden bout of relative weakness
in the banking sector. It could be argued that the demand for bank stocks
is declining due to a rise in the banking industry's interest expense
relative to its interest income, but the contraction of bank interest
margins is not a new development and therefore cannot be the main reason.
Also, the valuations of most US bank stocks are low relative to the
S&P500's valuation, so the problem isn't that bank stocks are too richly
priced.
Before we dive more deeply into this issue we want to see
if the relative weakness persists. If it does it will have implications
for other markets, most notably the gold market."
We were
right to wait to see if the relative weakness persisted before delving
deeper into the possible causes, because all the ground lost by the
BKX/SPX ratio during the first three days of last week was recouped during
the final two days of the week. In fact, over the course of the week the
ratio made a small gain.
Here's a chart showing the current
situation. The BKX is still precariously positioned slightly above a vital
support level, but its relative performance over the final two days of the
week was very good.
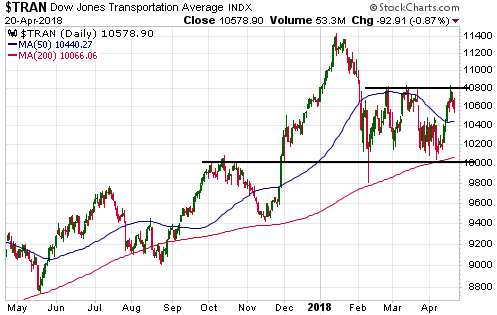
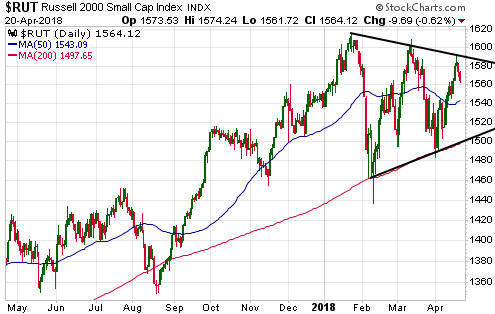
With the notable exception of the Bank Index, the important US stock
indices pulled back over the final two days of last week. In the cases of
the Dow Transportation Average (TRAN) and the Russell2000 SmallCap Index
(RUT), the pullbacks followed tests of resistance. As illustrated by the
following daily charts, TRAN has resistance at 10800 and RUT has
resistance at 1590. Getting above these resistance levels would project
new all-time highs within the ensuing month.
We ended the stock market section of last week's Interim Update by
noting:
"The biggest short-term threat facing the stock market
now is the same as the biggest threat that has faced it since the
beginning of the year: higher interest rates. The stock market has become
accustomed to a 10-year bond yield in the 2.80%-3.00% range, but it's
likely that at some point over the coming three months the 10-year yield
will move well above 3.00%. When it does it should usher in the next bout
of extreme stock-market volatility."
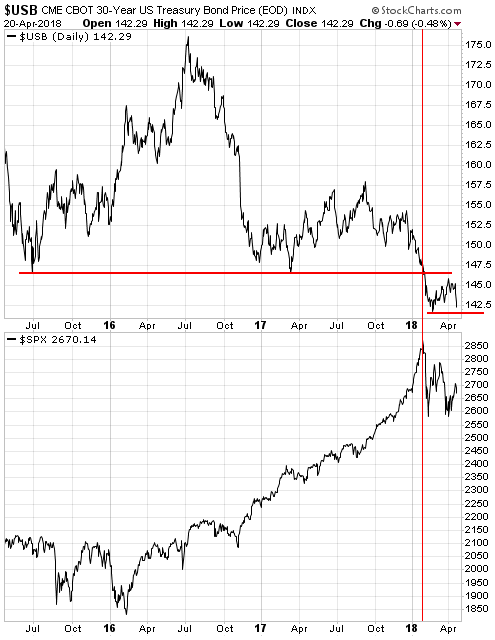
Interest rates moved
higher over the final two days of last week and the 10-year yield is now
perilously close to 3.0%. Just as importantly, the 30-year T-Bond price is
not far from its February low.
The following chart compares the
T-Bond price with the SPX. This chart shows that the sharp
January-February decline in the stock market came on the heels of a
downside breakout in the T-Bond. Stabilisation of the T-Bond then helped
the stock market to stabilise.
We expect that when the resumption
of the T-Bond's long-term bearish trend is signaled by a breach of the
February low (around 141.5), selling pressure will ramp up in the stock
market and the SPX will begin a decline to a new low for the year. Given
its position at the end of last week there is a risk that the T-Bond will
break below support as soon as this week. However, the odds favour a
T-Bond rebound over the coming few weeks.
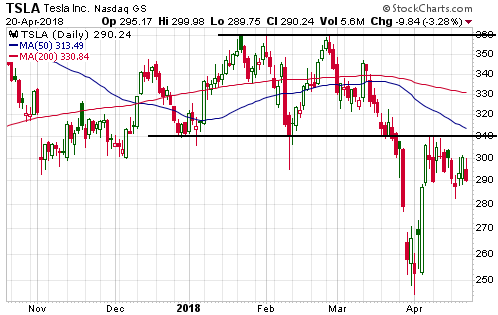
Tesla (TSLA) Update
The TSLA price made a
short-term bottom in the $240s at the beginning of April and then, within
the space of only 4 days, rocketed back to former support (now resistance)
at $310. It has since consolidated in the $290-$310 range.
It's
possible that TSLA's rebound is over and that a decline to a new 12-month
low has begun, but it's also possible that the rebound will continue.
We don't understand why so many analysts and investors remain
steadfastly bullish on TSLA. After all, it's not like the numerous large
risks facing this company have been fully discounted by the stock market,
thus creating a situation where the high risk is more than offset by the
potential reward. The stock is being valued as if the company were about
to become enormously profitable, whereas the main question is: how long
will it be before the company's creditors 'pull the plug'?
The
stubborn optimism about Tesla's prospects makes it possible for the
company's carnival-barker-like CEO to periodically whip-up enthusiasm for
the stock. Anyone betting against this stock should keep this in mind and
manage risk accordingly. Our suggestion has been (and still is) to limit
the loss on a bearish speculation by exiting if the share price achieves
consecutive daily closes above $310.
On a related matter, recall
that a TSLA April-2018 put option was removed from the TSI List at a large
profit in late March. Our exit price of around $13 was far from ideal
given that the options traded above $20 at the beginning of April, but
note that these options expired worthless last Friday. Consequently, if
the options had been held for an additional 3 weeks then a 370% profit
would have turned into a 100% loss. On the other hand, IF the stock's
sharp decline had continued for 2-3 more weeks, which it could well have
done, then the same options potentially could have been exited for a
2,000% profit.
The above paragraph highlights the risks and
opportunities associated with options trading. In a fast-moving market,
exiting an option position a little early can result in a lot of money
being left on the table, but exiting a position a little late can result
in a very negative outcome.
One way to balance the risks and
opportunities is to scale out of a long option position as its price
rapidly rises.
This week's
significant US economic events
[Notes:
1) The most important events
(to the markets) are shown
in bold. 2) A list of global economic events can be found
HERE]
| Date | Description |
| Monday Apr-23 | Existing Home Sales |
| Tuesday Apr-24 |
Case-Shiller Home Price Index New Home Sales Consumer Confidence |
| Wednesday Apr-25 | No important events scheduled |
| Thursday Apr-26 | Durable Goods Orders |
| Friday Apr-27 |
Q1-2018 GDP (prelim
estimate) Employment Cost Index Chicago PMI Consumer Sentiment |
Gold and the Dollar
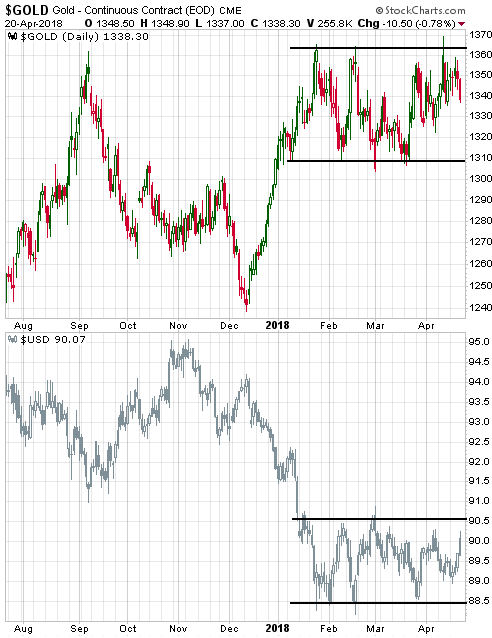
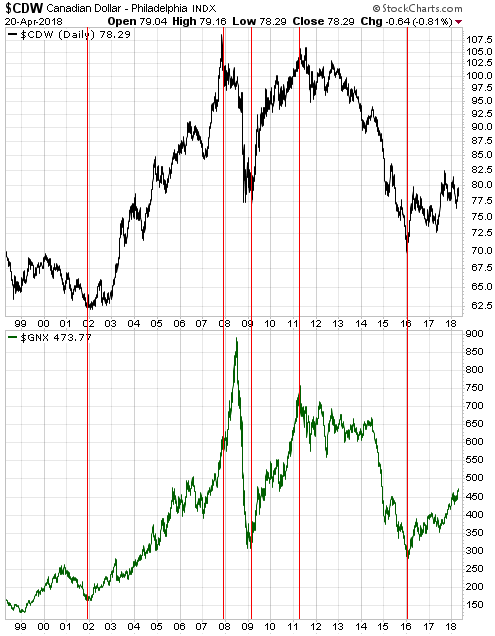
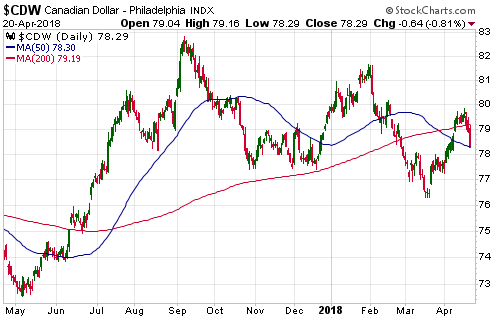
A final point is that there has been an important early-May turning
point for the C$ during each of the past three years. There were highs in
early-May of 2015 and 2016 and a low in early-May of 2017. This is not
what we currently expect to happen, but if the C$ were to fall by enough
within the next two weeks to test or breach its March-2018 low it probably
would mean that we were getting another important early-May turning point
(in this case, from down to up).
Updates
on Stock Selections
Notes: 1) To review the complete list of current TSI stock selections, logon at
http://www.speculative-investor.com/new/market_logon.asp
and then click on "Stock Selections" in the menu. When at the Stock
Selections page, click on a stock's symbol to bring-up an archive of
our comments on the stock in question. 2) The Small Stock Watch List is
located at http://www.speculative-investor.com/new/smallstockwatch.html
![]() Company
news/developments for the week ending Friday 20th April 2018:
Company
news/developments for the week ending Friday 20th April 2018:
[Note: AISC = All-In Sustaining Cost, FS = Feasibility Study, FY =
Financial Year, IRR = Internal Rate of Return, ISR = In-Situ Recovery,
MD&A = Management Discussion and Analysis, M&I = Measured and Indicated,
NAV = Net Asset Value, NPV(X%) = Net Present Value using a discount rate
of X%, NSR = Net Smelter Return, P&P = Proven and Probable, PEA =
Preliminary Economic Assessment, PFS = Pre-Feasibility Study]
*Alio Gold (ALO) reported Q1 gold production of 17.6K
ounces. This news actually came out on 11th April but accidentally was
omitted from last week's TSI commentary.
Q1 guidance was 18K-20K
ounces, so the result was below plan. However, the company has maintained
its overall 2018 production guidance of 90K-100K ounces.
*Blackham
Resources (BLK.AX) published its quarterly report for the
March-2018 quarter. Most of the important information contained in this
report had been provided in earlier press releases.
The company
produced 20.6K ounces of gold at an AISC of A$1092/oz during the March
quarter and has maintained its guidance for the first half of this
calendar year at 40K-45K ounces at an AISC of A$1100-$1200. Considering
that sustaining capital expenditure should be lower during the June
quarter than during the March quarter, we expect that the actual AISC for
the half year will be well below the bottom of the aforementioned guidance
range.
There are historical tailings at BLK's Wiluna project that
are estimated at 37M tonnes averaging 0.71-g/t gold. This implies a gold
resource of about 800K ounces. Metallurgical testwork carried out to date
indicates gold recovery of 45%-50%, which suggests the potential for BLK
to add 350K-400K ounces of relatively low-cost production to its overall
mine plan.
The tailings opportunity (called "Wiltails") will have
to be confirmed by drilling, additional metallurgical testing and economic
studies, but it could give the per-share value a significant boost.
*Continental Gold (CNL.TO) reported a new
batch of results from its 2018 drilling program. The best intercepts were
0.55m of 606-g/t gold and 1.95m of 110-g/t gold. These intercepts have
potentially identified new shoots of very high-grade gold on two different
veins within part of the M&I resource envelope.
*Energold
Drilling (EGD.V) published its 2017 annual financial results.
Revenue for the year was about C$10M higher than the preceding year.
This is clear-cut evidence that EGD's drilling business has turned the
corner, but unfortunately the higher revenue did not translate into a
better overall financial performance.
EGD's balance sheet remains
strong, with adjusted working capital (current assets minus current
liabilities and long-term debt) of C$36M. However, this is down by C$9M
from the end of the preceding quarter, so the company has continued to
bleed cash despite the increasing demand for its services.
The
adjusted working capital equates to about C$0.65/share, which suggests
that EGD is cheap near its current share price of C$0.41. It must convert
its growing revenue into free cash-flow, though, for there to be a large
and sustained increase in its stock price.
*Premier
Gold (PG.TO) reported a good overall production result for the
March quarter, with lower-than-planned production at the company's
100%-owned Mercedes gold mine in Mexico being more than offset by
well-above-plan production at the 40%-owned South Arturo gold mine in
Nevada. Total production for the quarter was 30.5K ounces.
This
puts PG on track to exceed its 2018 gold production guidance of 85K-95K
ounces.
![]() List
of candidates for new buying
List
of candidates for new buying
From within the ranks of TSI
stock selections the best candidates for new buying at this time, listed
in alphabetical order, are:
1) ALK.AX (last Friday's closing price:
A$0.28)
2) AOI.TO (last Friday's closing price: C$1.24)
3)
EGD.V (last Friday's closing price: C$0.41)
4) PG.TO (last Friday's
closing price: C$2.64)
5) PRQ.TO (last Friday's closing price:
C$1.24)
The above list is limited to five stocks. It will sometimes
contain less than five, but it will never contain more than five
regardless of how many stocks are attractively priced for new buying.
Chart Sources
Charts appearing in today's commentary
are courtesy of:
http://stockcharts.com/index.html
http://research.stlouisfed.org/