|
-- Weekly Market Update for the Week Commencing 23rd June 2008
Big Picture
View
Here is a summary of our big picture
view of the markets. Note that our short-term views may differ from our
big picture view.
Bonds commenced a secular BEAR market in
June of 2003. (Last
update: 22 August 2005)
The stock market, as represented by the S&P500 Index, commenced
a secular BEAR market during the first quarter of 2000, where "secular
bear market" is defined as a long-term downward trend in valuations
(P/E ratios, etc.) and gold-denominated prices. This secular trend will bottom sometime between 2014 and 2020. (Last update: 22 October 2007)
The Dollar commenced a secular BEAR market during the final quarter of 2000. The
first major downward leg in this bear market ended during the first
quarter of 2005, but a long-term bottom won't occur until 2008-2010. (Last update: 28 March 2005)
Gold commenced a
secular bull market relative to all fiat currencies, the CRB Index,
bonds and most stock market indices during 1999-2001. This secular trend will peak sometime between 2014 and 2020. (Last update: 22 October 2007)
Commodities, as
represented
by the CRB Index, commenced a secular BULL market in 2001. The first
major upward leg in this bull market ended during the second quarter of
2006, but a long-term
peak won't occur until at least 2008-2010. (Last update: 08 January 2007)
Copyright
Reminder
The commentaries that appear at TSI
may not be distributed, in full or in part, without our written permission.
In particular, please note that the posting of extracts from TSI commentaries
at other web sites or providing links to TSI commentaries at other web
sites (for example, at discussion boards) without our written permission
is prohibited.
We reserve the right to immediately
terminate the subscription of any TSI subscriber who distributes the TSI
commentaries without our written permission.
Outlook Summary
Market
|
Short-Term
(0-3 month)
|
Intermediate-Term
(3-12 month)
|
Long-Term
(1-5 Year)
|
Gold
|
Neutral
(02-Jun-08)
|
Bullish
(12-May-08)
|
Bullish
|
US$ (Dollar Index)
|
Bullish
(16-Jun-08)
| Bullish
(31-May-04)
|
Neutral
(19-Sep-07)
|
Bonds (US T-Bond)
|
Neutral
(03-Mar-08)
|
Neutral
(19-May-08)
|
Bearish
|
Stock Market (S&P500)
|
Neutral
(02-Jun-08)
|
Bearish
(12-May-08)
|
Bearish
|
Gold Stocks (HUI)
|
Neutral
(02-Jun-08)
|
Bullish
(12-May-08)
|
Bullish
|
| Oil | Neutral
(09-Jun-08)
| Bearish
(22-Oct-07)
| Bullish
|
Industrial Metals (GYX)
| Neutral
(18-Jun-08)
| Bearish
(09-Jul-07)
| Bullish
|
Notes:
1. In those cases where we have been able to identify the commentary in
which the most recent outlook change occurred we've put the date of the
commentary below the current outlook.
2. "Neutral", in the above table, means that we either don't have a
firm opinion or that we think risk and reward are roughly in balance with respect to the timeframe in question.
3. Long-term views are determined almost completely by fundamentals,
intermediate-term views by giving an approximately equal weighting to
fundmental and technical factors, and short-term views almost
completely by technicals.
Newsletters
We hope that nobody expects
TSI to be a 'one-stop shop' for all their investing/trading needs. For
the $120/year ($2.30/week) that we charge it's not reasonable to expect
us to provide coverage of everything, but even if we charged several
thousand dollars per year, as some newsletters do, we still couldn't
provide a service that fulfilled all needs.
In one respect, newsletter subscriptions are like stocks: you shouldn't
put all of your eggs in one basket, but neither should you spread your
eggs across a few dozen baskets. There is an optimum number of stocks
to have in a portfolio, because: a) an investor should have a good
understanding of the story behind each stock that he/she owns, so one
limitation is the quantity of stocks that an investor is capable of
understanding and closely following, b) the number of stocks should be
large enough that a major problem with any single stock won't create a
major problem for the overall portfolio, and c) the number of stocks
should be small enough that a major success with a single stock will
have a significant impact on the overall portfolio. This optimum number
of stocks will vary depending on an investor's expertise and resources,
but we suspect that for the average part-time non-professional investor
the right number would be around 10, and certainly not more than 15.
In our opinion, when it comes to newsletter subscriptions the right
number for the average part-time non-professional investor would be
around 5, and certainly not more than 10. Different newsletters have
different strengths and weaknesses (they all have some weaknesses) that
should be taken into account during the selection process, but with
5-10 newsletter subscriptions an investor should be able to cover the
bases that are most relevant to him/her. On the other hand, someone who
subscribes to more than 10 services will probably end up with such a
large amount of information, some of which will be conflicting, that
the decision-making process will be made more difficult and prone to
error. It has been demonstrated that once a certain information
threshold is reached, getting more information becomes
counter-productive. Furthermore, the information threshold is much
lower than most people think.
By the way, when cutting back on your financial information intake the
first thing you should consider doing is reduce the amount of time
spent reading, viewing and/or listening to the mainstream financial
news media. When you read newspapers or watch financial-news television
you may feel like you are becoming better informed, but in reality you
will usually be wasting your time. In general, the only value provided
to the investor or trader by mainstream news services, be they in print
form or some other form, is in assessing sentiment.
By selecting the right (relatively small) group of newsletters you
should be able to obtain plenty of useful information in an efficient
manner, but it's important to understand that even the best newsletters
will never be anything more than resources for ideas. You can't
reasonably expect to achieve excellent long-term returns by blindly
following any newsletter; rather, it will always be totally up to you
to take into account your own situation and to manage your own risk
when deciding which ideas to act upon and the extent to which you act.
When going through the newsletter-selection process something to
consider is whether a newsletter gives you ideas that you would never
have come up with on your own and/or makes you see things in a
different light. We get the impression that many people gravitate
towards newsletters that reinforce their existing opinions, but a
newsletter is of little value if it only tells you what you already
THINK you know. For example, if you are absolutely convinced that the
gold price is headed to the moon then the last thing you need is a
newsletter that is forever bullish on gold.
With regard to specific newsletter suggestions, most of the ones we
read and find useful are listed under "Newsletters and Market Advice"
at http://www.speculative-investor.com/new/link.html.
Working off the excesses
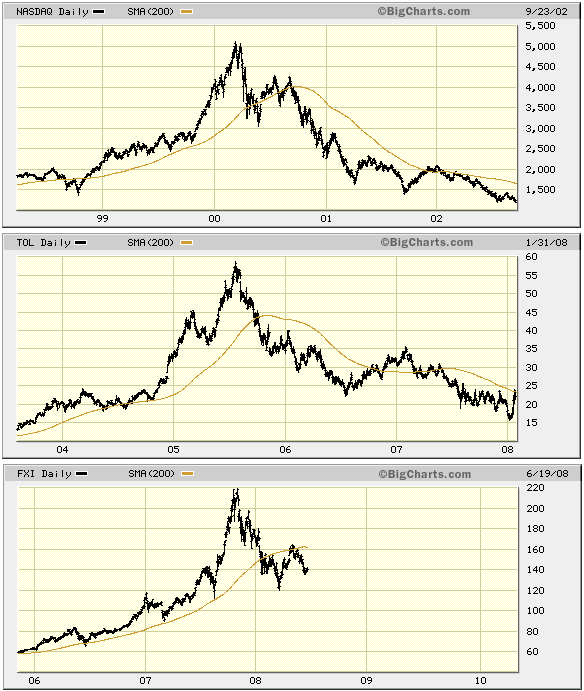
Regardless of whether or not a huge run-up in price over a year or more
constitutes a bubble, such run-ups are usually followed by bear
markets, or periods of convalescence, lasting 1-3 years. The following
set of charts shows two completed examples and one in-progress example
of what we are talking about. The completed examples are the NASDAQ
Composite Index, which peaked in March of 2000 and bottomed about 2.5
years later, and the homebuilding sector of the US stock market
(represented on our chart by Toll Brothers (NYSE: TOL)), which peaked
in July-August of 2005 and appears to have bottomed early this year.
The in-progress example is China's stock market (represented on our
chart by FXI), which peaked in October-November of last year.
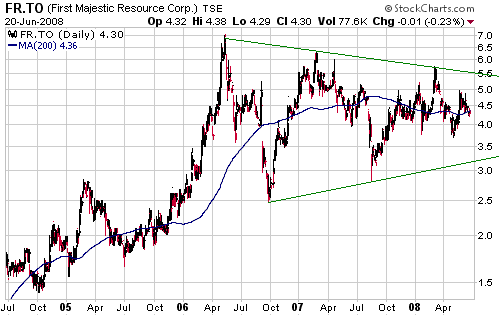
We don't think FR was close to being in 'bubble territory' when it
peaked in May of 2006, but the spectacular run-up to the peak set the
scene for a very lengthy correction. While FR's stock price has been
consolidating within a large contracting triangle over the past two
years the company has been steadily increasing its production and
in-ground resources, so much so that there is a lot more real value
underlying an FR share today than there was at the May-2006 peak even
though the stock price is now more than 30% lower. The correction could
last a few more months, but the price pattern and the value accretion
have put the foundations in place for the next major rally.
Currently, the oil market and the coal and fertiliser sectors of the
stock market are likely in the late stages of price run-ups that will
be followed by bear markets or very lengthy corrections.
Bond Market Update
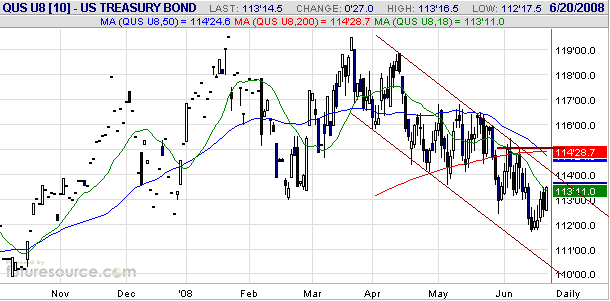
The following daily
chart shows that T-Bond futures have had a downward bias since mid
January and have been trending lower within a well-defined channel
since mid March. There isn't yet any chart-related evidence of a
bottom, but the Commitments of Traders (COT) data have become decidedly
bullish.
There is currently upward pressure on the T-Bond price (downward
pressure on the T-Bond yield) due to the credit crisis, the stock
market downturn and the economic slowdown, and downward pressure due to
the inflation fears spawned by the gains in the prices of oil and some
other commodities. The perceived inflation threat will probably
outweigh the positive factors until evidence emerges that the oil
market's upward trend has come to an end.
With the sentiment backdrop now clearly supportive of bonds it will be
time to turn short-term bullish on this market as soon as resistance at
115 (basis the September T-Bond futures) is overcome or the oil price
confirms a reversal of its trend by closing below $120.
The Stock
Market
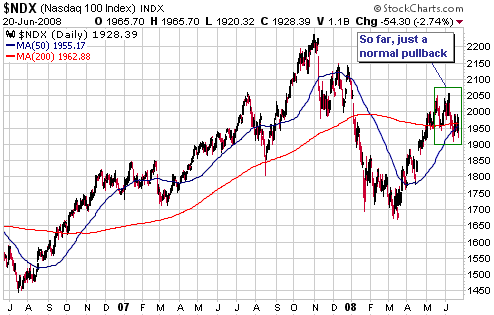
As evidenced by the following
charts, the Dow Industrials Index and the NASDAQ100 Index (NDX) are in
very different positions. Whereas the Dow has given back almost all the
gains achieved since the mid-March collapse of Bear Stearns (the Dow
ended last week within 1% of its March low), the NDX has experienced
only a modest pullback from its recent high. The Dow's relative
weakness is largely due to its exposure to financial companies (the NDX
contains non-financial companies only).
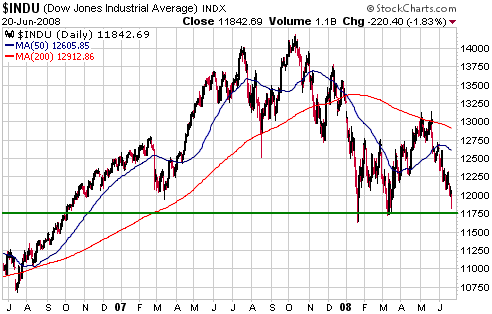
Regardless of whether
or not the Dow breaks to new lows for the year over the coming days,
the US stock market is probably within a week or so of a short-term
bottom. The reason is that sentiment is now very supportive. In
particular, sentiment surveys and put/call ratios, while not yet at the
extremes reached during the first quarter of this year, are now at
levels typically associated with intermediate-term bottoms.
Furthermore, the quantity of shares sold short by the public is higher
now than it was at the March bottom.
The sentiment situation means that a short-term bottom is probably
close in terms of time, although it doesn't necessarily mean that a
bottom is close in terms of price. In other words, there's still
sufficient downside risk to warrant a cautious stance.
This coming week should be very interesting because the Fed will be
issuing its new monetary policy statement with the Dow near critical
support, oil near its all-time high, and the gold price close to an
upside breakout. The high oil price is the biggest short-term problem
facing the stock market, so anything that takes the wind out of the oil
market will probably be taken positively by the stock market. This
means that an interest rate hike at this time will potentially give the
stock market a boost as long as it prompts a rally in the US$ and a
significant decline in the oil price. However, the Fed may not see it
that way. This is a difficult situation for the price fixers at the
Fed, but price fixers always end up in difficult situations so there's
nothing untoward about that.
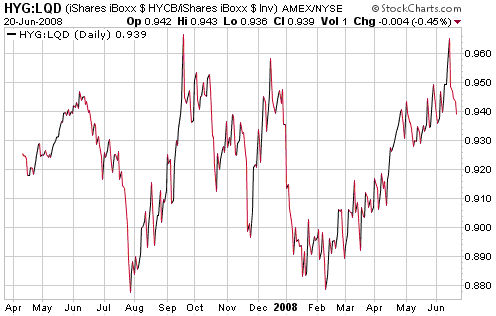
Before leaving the stock market it's worth mentioning that the HYG/LQD
ratio has reversed sharply lower from the vicinity of last year's peak
(refer to the following chart for details). As regular TSI readers
would know, the HYG/LQD ratio is an indicator of what's happening to
credit spreads (with a rising ratio being indicative of narrowing
credit spreads) and tends to reverse direction a few weeks ahead of the
stock market. That HYG/LQD made a new high for the year during the week
before last suggests that the next downward leg in the equity bear
market has not yet begun, but if credit spreads have returned to a
widening trend (as indicated by a downward trend in HYG/LQD) then the
next downward leg will probably begin a few weeks from now.
This week's
important US economic events
| Date |
Description |
Monday Jun 23
| No important events scheduled
|
Tuesday Jun 24
| Consumer Confidence
| | Wednesday Jun 25
| FOMC Policy Statement
Durable Goods Orders
New Home Sales
| | Thursday Jun 26
| Q1 GDP (final)
Existing Home Sales
| | Friday Jun 27
| Personal Income and Spending
|
Gold and
the Dollar
Currency Market Update
Last week the Dollar Index retraced a bit more than half the gains it
had made during the preceding week. It ended last week right at its
20-week moving average, meaning that things are delicately balanced as
we head into a week that includes a Fed monetary policy statement.
According to the Fed Funds Futures market, which is almost always
correct this close to a scheduled interest rate decision, there is
almost no chance of the Fed altering its targeted rate at this week's
meeting. However, we don't agree that a 25 basis-point rate hike is out
of the question. Our view is that Bernanke and Co. may decide to go
with a small hike at this time to demonstrate willingness to back-up
their words with deeds. A 25 basis-point hike would only be a symbolic
gesture because it would constitute a trivial increase in the price of
bank credit, but as far as symbolic gestures go it would be quite
effective. This is especially so because the market is not expecting
it.
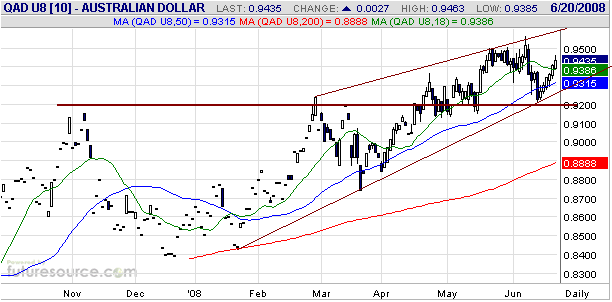
The Australian Dollar remains the one major currency not to show any
real weakness relative to the US$. Even though the A$ won't signal a
top until the September futures contract, a daily chart of which is
displayed herewith, closes below 0.92, we think that a bearish A$
position is now a reasonable speculation. This is because the currency
has risen for six days in succession and is poised just below
resistance at 0.95. Either the US$ is about to resume its rebound,
leading to significant weakness in commodity prices and a catch-up move
to the downside by the A$, or the US dollar's rebound from its March
low is over, in which case the A$ will soon move to new highs for the
year. We think the former outcome is the more likely, but the main
reason we are interested in speculating against the A$ at this time is
that it wouldn't take much additional strength to prove us wrong (a
daily close above 0.95 by the September contract would do it).
FXA put options can
be used to speculate on an A$ decline, although these options are too
thinly traded to be added to the TSI Stocks List.
Gold
Gold vs. Industrial Commodities
Gold trended higher against almost all industrial commodities during
the liquidity contraction that extended from the final quarter of 2000
through to the third quarter of 2003, and then trended lower against
almost all industrial commodities from the final quarter of 2003
through to the third quarter of 2005. Since September of 2005 an
interesting pattern has emerged in that gold's trend relative to
industrial metals has been the opposite of its trend relative to oil.
The situation is illustrated by the following charts of the gold/oil
and gold/GYX ratios (GYX is the Industrial Metals Index).
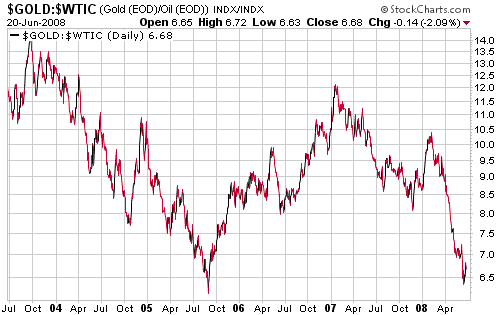
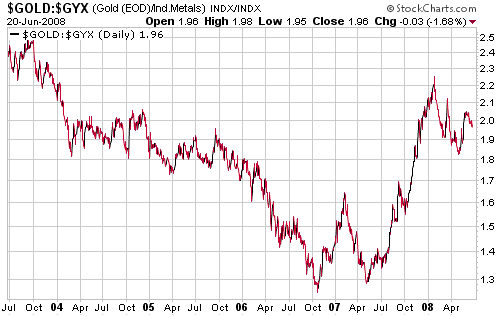
Gold is currently in
an intermediate-term downward trend relative to oil and an
intermediate-term upward trend relative to the industrial metals. The
intermediate-term downward trend in the gold/oil ratio has led to the
increasing popularity of the idea that oil is the new "anti-dollar"
since this trend has occurred alongside a downward trend in the US
dollar's exchange value. We think this idea will prove to be a passing
fad, but in any case it has always been inaccurate to think of gold as
the "anti-dollar". It is more correct to think of gold as the
"anti-fiat-currency" because there will never be a large increase in
the investment demand for gold as long as a high level of confidence is
maintained in at least one of the world's two senior currencies. As
things stand right now there is a general belief in the marketplace
that the ECB will act to maintain the euro's purchasing power, which,
we think, goes a long way towards explaining why gold is presently near
an all-time low relative to oil.
The bottom line is that there will be no good reason for investors to
shift en masse towards the only monetary commodity as long as the euro
is perceived to be a high-quality alternative to the US$.
The current difference between gold's situation relative to oil and its
situation relative to the industrial metals sector probably relates to
the market's perception of supply constraints. Gold is never
supply-constrained in the normal sense of the term in that new mine
supply is always a trivial component of total supply. Furthermore,
commercial consumption of gold is always a trivial component of total
demand. As a result, gold's price is determined almost solely by
changes in investment demand. The oil and industrial metals markets,
however, tend to live from "hand to mouth" in that today's new supply
is needed to satisfy current consumption. Over the past 1-2 years the
general perception has taken root that oil is, and will remain,
severely supply constrained (that its current supply is, and will
remain, barely sufficient to satisfy immediate demand), whereas the
perception has been that the supply of industrial metals is in an
upward trend relative to the demand for these metals.
Even if the oil market remains supply constrained, two things are
likely to happen. First, even the most solidly underpinned long-term
bull markets periodically experience large corrections simply because
the market goes too far towards discounting the bullish case, so a
large oil-price correction will begin in the not-too-distant future.
Second, cracks will begin to appear in the euro's bullish veneer. The
euro is very over-valued relative to the US$, but fundamentally it is
no better than the dollar.
Current Market Situation
The following daily chart shows that August gold ended last week at the
top of its downward-sloping channel, meaning that any additional
strength from here will generate an upside breakout. The AMEX Gold BUGS
Index (HUI) is in a similar position.
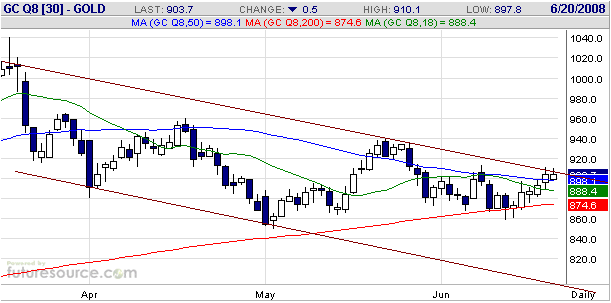
Upside breakouts by
gold and the HUI over the coming days would be 'buyable' signals given
that the bullion and the major gold stocks are not close to being
overbought, but how a speculator reacts to such signals should be
determined by his/her current positioning. As mentioned in previous
commentaries, our own portfolio has close to its maximum planned
exposure to gold stocks in line with our bullish long- and
intermediate-term views. We've also mentioned that shorter-term trading
positions have not yet been established.
We don't intend to add shorter-term trading positions at this time
unless there's a sharp sell-off. In other words, we probably won't take
any action if an upside breakout occurs this week. However, if we did
not already have substantial exposure to the gold sector then we
probably would do some buying in response to a near-term upside
breakout.
Gold Stocks
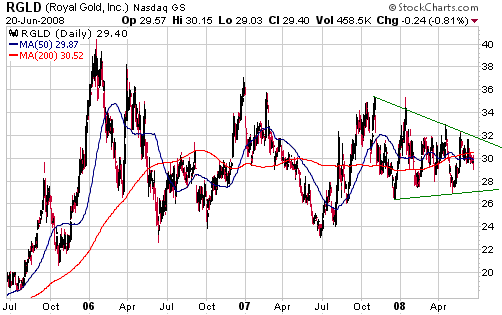
As we've noted in many previous commentaries, over the past couple of
years Royal Gold (RGLD) has been a much better indicator of the overall
gold sector than popular gold-stock indices such as the HUI and the
XAU. The following chart shows that RGLD has been in consolidation
since the first half of 2006. It also shows that within the long-term
triangular consolidation pattern a shorter-term triangular pattern has
been developing since the October of last year.
A daily close above $32 would break RGLD out to the upside from its
shorter-term pattern and suggest that the longer-term pattern was
coming to an end.
Update
on Stock Selections
(Note: To review the complete list of current TSI stock selections, logon at http://www.speculative-investor.com/new/market_logon.asp
and then click on "Stock Selections" in the menu. When at the Stock
Selections page, click on a stock's symbol to bring-up an archive of our comments on the stock in question)
 Fortuna Silver (TSXV: FVI). Shares: 81M issued, 104M fully diluted. Recent price: C$1.92 Fortuna Silver (TSXV: FVI). Shares: 81M issued, 104M fully diluted. Recent price: C$1.92
At current prices FVI is one of the most obvious candidates for new
buying in the world of junior gold/silver stocks. It has a lot of cash
in the bank, a small silver and base metals mining operation in Peru
that generates significant cash flow, and a much larger
exploration-stage silver/gold project in Mexico (the San Jose project).
There should be positive news in the form of a scoping study and an
updated resource estimate from the San Jose project within the next
month or so, although the stock's near-term upside will probably be
limited by the 10M warrants that expire in July (the exercise price of
the warrants is C$2.30, so a move above 2.30 would likely prompt a
substantial amount of selling).
Our view is that the downside risk is limited by support at around
C$1.50 (see chart below). This support might be tested if there's a
steep sector-wide sell-off over the next few weeks, but we wouldn't
rely on being able to take an initial position at such a low level.
Near Friday's closing price of C$1.92 it already has a very attractive
risk/reward ratio.

 Red Hill Energy (TSXV: RH). Shares: 47M issued, 58M fully diluted. Recent price: C$0.62 Red Hill Energy (TSXV: RH). Shares: 47M issued, 58M fully diluted. Recent price: C$0.62
As per the email sent to subscribers on Friday, we have exited Patriot
Coal at a profit of 330%. This means that RH is now our sole exposure
to coal.
RH has over 100 BILLION dollars of in-ground coal and a market
capitalisation of only US$35M, so in a coal bull market it should be a
good performer. As evidenced by the following chart it has, however,
been a lousy performer.
We don't know of anything that RH's management could have done
differently to create a more buoyant market for the stock. The main
problem, we suspect, is that RH's coal is located in Mongolia. The
Mongolian Government has done its utmost over the past year to
discourage foreign investment in the country's mining industry, so much
so that even Ivanhoe Mines (IVN.TO), a Mongolia-focused mining company
led by one of the world's best stock promoters, has seen its stock
price cut in half.
Due to its enormous upside potential we are going to persevere with RH.
It's likely that the investment climate in Mongolia will improve,
simply because if it doesn't there won't be any more investment.
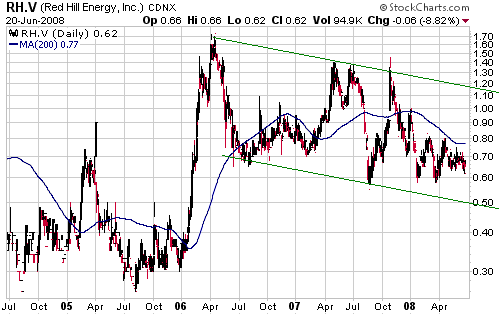
Chart Sources
Charts appearing in today's commentary
are courtesy of:
http://stockcharts.com/index.html
http://www.futuresource.com/
http://bigcharts.marketwatch.com/

|

