


-- Weekly Market Update for the Week Commencing 23rd November 2015
Big Picture
View
Here is a summary of our big picture
view of the markets. Note that our short-term views may differ from our
big picture view.
The BULL market in US Treasury Bonds
that began in the early 1980s ended in early-2015, but there will be many years
of topping action in bond prices and bottoming action in bond yields before
major new trends get underway. (Last update: 29 June 2015)
The stock market, as represented by the S&P500 Index,
commenced
a secular BEAR market during the first quarter of 2000, where "secular
bear market" is defined as a long-term downward trend in valuations
(P/E ratios, etc.) and gold-denominated prices. This secular trend will bottom sometime between 2018 and 2020.
(Last update: 29 June 2015)
A secular BEAR market in the
US
Dollar
began during the final quarter of 2000 and ended in July of 2008. This
secular bear market will be followed by a multi-year period of range
trading.
(Last
update: 09 February 2009)
Gold commenced a
secular bull market relative to all fiat currencies, the CRB Index,
bonds and most stock market indices during 1999-2001.
This secular trend will peak sometime between 2018 and 2020.
(Last update: 29 June 2015)
Commodities,
as represented by the CRB Index, commenced a
secular BULL market in 2001 in nominal dollar terms. The first major
upward leg in this bull market ended during the first half of 2008, but
a long-term peak won't occur until 2018-2020.
(Last
update: 29 June 2015)
Copyright
Reminder
The commentaries that appear at TSI
may not be distributed, in full or in part, without our written permission.
In particular, please note that the posting of extracts from TSI commentaries
at other web sites or providing links to TSI commentaries at other web
sites (for example, at discussion boards) without our written permission
is prohibited.
We reserve the right to immediately
terminate the subscription of any TSI subscriber who distributes the TSI
commentaries without our written permission.
Outlook Summary
Market
|
Short-Term
(1-3 month)
|
Intermediate-Term
(6-18 month)
|
Long-Term
(2-5 Year)
|
|
Gold
|
N/A |
Bullish
(26-Mar-12) |
Bullish
|
|
US$ (Dollar Index)
|
N/A |
Neutral
(22-Jun-15) |
Neutral
(19-Sep-07) |
|
US Treasury Bonds (TLT)
|
N/A |
Bearish
(19-Oct-15)
|
Bearish |
|
Stock Market
(DJW)
|
N/A |
Neutral
(05-Oct-15) |
Bearish
|
|
Gold Stocks
(HUI)
|
N/A |
Bullish
(23-Jun-10) |
Bullish
|
|
Oil |
N/A |
Neutral
(26-Oct-15) |
Bullish
|
|
Industrial Metals
(GYX)
|
N/A |
Neutral
(09-Nov-15) |
Bullish
(28-Apr-14) |
Notes:
1. Our short-term expectations are discussed in the commentaries, but except in
special circumstances we won't attempt to assign a "bullish", "bearish" or
"neutral" label to these expectations.
2. The date shown below the current outlook is when the most recent outlook change occurred.
3. "Neutral" means that we think risk and reward are roughly in balance with respect to the timeframe in question.
4. Long-term views are determined almost completely by fundamentals and intermediate-term views
are determined by a combination of fundamentals, sentiment and technicals.
Last week's posts at the TSI Blog
Replacing "despite" with "because of"
Gold's "commercial" traders are different because gold is different
The US Treasury market
has begun a long downward journey
In the 19th October Weekly
Update we explained why our intermediate-term outlook for long-dated US
government bonds and notes had shifted to "bearish". In summary, due to the
extent to which the prices of these bonds had become stretched to the upside
during the first few months of this year and the subsequent price action, a
downward 'grind' was considered likely over the ensuing 12 months. Furthermore,
an intermediate-term bearish outlook for long-dated US government bonds is
consistent with our view that deflation fears and commodity prices are close to
important turning points.
To confirm our 12-month outlook, the T-Bond and the T-Note will have to break
out to the downside. For the T-Bond, this would involve a weekly close below
147. For the T-Note, this would involve a weekly close below 125.
Here are the relevant charts. Notice that the 10-year T-Note (the second chart)
has been much weaker than the 30-year T-Bond over the past few years and is
closer to an meaningful breakdown. This probably means that the T-Note will
break out to the downside ahead of the T-Bond.
Rumours of an early Fed
rate hike
The Fed's board of governors is
meeting on Monday 23rd November to consider the "discount rate", which is the
overnight interest rate paid by banks that borrow reserves from the Fed. This
has led to a rumour that the Fed will hike the Discount Rate on Monday, thus
removing any doubt that there will be a hike in the Fed Funds Rate when the FOMC
meets in mid-December.
With regard to this rumour, we want to make two points.
First, the Discount Rate is now pretty much obsolete. We doubt that banks ever
use it, given that they are inundated with reserves and need almost no reserves.
An increase in the Discount Rate would therefore be purely symbolic.
Second, it is very unlikely that the Fed will hike the Discount Rate on Monday,
because doing so would cast doubt upon the Fed's own claim to being "data
dependent". What we mean is that the Fed can't reasonably claim to be data
dependent and then take an action that effectively locks-in the outcome of a
future FOMC meeting. In other words, it's very likely that the rumour is false.
Copper Update
The Commitments of Traders (COT)
data can indicate short-term tops and bottoms in the copper price. Specifically,
when the red bars (the speculative net position) and the blue bars (the
commercial net position) reach the bottom and top, respectively, of the box
drawn on the following chart, the copper price is probably near a short-term
bottom, and when the red and blue bars cross over the zero line on the following
chart, indicating a shift in the total speculative position from net-short to
net-long, the copper price is probably near a short-term top.
Most recently, the COT data correctly indicated a short-term price bottom in
August. However, the price subsequently made a short-term top without a clear
COT signal, in that a downward price reversal occurred before speculators became
net-long copper futures.
The COT situation is now close to signaling a short-term price bottom, but it
isn't there yet. We suspect that the next short-term bottom -- which could turn
out to be a bottom of intermediate-term importance -- will occur in December.
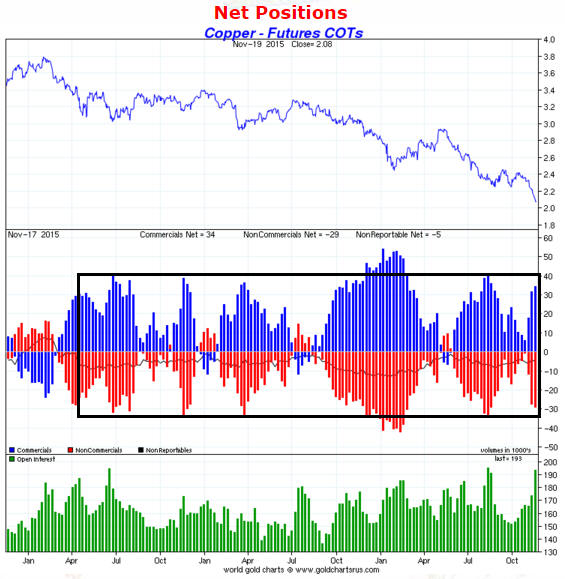
Chart Source: www.sharelynx.com
The Stock Market
The US
Equity bear markets and recessions
Not every recession is associated with an equity bear market, but every equity
bear market is associated with a recession. An economic recession therefore
seems to be a necessary, but not a sufficient, condition for a cyclical (1-3
year) decline in the US stock market. The other necessary condition is probably
a high average valuation. That is, a high average valuation combined with an
economic decline of sufficient scope to be called a recession invariably results
in an equity bear market.
The following chart illustrates the relationship between the overall US stock
market, as represented by the Wilshire5000 Index, and recessions since 1970. The
recessions are marked by the shaded areas. Notice that over the period covered
by the chart the stock market has always peaked prior to the official start of a
recession.
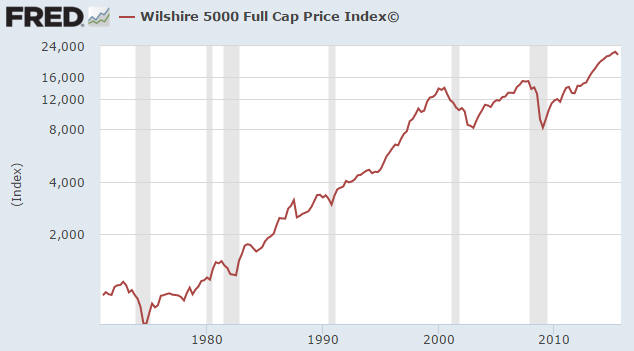
The information presented above can be used in two ways. It tells us that if the
peak in the US stock market during May-July of this year marked the start of a
bear market, as opposed to the start of a bull-market correction, then we should
soon get definitive evidence that the US economy has entered a recession. This
evidence should be with us by the end of January at the latest. And it tells us
that if broad market indices such as the Wilshire5000 make decisive breaks to
new highs at any time over the weeks/months ahead, then we can be confident that
the US economy is not in recession and that the start of a recession is not
imminent.
Right now, the jury is out. First, the stock market's price action is consistent
with both a transition from bull to bear and a bull-market correction. Second,
there are many signs of economic weakness, but despite what you might read at
zerohedge.com there is not yet definitive evidence of recession.
Current Market Situation
The senior US stock indices rebounded strongly last week, but indicators of
market breadth (advance-decline lines and the number of stocks making new highs
versus the number of stocks making new lows) were not strong. This means that
the rebound was mainly the result of strength in a relatively-small number of
influential stocks.
The US stock market has been rife with bearish non-confirmations and divergences
for much of this year, so in this respect last week's narrow rally was 'par for
the course'. It probably means that significant additional headway will not be
made before the next 1-2 week decline begins.
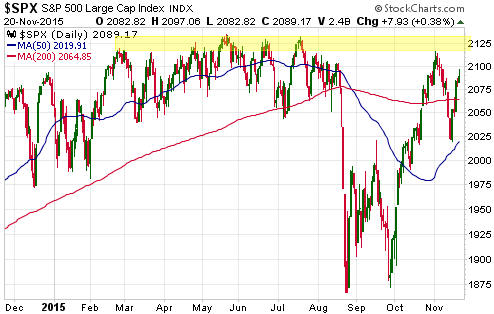
On the positive side of the ledger, when the S&P500 Index (SPX) closed above its
200-day MA last Wednesday it signaled that a multi-week bottom was probably in
place. This prompted us to immediately exit any remaining bearish speculations
(put options in this case) and retreat to the sidelines.
The SPX has substantial resistance at 2120-2130, and last week's price action
established 2020 as an important support level. Our best guess is that the next
few weeks will involve choppy price movement between 2020 and 2120. Short-term
traders could consider selling rises to around 2120 and buying declines to
around 2020 (using tight stops just in case an unexpected breakout occurs), but
we are going to stay on the sidelines for now pending new information and/or
inspiration.
It's possible that a good opportunity to establish a new bearish position will
arrive during the second half of December, but we'll take the evidence as it
comes.
Europe
The breakout was far from decisive, but it is still worth noting in these pages.
We are referring to the recent close by Germany's DAX Index above its 200-day MA
and a trend-line that dates back to the April high.
Despite the euro-zone's high monetary inflation rate and negative interest
rates, Mario Draghi keeps hinting that the ECB is about to become even more
aggressive in its efforts to promote "inflation". This is bearish for the
economies of Europe, but bullish for equity prices.
This week's
significant US economic events
[Notes:
1) The most important events
(to the markets) are shown
in bold. 2) A list of global economic events can be found
HERE]
| Date |
Description |
| Monday
Nov 23 |
Existing Home Sales |
| Tuesday
Nov 24 |
Q3 GDP (revised)
Case-Shiller Home Price Index
Consumer Confidence |
| Wednesday
Nov 25 |
Durable Goods Orders
Personal Income and Spending
New Home Sales
Consumer Sentiment |
| Thursday
Nov 26 |
US markets closed for public
holiday |
| Friday
Nov 27 |
No important events
scheduled |
Gold and the Dollar
Gold
More Commitments of Traders (COT) Reality
We've given the COT reports a lot of thought over the past 12 months, especially
with regard to how the information in these reports relates to the gold market.
This has reinforced our belief that the COT information is a useful indicator of
gold-market sentiment and caused us to realise that gold's COT data are even
more widely and grossly misinterpreted than we had previously believed.
A common misunderstanding is that the "commercials" cause the gold price to fall
by selling futures contracts. This is obviously not possible since the
"commercials" are invariably net buyers of gold futures during significant price
declines, but it remains popular because it meshes with the popular view that
there's a grand conspiracy to hold down the gold price.
Another common misunderstanding involves viewing the "commercials" as being
right about future price direction on the basis that peaks in the commercial
net-short position always coincide with peaks in the gold price. It is, however,
more correct to view the speculators as the price drivers and the commercial
position in gold futures as simply being the mathematical offset of the total
speculative position (the futures market is a zero-sum game, which means that in
order for speculators to go net-long by X contracts the commercials must go
net-short by X contracts). Note that we can be 100% certain that if the futures
market is driving the price then it's the group known as "speculators" that is
doing the driving, because the price moves in the same direction as the
speculative positioning. With speculators almost always increasing their
collective net-long position as the price moves higher, it is almost guaranteed
that commercials will end up with a peak net-short position at around the time
that the price reaches a peak.
A third common misunderstanding is the assumption that commercial traders in the
gold market are similar to the commercial traders in other commodity markets. As
explained in a TSI commentary a few months ago and at the
TSI Blog last week, traditional commercial traders such as producers (mining
companies) and jewellery manufacturers/wholesalers play only a small role in the
gold market.
Linked to the above misunderstandings is the fact that the dominant commercial
traders in the gold market (the bullion banks) are primarily concerned with
arbitraging the physical and the futures, that is, making money by trading the
spreads between the spot price and the prices for future delivery. They
generally don't care which way the price trends, because once they have locked
in a spread they will be assured of a profit regardless of what subsequently
happens to the price. That's why it makes no sense to think about the
commercials as being right (or wrong) about the future price performance. It's
the group known as speculators that bets on future price direction, which is why
the COT report is useful as a gold sentiment indicator. Once the leveraged
speculators have piled onto one side of the gold market, the market will be
acutely vulnerable to developments that cast doubt upon the prevailing
short-term price trend.
Before ending this discussion we'll make two more points, one that we've made
many times in the past and one that -- as far as we can recall -- is new.
The point we've made many times in the past is that like most sentiment
indicators, there are no absolute benchmarks for COT positioning. Instead, what
constitutes a high and a low speculative net-long position will change with the
major price trend. For example, short-term price tops over the past 2 years have
generally happened with the speculative net-long position at around 150K
contracts, whereas during 2009-2011 a 150K-contract speculative net-long
position was relatively low and suggestive of a short-term price bottom. An
implication is that once we get well into a new bull market, the speculative
net-long position in gold futures will tend to become much larger prior to
short-term price tops.
Our new point is that a rapid change in the speculative net position combined
with only a small change in price is evidence that speculators in the futures
market are moving counter to the supply/demand situation in the physical market.
For example, a rapid increase in the speculative net-long position in parallel
with only a small increase in price would suggest that speculators in gold
futures were too optimistic given what was happening in the underlying physical
market. This situation arose most recently between 13th and 20th October of this
year, when there was a 45K-contract surge in the speculative net-long position
in gold futures in parallel with only a $7 increase in the gold price. For
another example, a rapid reduction in the speculative net-long position in
parallel with only a small decrease in price would suggest that speculators in
gold futures were becoming excessively pessimistic considering what was
happening in the underlying physical market.
Current Market Situation
From last week's Interim Update:
"We've been expecting that the gold market would remain under pressure, with
nothing more bullish than a 1-2 week rebound, until around mid-December. We
still think that this is the most likely short-term scenario, but given the
extent of the recent weakness it is certainly possible that the market will
bottom-out earlier. We'll take the evidence as it comes.
With regard to evidence that the decline has run or is very close to running its
course, the COT data will again be of interest. The COT data to be published on
Friday will cover the 5-day period ending Tuesday 17th November, which means
that it will capture the change in speculative positioning that occurred in
parallel with the break below the July low."
The latest gold COT numbers certainly were interesting. As illustrated by the
following chart, they revealed that the total speculative net-long position in
COMEX gold futures has fallen to a level that would be consistent with at least
a short-term price bottom. This doesn't necessarily mean that a short-term price
bottom is in place, but it means that the COT situation is now definitively
gold-bullish. In other words, the COT situation is now a tail-wind for the gold
price.
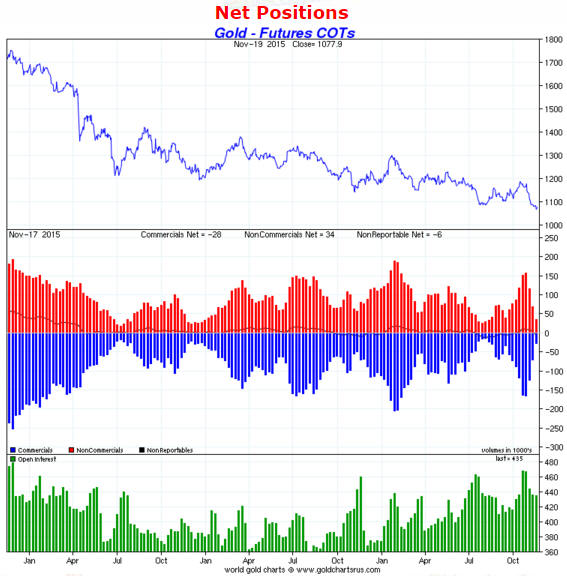
Chart Source: www.sharelynx.com
Last week's low in the US$ gold price coincided with the bottom of an
intermediate-term price channel and the bottom of the downward-sloping wedge
that began to form in mid-2013. Given the sentiment backdrop and the extent to
which the market is 'oversold', there's a realistic possibility that a tradable
gold rally will begin 2-3 weeks earlier than our mid-December guess. However,
although we now have a good setup for an upward reversal, at this time there is
no evidence in the price action that a reversal has occurred.
A daily close above Friday's high ($1087) would be the first sign that a
reversal has occurred.
Silver
Along with the serious investors and speculators that are involved in these
markets, both gold and silver have cult-like followings. Members of the gold
cult can be fanatical, but in terms of fanaticism they tend to pale in
comparison to members of the silver cult. According to the members of the silver
cult, the silver price is always on the verge of rocketing up to amazing
heights.
We think that silver will perform extremely well over the next few years, but
our long-term bullish expectations are periodically tempered by present-day
facts. In October, for example, silver's COT situation was a very bearish
present-day fact. Silver's COT situation (see chart below) is now greatly
improved, but it is not yet bullish. Based on what happened over the past two
years it looks like the total speculative net-long position will have to decline
by about 20K more contracts to set the stage for the next meaningful advance in
the silver price.
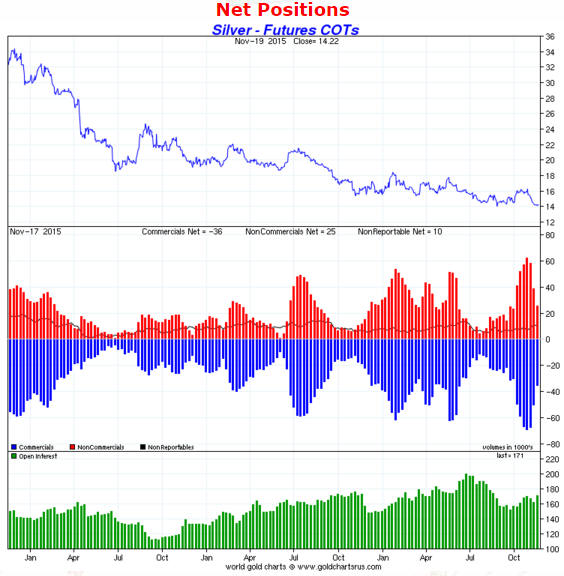
Chart Source: www.sharelynx.com
One possibility worth considering is that silver and gold will bottom over the
next several weeks in a similar way to how they bottomed in July-August, with a
1-3 week rebound in both gold and silver followed by gold pulling back to a
higher low while silver makes a lower low.
With regard to the coming 12 months, there are two reasons to suspect that
silver will outperform gold. The first is simply that by historical standards
the silver price is very low relative to the gold price. The second is that
silver is more commodity-like than gold, which means that it tends to outperform
gold during multi-quarter periods when interest rates and commodity prices are
trending upward and to underperform gold during periods when interest rates and
commodity prices are trending downward. We've had the latter situation over the
past few years and are likely to get the former situation next year, although we
hasten to point out that there is no evidence of a reversal in the
commodity-price trend yet.
The following chart illustrates the relationship mentioned above. It shows that
there has been a positive correlation between the silver/gold ratio and the CRB
Index over the past 15 years.
Gold Stocks
Current Market Situation
Last Friday was an outside-down day for the HUI. This is bearish price action,
but it doesn't significantly alter our expectations. There remains a realistic
chance of a 1-2 week rebound to the vicinity of the 50-day MA, but we expect
that the next rally worth trading won't begin until around mid-December.
Gold stocks under consideration
What are some gold stocks that are currently not in the TSI Stocks List that we
might be interested in adding, depending on developments over the next month or
so?
Among the seniors and mid-tiers, the four that are of greatest interest to us
right now are:
1) Alamos Gold (AGI), a 400K-oz/year producer with assets in Canada, Mexico and
Turkey. AGI was a US$15 stock a little over 2 years ago and is now trading in
the US$2.90s. It has a strong balance sheet, but a high production cost (its
current AISC is around US$1150/oz). The high production cost means that it will
respond vigorously to an improvement in the gold market, but will likely report
a sizable loss for the current quarter. It also offers exposure to copper, a
negative at the moment that could turn into a positive next year.
2) B2Gold (BTG), a 500K-oz/year producer with assets strewn across a few
relatively high-risk countries. Its balance sheet is not as healthy as that of
AGI, but its costs are lower and it stands a reasonable chance of reporting a
profit for the current quarter.
3) Kinross Gold (KGC), a 2.6M-oz/year producer on its way to becoming a
3M-oz/year producer thanks to a recent acquisition. KGC has a healthy balance
sheet and offers by far the best value within the ranks of gold producers with
more than 1M-oz/year of current production. The main problem is country risk, in
that its most profitable assets are located in Russia.
4) Royal Gold (RGLD), one of the two most important gold royalty companies.
Thanks to a recent sell-off, RGLD now offers good value for the first time in
years.
The above stocks will survive the remainder of the gold bear market and will
very likely go on to thrive during the coming gold bull market. In other words,
they might drop further, but they won't go to zero. There are, however, some
gold-mining stocks with far less certain futures that a) have already been sold
down to almost nothing and b) could be worthwhile speculations on the basis that
the upside will be spectacular IF they manage to stay in business without
resorting to massive share dilution. Current TSI List member Timmins Gold (TGD)
falls into this category, but there are others on which it could make sense to
risk small sums of money before year-end. We intend to mention some specific
ideas over the next few weeks.
The Currency Market
ECB chief Mario Draghi has been clearly hinting that the ECB will introduce
enhanced measures to promote "inflation" at its 3rd December meeting. These
measures could involve pushing the official deposit rate further into negative
territory, accelerating bond purchases and/or widening the range of bonds that
are eligible to be purchased. This blatant display of profligacy has helped to
weaken the euro relative to the US$, but, strangely enough, it hasn't caused a
significant loss of confidence in either the ECB or the euro. We know that
confidence in the ECB and the euro has been stable because the euro-denominated
gold price has been stable.
On a side note, a substantial increase in the gold price only requires a loss of
confidence in one of the two senior currencies (the US$ or the euro). For
example, the rise in the gold price from $700 to $1000 between October of 2008
and February of 2009, the rise in the gold price from $1500 to $1900 during the
third quarter of 2011 and the rise in the gold price from $1130 to $1300 between
November of 2014 and January of 2015 were driven primarily by euro-related
fears.
Rather than being caused by declining confidence in the ECB or the euro, the
sharp decline in the euro over the past few weeks has been due to relative
weakness in European equities and widening interest-rate differentials. As
mentioned above, confidence is intact. Given the actions of the ECB and some of
Europe's governments it is difficult to explain why, but that's the way it is.
The following chart shows the strong relationship between relative equity
performance and the euro. It shows that apart from a 2-month divergence early
this year, over the past three years the euro has trended in the same direction
as the VGK/SPX ratio (VGK is a US$-denominated proxy for European equities).
An implication of the above chart is that IF the ECB's various
inflation-promoting measures lead to persistent relative strength in European
equities, then these measures will likely result in a stronger, not a weaker,
euro in the short-term.
Updates
on Stock Selections
Notes: 1) To review the complete list of current TSI stock selections, logon at
http://www.speculative-investor.com/new/market_logon.asp
and then click on "Stock Selections" in the menu. When at the Stock
Selections page, click on a stock's symbol to bring-up an archive of
our comments on the stock in question. 2) The Small Stock Watch List is
located at http://www.speculative-investor.com/new/smallstockwatch.html
 Company
news/developments for the week ended Friday 20th November 2015:
Company
news/developments for the week ended Friday 20th November 2015:
[Note: AISC = All-In Sustaining Cost, FS = Feasibility Study, FY = Financial
Year, IRR = Internal Rate of Return, MD&A = Management Discussion and Analysis,
M&I = Measured and Indicated, NAV = Net Asset Value, NPV(X%) = Net Present Value
using a discount rate of X%, P&P = Proven and Probable, PEA = Preliminary
Economic Assessment, PFS = Pre-Feasibility Study]
*Almaden Minerals (AAU) announced its expected equity financing
after the close of trading last Tuesday. The company is raising C$3.3M by
issuing 4.5M units at C$0.75, with each unit comprising one share and one-half
of a 2-year share purchase warrant with an exercise price of C$1.00. Not
including the value of the warrants, the financing price is slightly above the
market price at the time of the announcement.
The timing of this financing is not ideal in that it was arranged with the stock
price near a multi-year low, but it had to be done.
*Asanko Gold (AKG) published its financial results for the
September quarter. According to these results the company had US$120M of working
capital and US$119M of long-term debt at 30th June. This compares with US$204M
of working capital and US$124M of long-term debt at 30th June, which indicates
that the company spent about US$79M during the latest quarter (following US$69M
of spending in the March quarter). The rapid pace of spending is in accordance
with the company's budget, as AKG advances Phase 1 of the Asanko Gold Mine (AGM)
into production.
Mine construction is on budget and one month ahead of schedule. Hot
commissioning of the processing plant is expected to happen in December and the
first gold production is expected to happen in January, followed by a ramp-up to
steady-state production in Q2 2016. The company anticipates becoming
cash-flow-positive in Q2-2016.
At this time AKG has a financial buffer of about US$40M, meaning that if it
meets its current forecasts then it will still have about US$40M of available
funding when it becomes cash-flow positive.
*Premier Gold (PG.TO) announced that it is raising C$7.25M by
issuing 2.5M new "flow through" shares at C$2.90/share. The shares are being
issued at a roughly 25% premium to the market price at the time of the
announcement. Also, the price at which the new shares are being issued is the
same as the 12-month high and not far below the 2-year high.
PG is able to issue new shares at a relatively high price because it has a large
cash reserve and does not need the money. It is a very well-managed company.
The best time to obtain financing is when you don't need it, because that's when
you will be able to negotiate the best terms. Unfortunately, the managers of
many gold-mining companies do the opposite. They wait until their company is low
on cash and then go 'cap in hand' in search of financing. Naturally, they get
taken advantage of. The managers usually get off lightly, however, because they
can issue themselves with a bunch of additional stock options at the new
share-price lows caused by the poorly-timed financing.
You should never own just one junior gold mining stock. You should own 5-10 in
order to spread the risk or you should own none. However, if you were going to
hold only one, then PG should be it.
*Sabina Gold and Silver (SBB.TO) is doing a similar equity
financing to the one being done by PG.TO. Like PG, SBB doesn't need the money.
And like PG, SBB is taking the opportunity to top-up its treasury via a
relatively small (C$2.2M in this case) issue of "flow through" shares priced at
a 12-month high and a >25% premium to the market price at the time of the
announcement. This is exactly the way that exploration-stage gold miners should
do equity financings.
*True Gold Mining (TGM.V) published its latest quarterly financial
results and an update on progress at its construction-stage Karma gold mine in
Burkina Faso.
The Karma project remains on budget and on track (as per the revised schedule
that was put in place during the second quarter of this year) to commence
production at the end of Q1-2016.
According to last week's press release, Karma remains financed through to
production. Specifically, TGM reported that at 30th September it had US$20.5M in
cash and up to US$48.4M available under its finance facility (US$69M of total
funding) with approximately US$46M of project cost left to spend.
Of the $69M of total available funding, $20M is an "increase option" on top of
the original $100M credit facility. Because the cost of this "increase option"
is quite high, it would be best if TGM didn't use it. We therefore suspect (and
hope) that the company will do an equity financing to top up its treasury within
the next few months if the opportunity arises to do so at a reasonable price.
However, it isn't under pressure to raise money and hopefully won't do an equity
financing until/unless the stock price moves substantially higher.
List
of candidates for new buying
From within the ranks of TSI stock selections the best candidates for new buying
at this time, listed in alphabetical order, are:
1) AAU (last Friday's closing price: US$0.50)
2) DNA.TO (last Friday's closing price: C$0.67)
3) EDV.TO (last Friday's closing price: C$0.61)
4) EVN.AX at A$1.25 or lower (last Friday's closing price: A$1.30)
5) PG.TO (last Friday's closing price: C$2.35)
Note that the above list is limited to five stocks. It will sometimes contain
less than five, but it will never contain more than five regardless of how many
stocks are attractively priced for new buying.
Chart Sources
Charts appearing in today's commentary
are courtesy of:
http://stockcharts.com/index.html
http://research.stlouisfed.org/
