![]()
![]()
![]()
![]()
-- Weekly Market Update for the Week Commencing 23rd December 2019
Copyright
Reminder
The commentaries that appear at TSI
may not be distributed, in full or in part, without our written permission.
In particular, please note that the posting of extracts from TSI commentaries
at other web sites or providing links to TSI commentaries at other web
sites (for example, at discussion boards) without our written permission
is prohibited.
We reserve the right to immediately
terminate the subscription of any TSI subscriber who distributes the TSI
commentaries without our written permission.
True
Fundamentals Summary
[Notes:
1) The date shown next to the current True Fundamentals Model (TFM) signal is
when the most recent change occurred. 2) Charts of the Gold and Equity
TFMs are included in the "Charts and Indicators" section of the TSI web
site]
| Market | True Fundamentals Model (TFM) |
| Gold (US$ Price) | Bearish (20 Dec 2019) |
| US Equity (SPX) | Bullish (20 Dec 2019) |
| Currency (Dollar Index) | Neutral (15 Mar 2019) |
| Commodities (GNX) | Bearish (01 Jun 2018) |
Last week's posts at the TSI Blog
Gold is not a hedge against "CPI inflation"
Summary of current
thinking/positioning
1) The Dollar Index (DX) remains
range-bound, needing a weekly close below 96.5 to signal an
intermediate-term reversal to the downside or a weekly close above 99.5 to
signal an intermediate-term rally. We are anticipating the former, but we
are uncertain as to whether it will happen in the near future or during
the first few months of next year.
2) The gold bullion market is at
odds with the gold mining sector, in that the latter has signaled an
upward reversal of its short-term trend whereas the former has not.
There's a good chance that this conflict will be resolved within the
coming week.
3) The senior US stock indices probably will make
multi-month tops between late-December and mid-January.
4) The
T-Bond made a short-term bottom in early-November, but there is still risk
of downward acceleration over the coming month or two. Regardless of what
happens in the short-term, there's a good chance that major price weakness
will be seen in 2020. In other words, it looks like higher interest rates
are on the way.
5) Industrial commodities such as oil and copper
appear to be in the process of bottoming, with intermediate-term price
lows either already in place or likely to be set early next year.
6) We are holding a cash reserve of 25%-30%.
TSI Holiday
Season Schedule
Due to Christmas, New Year and
related personal plans/commitments, for the next three weeks there will be
no Interim Update. However, we will continue to publish the Weekly Update
at around the usual time each week. For example, there will be no Interim
Update on Thursday 26th December, but there will be a Weekly Update on
Sunday 29th December.
I wish you a happy Holiday Season and the
best of luck in 2020!
The T-Bond is on
the edge
The T-Bond price has pulled back
to within one point of its November low and its 200-day MA. Refer to the
following chart for the details. Therefore, to avoid a potentially serious
downside breakout it will have to rebound soon.
If it fails to
embark on a significant rebound and instead ends a week below 155, the
scene would be set for a larger and faster decline.
A downward move in the bond price means an upward move in the bond
yield, which usually goes hand-in-hand with a rise in the copper price
relative to the gold price (a rise in the copper/gold ratio, that is). The
positive correlation between the copper/gold ratio and the 10-year bond
yield is illustrated below.
Jeffrey Gundlach, a famous bond fund manager, says that the
copper/gold ratio is a good predictor of the 10-year bond yield, but we
disagree because there is no consistent lead-lag relationship between the
two. The 10-year yield generally moves in the same direction as the
copper/gold ratio, but more often than not they change direction at the
same time. For example, both the 10-year yield and the copper/gold ratio
turned upward in early-September of this year and have since risen
together.
An implication is that the recent performance of the
copper/gold ratio can't be used reliably to predict the future performance
of long-term interest rates. Instead, to use the copper/gold ratio as an
indicator of what will happen to long-term interest rates in the future
you first must develop an opinion about what will happen to the
copper/gold ratio in the future. Looking from a different angle, a view
about the future direction of long-term interest rates leads to a view
about the future performance of copper relative to gold. For example, one
of the reasons we currently expect strength in copper relative to gold
over the next 12 months is that we expect bond yields to trend upward over
this period.
Anyhow, whether or not the T-Bond holds support
defined by its November price low will be one of the keys to what happens
throughout the financial world over the coming month or so. If the T-Bond
breaks support and accelerates downward it could precipitate a sharp
sell-off in the gold market. Also, it could be the catalyst for a sizable
stock market correction.
Time for the
palladium bubble to deflate?
Our most recent comment on the
palladium bubble was in the 21st October Weekly Update. At that time we
noted the similarities between the current bubble and the final stages of
the bubble that reached its zenith in early-2001. We concluded: "If
the rough similarity is maintained then today's market will reach its
final top between November of this year and March of next year."
It's too soon to be certain or even confident, but last week's
downward reversal in the palladium price could have marked the bursting of
the bubble and the start of a major decline.
Here, again, are the
weekly charts that illustrate the similarities between the current period
and the final stages of the palladium bubble that 'blew out' during
2000-2001.
The Stock Market
Sentiment Alert
Stock market sentiment has been optimistic over the past two months,
but not dangerously so given the steady rise in the S&P500 Index and the
positive market breadth. However, the situation changed last week.
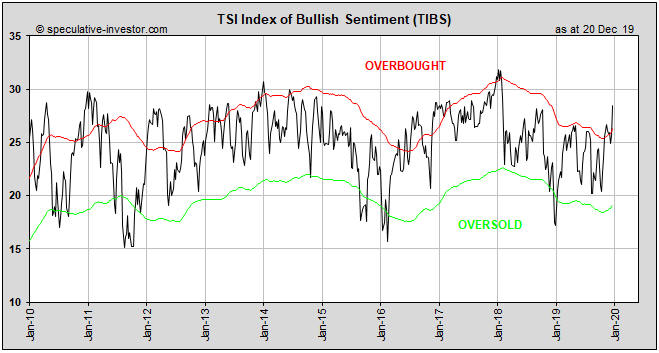
Last week there was a surge in optimism that constitutes a loud warning
signal. The optimism surge is clearly evident in the latest calculation of
the TSI Index of Bullish Sentiment (TIBS).
TIBS is a weighted
average of six sentiment indicators. Most of the time it is not relevant,
because most of the time it simply follows the price and oscillates within
the moving-average (MA) envelope shown on the following weekly chart. It
only becomes relevant when it moves well below or well above the MA
envelope.
Moves by the TIBS to well below or well above its MA
envelope don't happen very often, which is why TIBS rarely gets mentioned
in TSI commentaries. The last time it happened was 12 months ago, when
TIBS spiked well below the lower boundary of its MA envelope and in doing
so signaled that the market was close to a multi-month bottom. The current
signal is the opposite. TIBS is now warning that the US stock market is
close to a multi-month top.
It isn't just stock market optimism that is immersed in what appears
to be a trend-ending surge. Despite the obvious weakness in the
manufacturing sector of the US economy, there also is evidence of a
trend-ending surge in economic optimism. We are referring to the sudden
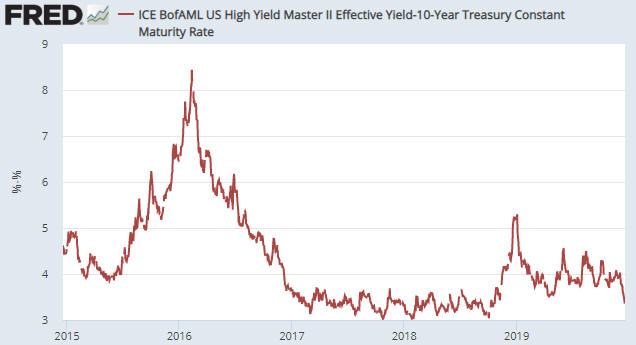
narrowing of credit spreads over the past few weeks.
The following
chart of a credit-spread indicator shows that credit spreads were rapidly
widening at this time last year, which signaled burgeoning fear of
economic weakness. The same indicator is now in the midst of a sharp
decline, indicating that whatever concerns there have been about economic
prospects are quickly evaporating.
In the same way that last
December's spike in economic pessimism marked a multi-month bottom for the
stock market, this December's spike in economic optimism could be marking
a multi-month top for the stock market.
Current Market Situation
The S&P500 Index
(SPX) continued its relentless advance last week. Seasonal/cyclical forces
suggest that the short-term upward trend will extend into the first half
of January, but the 1999 analogue warns that the top could occur at
year-end.
At this stage we are still anticipating nothing more
bearish than a 10% correction. The reason is that market breadth, one
indicator of which (the NYSE Advance-Decline Line) is shown in the lower
section of the following chart, continues to confirm the SPX's new highs.
The US stock market has never commenced a cyclical bearish trend
or suffered a crash with the Advance-Decline Line in an upward trend and
regularly making new all-time highs.
This week's
significant US economic events
[Notes:
1) The most important events
(to the markets) are shown
in bold. 2) A list of global economic events can be found
HERE]
| Date | Description |
| Monday Dec-23 | New Home Sales |
| Tuesday Dec-24 | Durable Goods Orders |
| Wednesday Dec-25 | Markets closed for Xmas Day |
| Thursday Dec-26 | US markets open, but many other markets closed for Boxing Day |
| Friday Dec-27 | No important events scheduled |
Gold and the Dollar
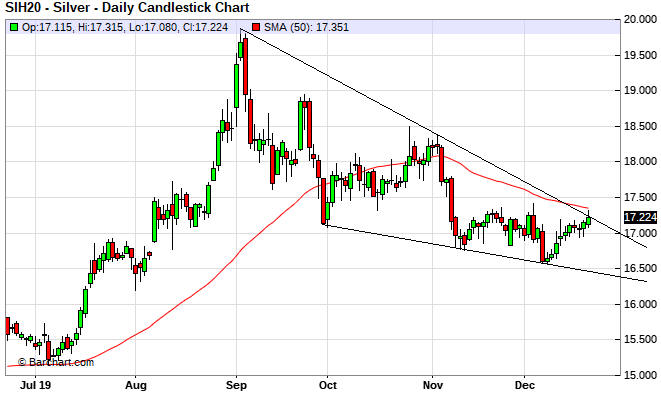
The HUI, a proxy for the gold-mining sector, managed to draw-out its
coiling pattern for an additional week by pulling back to near its 20-day
MA. The HUI looks like it is preparing to accelerate upward to a new
multi-year high, but for it to do so the gold price almost certainly will
have to break upward from its channel and also break above lateral
resistance in the $1520s.
The HUI and the other gold-mining sector proxies have been
strengthening relative to gold since the second week of October. This
recent relative strength is evidenced by the rising line on the following
chart of the HUI/gold ratio. The ratio pulled back last week, but it is
close to a multi-year high and will maintain a bullish posture as long as
it holds above its 40-day MA (the blue line on the chart).
Our Gold True Fundamentals Model (GTFM) flipped from bullish to
bearish last week, but as we explained a week ago: "The GTFM...is more
vulnerable than usual to being 'whipsawed' at the moment because four of
its seven inputs are very close to their tipping points. Consequently,
it's best to view the current fundamental backdrop as finely balanced."
With regard to the gold market, it's still best to view the fundamental
backdrop as finely balanced. The same, by the way, applies to the stock
market.
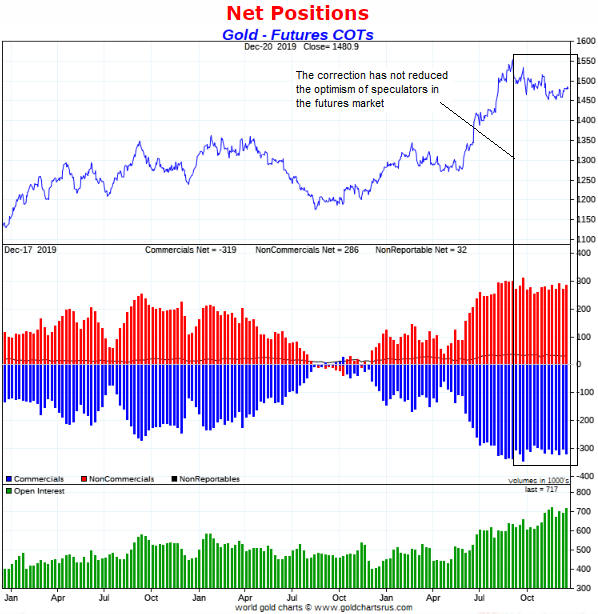
As has been the case for about four months, speculator
sentiment is the biggest obstacle facing the gold price. The total
speculator net-long position (the inverse of the blue bars in the middle
section of the following weekly chart) reached an extreme in August and
has remained at/near an extreme despite the downward drift in the gold
price since early-September.
The sentiment situation doesn't
preclude a rally that tests the 2019 high, but it makes a rally to well
above the 2019 high very unlikely and creates downside risk.
Based on the way the markets usually have traded relative to each
other over the past 10 years, for there to be significant strength in the
gold price over the next few weeks the T-Bond price will have to hold
above its November low. To put it another way, if the T-Bond makes a
sustained break to new multi-month lows then the US$ gold price probably
will end its coiling pattern by reversing downward.
The
Currency Market
On Friday 13th December the March-2020
Dollar Index (DX) successfully tested support at 96.5. Last week it
rebounded. Move along, nothing to see here.
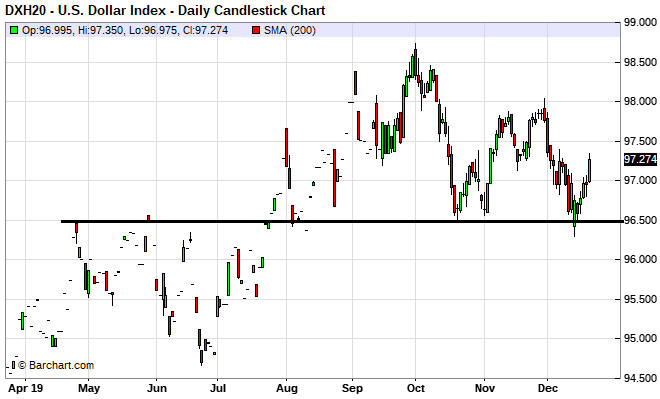
A weekly close below 96.5 would warn that the DX was on its way to
94.5 or lower. We expect this to happen sooner or later, with later (after
January of next year as opposed to the next three weeks) being the more
bearish scenario. To further explain, if the DX were to break to the
downside within the next three weeks there would be a much greater risk of
the breakout being a 'fakeout' than if the break to the downside happened
in February or later.
The DX has been drifting with a slight upward
bias since the third quarter of last year, so it isn't surprising that
over the same period the euro has been drifting with a slight downward
bias. A weekly close above 1.12 would signal that this long period of
aimless drifting had ended and that a meaningful rally had begun,
especially if the break above 1.12 were to happen after January.
As
illustrated by the following weekly chart, the euro could move as high as
1.18 within the next 6 months while remaining within the confines of its
long-term downward-sloping channel. That's the sort of upside move we are
anticipating.
For the umpteenth time since March of 2018 the Australian dollar (A$)
has risen to its 200-day MA. Within the next few months it should break
out to the upside and signal an end to its long decline.
Updates
on Stock Selections
Notes: 1) To review the complete list of current TSI stock selections, logon at
http://www.speculative-investor.com/new/market_logon.asp
and then click on "Stock Selections" in the menu. When at the Stock
Selections page, click on a stock's symbol to bring-up an archive of
our comments on the stock in question. 2) The Small Stock Watch List is
located at http://www.speculative-investor.com/new/smallstockwatch.html
![]() Company
news/developments for the week ending Friday 20th December 2019:
Company
news/developments for the week ending Friday 20th December 2019:
[Note: AISC = All-In Sustaining Cost, EBITDA = Earnings Before
Interest, Tax, Depreciation and Amortisation (a measure of cash flow), EV
= Enterprise Value or Electric Vehicle, FS = Feasibility Study, FY =
Financial Year, IRR = Internal Rate of Return, ISR = In-Situ Recovery, JV
= Joint Venture, MD&A = Management Discussion and Analysis, M&I = Measured
and Indicated, NAV = Net Asset Value, NPV(X%) = Net Present Value using a
discount rate of X%, NSR = Net Smelter Return or Net Smelter Royalty, P&P
= Proven and Probable, PEA = Preliminary Economic Assessment, PFS =
Pre-Feasibility Study]
*Fortuna Silver Mines (FSM)
was added to the TSI List late last week. The stock has the right
attributes to be a long-term holding, but the current position is a
short-term trade with an expected duration of less than three months.
An initial daily-closing stop has been set at US$3.15, which means
that we won't give this trade much rope. It should either start working or
get stopped out within the next two weeks.
*Premier Gold (PG.TO) issued an operations
update that, as far as we can tell, provided no new information. According
to the update the Mercedes gold-silver mine in Mexico continues to
struggle, but actions have been that should lead to improved performance
in 2020. Also, the South Arturo project in Nevada continues to perform
well, with the El Nino underground mine having reached commercial
production ahead of schedule.
*Tinka Resources
(TK.V), an exploration-stage zinc miner operating in Peru,
announced a large equity financing. Most of the time, equity financings
that are done when the stock price is trading near a multi-year low -- as
was the case when TK arranged its financing -- have bearish implications.
However, TK's financing was/is very bullish. The reason is that almost all
of the new shares have been purchased under a subscription agreement by
Compania de Minas Buenaventura SAA ("Buenaventura"), a senior Peru-based
precious and base metals mining company listed on the NYSE (symbol: BVN)
and the Lima Stock Exchange, at a premium of 100% to TK's pre-announcement
share price.
Buenaventura will be investing C$16M at C$0.243/share
to purchase about 19% of TK. In addition, TK's largest shareholder, the
Sentient Global Resources Fund, has exercised its participation rights in
respect of the financing and will be purchasing C$2.5M of new shares at
the same price. Post-financing, Sentient will own about 22% of TK.
The aforementioned financing means that TK has become fully funded for at
least the next 12 months at a very attractive price in the context of the
current lousy market for base-metal explorers. Even more importantly, it
signals that Buenaventura is interested in eventually acquiring TK's
Ayawilca zinc project.
This is not just a vote of confidence in the
Ayawilca project from the smart money, it's a vote of confidence from the
smartest money and confirms that TK suits our modified approach to dealing
with speculative resource stocks. Given that we no longer can rely on the
periodic aggressive buying of the public to create excellent profit-taking
opportunities in junior resource stocks and that ETFs are diverting
investment away from the juniors and toward the stocks of larger
companies, we want to focus our attention on the mining juniors that own
mineral deposits of sufficient size and quality to be of interest to the
mining majors.
![]() List
of candidates for new buying
List
of candidates for new buying
From within the ranks of TSI
stock selections the best candidates for new buying at this time, listed
in alphabetical order, are:
1) ALK.AX (last Friday's closing price:
A$0.56)
2) AOI.TO (last Friday's closing price: C$1.18)
3)
FSM (last Friday's closing price: US$3.36)
4) JRV.AX/JRV.V (last
Friday's closing price: A$0.19/C$0.17)
5) TGB (last Friday's
closing price: US$0.42)
The above list is limited to five stocks.
It sometimes will contain less than five, but it never will contain more
than five regardless of how many stocks are attractively priced for new
buying.
![]() New
TSI stock selection: Galaxy Resources (ASX: GXY). Shares: 410M. Recent
price: A$0.89
New
TSI stock selection: Galaxy Resources (ASX: GXY). Shares: 410M. Recent
price: A$0.89
GXY was added to the TSI Stocks List in last
week's Interim Update. The company is a lithium producer/developer with a
strong balance, a production-stage lithium asset in Western Australia and
two development-stage lithium assets in the Americas.
GXY's Mt
Cattlin mine in Western Australia produces spodumene concentrate with an
average grade of around 6% LiO2 (lithium oxide). For the bulk of this year
the annualised production rate was around 200Kt.
Despite being a
low-cost producer, the decline of almost 50% in the market price of
spodumene concentrate over the past year, from above US$900/t to around
US$500/t, has caused part of the Mt Cattlin resource to become uneconomic.
In response, GXY's management has decided to emphasise value over quantity
in 2020 to ensure that the operation remains profitable. 2020 production
therefore is expected to be about half the 2019 level, but a return to the
2019 production level or higher will occur after it becomes clear that the
lithium market has turned around.
We are valuing Mt Cattlin at
one-times annual revenue, assuming the 2019 production level (190Kt) and
the current low spodumene price of US$500/t. This means that we are
currently valuing the asset at US$95M (A$138M).
Although it is
more than two years from production, GXY's most valuable asset is its Sal
de Vida (SDV) lithium brine project in Catamarca Province, Argentina. The
project is adjacent to Livent's Fenix lithium operation and could become a
large-scale producer of lithium carbonate (Li2CO3). The current schedule
is for a Final Investment Decision (FID) to be made in Q2-Q3 of 2020 and
for production to begin in 2022.
The FS completed in May-2018
estimated that it would cost US$474M to put SDV into production and that
the operation would have a post-tax NPV(8%) and IRR of US$1.5B and 26.9%
assuming US$14,000/t for Li2CO3. The estimated NPV and IRR drop to
US$1.05B and 22% assuming US$11,700/t for Li2CO3, which is still good.
However, the current Li2CO3 price is only about US$9,000/t.
It's
likely that SDV remains economically viable, because GXY has further
optimised the project over the past 18 months. Also, to reduce the initial
capex the company now plans to develop the project in two or three stages.
To arrive at a value for SDV we have applied a 50% discount to the
NPV figure that is based on a lithium carbonate price of US$11,700/t. That
is, we currently value SDV at US$500M (A$725M). The assumed selling price
is well above the current market price, but the 50% discount and the
post-FS improvements mean that the valuation is far from aggressive.
GXY's third lithium asset is the feasibility-stage James Bay spodumene
project in Quebec, Canada. This asset will become very valuable after the
lithium market turns around, but over the next year it probably will be on
the backburner. To be conservative, we are assigning no value to it at the
moment.
The most recent financial statements show that GXY has no
long-term debt and net cash of A$176M. This implies that the company will
be able to survive until growing EV-related demand causes a sustained
upward reversal in the lithium price trend. We expect that the turnaround
will happen in 2020.
Adding the company's net cash to the asset
valuations mentioned above results in a valuation of A$1,039M, or
A$2.53/share, for the company. This compares very favourably with the
current share price of A$0.89.
Also worth mentioning is that GXY is
attempting to sell a minority stake in its SDV project. In addition to
injecting a lot of cash into the company, if the sale process is
successful it should highlight the large gap between GXY's market cap and
its underlying value. In other words, there is a potential
company-specific catalyst for an upward re-rating of the stock.
Chart Sources
Charts appearing in today's commentary
are courtesy of:
https://stockcharts.com/
http://www.goldchartsrus.com/
https://www.barchart.com/
https://research.stlouisfed.org/