|
-- Weekly Market Update for the Week Commencing 24th March 2014
Big Picture
View
Here is a summary of our big picture
view of the markets. Note that our short-term views may differ from our
big picture view.
In nominal dollar terms, the BULL market in US Treasury Bonds
that began in the early 1980s ended in 2012. In real (gold)
terms, bonds commenced a secular BEAR market in 2001 that will continue
until 2018-2020. (Last
update: 20 January 2014)
The stock market, as represented by the S&P500 Index,
commenced
a secular BEAR market during the first quarter of 2000, where "secular
bear market" is defined as a long-term downward trend in valuations
(P/E ratios, etc.) and gold-denominated prices. This secular trend will bottom sometime between 2014 and 2020.
(Last update: 22 October 2007)
A secular BEAR market in the Dollar
began during the final quarter of 2000 and ended in July of 2008. This
secular bear market will be followed by a multi-year period of range
trading.
(Last
update: 09 February 2009)
Gold commenced a
secular bull market relative to all fiat currencies, the CRB Index,
bonds and most stock market indices during 1999-2001.
This secular trend will peak sometime between 2014 and 2020.
(Last update: 22 October 2007)
Commodities,
as represented by the Continuous Commodity Index (CCI), commenced a
secular BULL market in 2001 in nominal dollar terms. The first major
upward leg in this bull market ended during the first half of 2008, but
a long-term peak won't occur until 2014-2020. In real (gold) terms,
commodities commenced a secular BEAR market in 2001 that will continue
until 2014-2020.
(Last
update: 09 February 2009)
Copyright
Reminder
The commentaries that appear at TSI
may not be distributed, in full or in part, without our written permission.
In particular, please note that the posting of extracts from TSI commentaries
at other web sites or providing links to TSI commentaries at other web
sites (for example, at discussion boards) without our written permission
is prohibited.
We reserve the right to immediately
terminate the subscription of any TSI subscriber who distributes the TSI
commentaries without our written permission.
Outlook Summary
Market
|
Short-Term
(1-3 month)
|
Intermediate-Term
(6-12 month)
|
Long-Term
(2-5 Year)
|
|
Gold
|
Neutral
(25-Feb-14) |
Bullish
(26-Mar-12) |
Bullish
|
|
US$ (Dollar Index)
|
Bearish
(05 Mar-14) |
Bearish
(27-Jan-14) |
Neutral
(19-Sep-07) |
|
Bonds (US T-Bond)
|
Bullish
(11-Dec-13)
|
Neutral
(18-Jan-12)
|
Bearish |
|
Stock Market
(DJW)
|
Neutral
(03-Mar-14)
|
Bearish
(28-Nov-11) |
Bearish
|
|
Gold Stocks
(HUI)
|
Bullish
(03-Mar-14) |
Bullish
(23-Jun-10) |
Bullish
|
|
Oil |
Bearish
(12-Mar-14) |
Neutral
(31-Jan-11) |
Bullish
|
|
Industrial Metals
(GYX)
|
Neutral
(17-Feb-14) |
Neutral
(06-Jan-14) |
Neutral
(11-Jan-10) |
Notes:
1. The date shown below the current outlook is when the most recent outlook change occurred.
2. "Neutral", in the above table, means that we either don't have a
firm opinion or that we think risk and reward are roughly in balance with respect to the timeframe in question.
3. Long-term views are determined almost completely by fundamentals,
intermediate-term views by
fundamentals, sentiment and technicals, and short-term views by sentiment and
technicals.
Euro-Zone Banking/Debt
Crisis Update
In our 2014 Yearly Forecast, we wrote:
"Another euro-zone banking/debt crisis is inevitable [Mario Draghi's promise
that the ECB would "do whatever it takes" to support Europe's monetary union
didn't permanently solve anything], but there are currently no signs that it is
imminent. For example, the yield on 10-year Spanish government bonds is near a
5-year low and the EURO STOXX Banks Index recently made a 2-year high. We will
monitor European bonds and bank shares in an effort to determine the timing of
the inevitable crisis. All we can say right now is that it probably won't happen
during the first half of 2014."
Taking into account the performance of various markets over the intervening two
months we can now be certain that the next crisis (a new crisis or the next
phase of the one that erupted in 2010-2012) won't happen during the first half
of this year. We are referring to the market performances depicted on the three
charts displayed below.
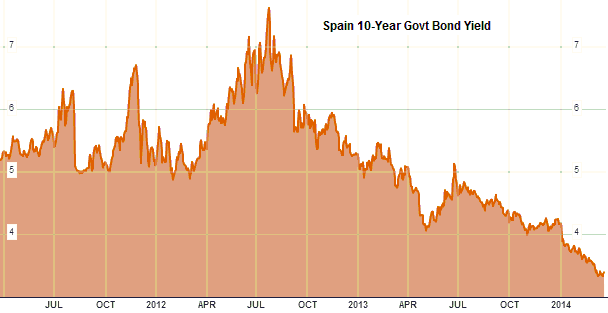
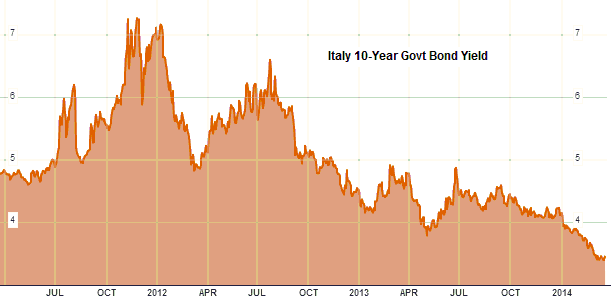
The first two charts show that yields on 10-year Spanish and Italian government
bonds have continued to drift downward and are both currently around 3.4%. By
way of comparison, 10-year US Treasury Notes presently yield 2.75%. The market
is therefore saying that Spanish and Italian government bonds are only slightly
more risky than US government bonds. This is ridiculous, but it is what it is.
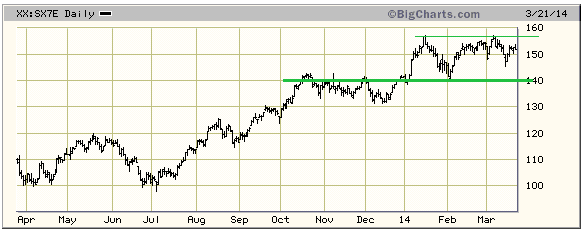
The third chart shows that SX7E, a proxy for euro-zone bank stocks, is not far
from a multi-year high. SX7E would have to break below 140 to signal a problem.
Financial markets have a habit of not caring about risk for a long time and then
suddenly shouting "oops!". The next "oops!" moment for the euro-zone's
government debt market and banking system won't occur until the second half of
this year or later, but before it does occur there should be warning signs
including upward reversals in government bond yields and downward reversals in
bank share prices.
The Stock
Market
Here's a repeat of
Mike Burk's chart illustrating
the Presidential Cycle (PC) Model for the S&P500 Index (SPX). The red line on
the chart shows the average performance of the SPX during all years since 1928
and the blue line on the chart shows the average performance of the SPX during
the second year of the US Presidential Cycle (2014 is the second year of the
current cycle) over the same period.
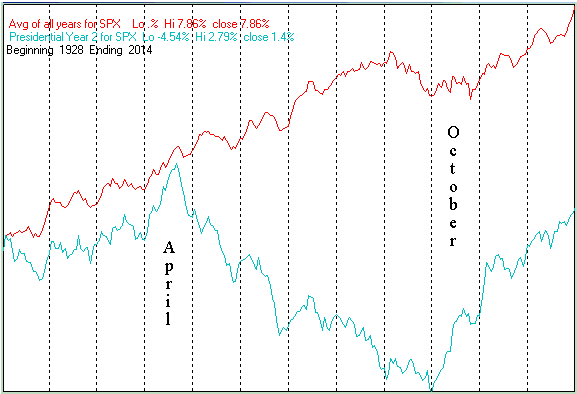
We don't place much importance on the PC Model, but the fact is that the market
has moved roughly in accordance with this model so far this year despite having
many reasons to deviate to the downside. Even the January correction was
consistent with the PC Model.
The PC Model predicts a high of at least intermediate-term significance during
the second half of April followed by strong downward trend to a bottom during
the first half of October.
It is not a good idea to bet that the market will continue to track the PC Model
and accelerate upward over the next few weeks to an April peak. However, the
risk/reward for a 3-6 month bearish speculation will be very attractive IF the
market makes new highs around mid-April, because at that point all of the
proverbial ducks (optimistic sentiment, high valuations, extended price action
on every timescale and the PC Model) will be lined up and pointing to a
substantial decline. This will especially be the case if there has been
sufficient strength to push the SPX up to the top of the channel drawn on the
following daily chart.

This week's
important US economic events
| Date |
Description |
| Monday Mar 24 |
No important events scheduled | | Tuesday
Mar 25 |
New Home Sales
Case-Shiller Home Price Index
Consumer Confidence
Richmond Fed Mfg Index | | Wednesday
Mar 26 |
Durable Goods Orders | | Thursday
Mar 27 |
Q4 GDP (revised)
Pending Home Sales
Kansas City Fed Mfg Index
|
| Friday Mar 28 |
Personal Income and Spending
Consumer Sentiment |
Gold and
the Dollar
Gold
The Fundamentals
"Mixed" is still the best way to describe gold's fundamentals, which is normal
for the early part of a new bull market. Here's a quick rundown:
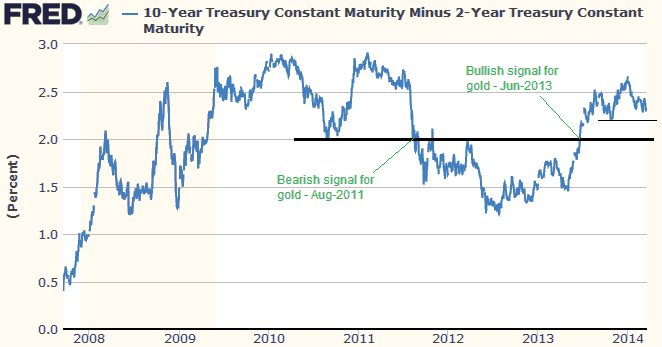
1) The US yield-spread, measured as the difference between the yield on the
10-year T-Note and the yield on the 2-year T-Note, is the only important
fundamental gold driver that is definitively bullish at this time. As
illustrated by the chart displayed below, the yield-spread generated a bullish
signal when it broke out to the upside in June of 2013.
Note that the yield-spread was also the first important fundamental gold driver
to turn bullish during 2000-2002.
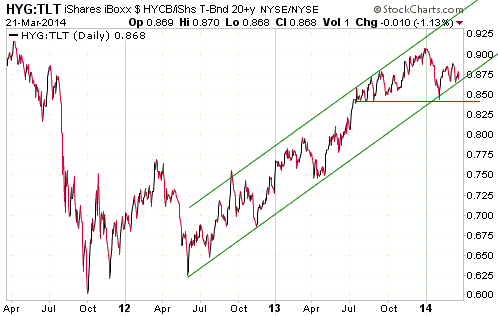
2) Credit spreads, measured in our case via the HYG/TLT ratio (junk bonds
relative to Treasury bonds), are neutral for gold. The reason is that HYG/TLT
remains within the upward-sloping channel that began to form in H1-2012 (refer
to the following chart for details), indicating that credit spreads haven't yet
commenced a widening trend (a rising trend in HYG/TLT indicates a narrowing
trend in credit spreads). Note, though, that HYG/TLT's most recent peak was at
the end of December. This means that while HYG/TLT hasn't yet signaled a trend
reversal, it also hasn't confirmed the new highs made by the US stock market
since the beginning of this year. This non-confirmation is why we define the
credit-spread indicator as neutral rather than bearish.
By the way, the combination of the two fundamental indicators mentioned above
can be thought of as a measure of economic confidence. When credit and yield
spreads are widening it means that economic confidence is declining (bullish for
gold).
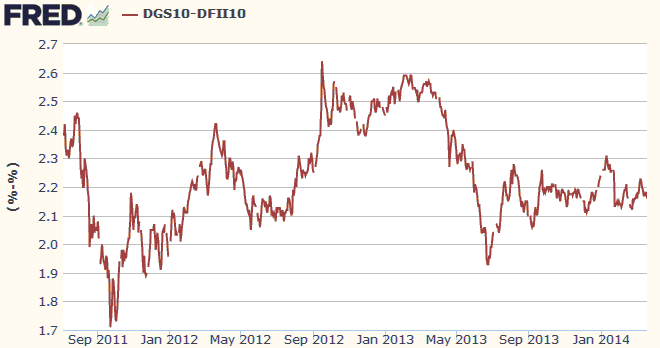
3) Inflation expectations, measured in this case as the difference between the
yield on the 10-year T-Note and the yield on the 10-year TIPS (Treasury
Inflation-Protected Security), were very bearish for gold during the first half
of last year and are now slightly bearish for gold. They were very bearish
during the first half of last year because, as illustrated below, they fell
sharply despite the Fed's efforts to promote "inflation". They have since been
stable at a low level.
Note that gold is capable of rallying in the face of declining inflation
expectations, but only when other fundamentals are bullish. Our view is that
"inflation" will not be widely viewed as a problem until 2015 or later, but gold
will trend upward due to declining economic confidence.
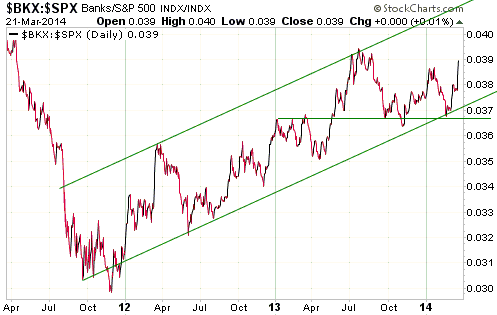
4) The relative strength of the banking sector, indicated on the following chart
by the BKX/SPX ratio, peaked last July but hasn't yet signaled a downward
reversal. This indicator would turn bullish via a break below the February-2014
low and bearish via a break above the July-2013 high. It is presently
neutral-to-slightly-bearish for gold, having risen sharply over the past week.
5) The US dollar's performance on the foreign exchange market will remain
gold-neutral as long as the Dollar Index remains between 79 and 81.5. A
sustained break below 79 would turn this indicator gold-bullish and a sustained
break above 81.5 would turn it gold-bearish.
Current Market Situation
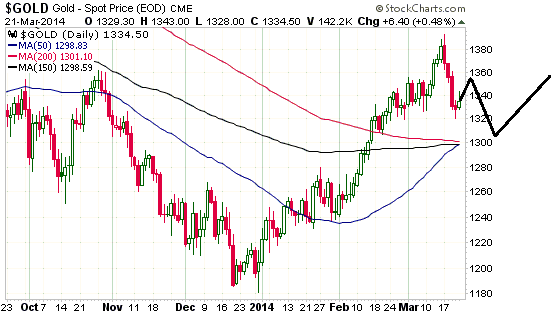
We are now going to do something we seldom do, which is draw lines on a chart to
show a potential path for the US$ gold price over the weeks immediately ahead.
We usually don't do this because it implies a level of predictability that
doesn't exist in the financial markets, but we are doing it in today's report to
show one way in which a normal correction could unfold.
Our chart suggests that last week's decline in the gold price was the first wave
of a 3-wave correction. (As an aside, we do not believe that Elliott Wave
analysis is useful as a practical trading/investing tool.) In this scenario, the
initial decline, which most likely bottomed at $1320.80 last Thursday, will be
followed by a rebound and then a decline to a new multi-week low to end the
correction. The confluence of moving averages at around $1300 remains a
realistic target.
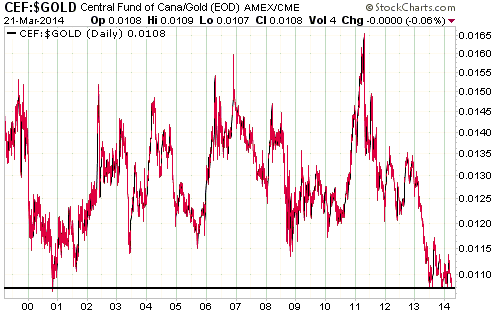
The CEF/gold ratio is a reliable long-term sentiment indicator for the gold
market. As sentiment becomes more pessimistic, CEF's premium to net asset value
(NAV) declines and silver weakens relative to gold, causing the CEF/gold ratio
to fall.
The following chart shows that the CEF/gold ratio has never been significantly
lower than it is right now. It is now as low as it was at last year's price lows
and at the end of gold's secular bear market in late-2000. In other words, what
currently looks like nothing more than a routine pullback within an upward trend
has driven the public's sentiment back to levels that have only ever been seen
near major price lows. This supports our opinion that gold will not do much
worse than drop to around $1300 before resuming its advance.
Gold Stocks
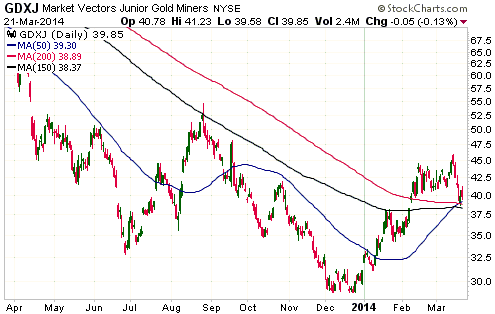
The following daily chart shows that last week's price action took the Junior
Gold Miners ETF (GDXJ) down to a confluence of moving averages. The HUI and the
XAU are in similar positions, although to match GDXJ the HUI will have to drop
to the high-220s (last week's low was 233) and the XAU will have to drop to 95
(last week's low was 97).
The future is never certain, but on a risk versus reward basis the current
situation in the gold-mining sector is about as good as it gets for new buying
by investors with a time horizon of at least 6 months. The reason is that the
sector is probably nearing the end of the first significant pullback of a very
young bull market.
There is ample evidence that a new bull market has begun, but nervousness on the
part of many participants in the sector has quickly led to excellent
opportunities for new buying. We won't be surprised if 'corrective' activity
continues for another one or two weeks, but the overall buying opportunity
probably won't get a lot better than it is right now.
Currency Market Update
The Dollar Index
If there were a Dollar Anti-Trust Action (DATA) Committee, this is how its
assessment of last week's market action would read:
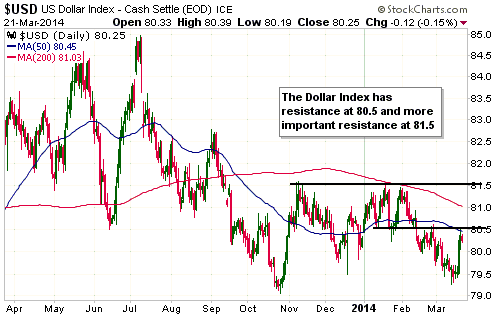
"Last week the Fed suggested that interest rates would start being hiked much
sooner than most people were expecting. This caused the Dollar Index to rise
quickly to resistance at 80.5, but then the Dollar Cartel went into action. The
Dollar's gains were capped. It wasn't allowed to generate a bullish signal by
closing the week above 80.5. Instead, it was pushed back to 80.2.
The Dollar's fundamentals could not be more bullish. The Fed is scaling down its
QE, the US stock market is outperforming all other markets, US government bond
yields are higher than German government bond yields, the US economy is
outperforming most national economies in Europe, the Ukraine situation is
creating great risk for many European countries due to the reliance of these
countries on Russian natural gas, and now the Fed is hinting at an earlier start
to its rate-hiking. And yet, the Dollar Index can't seem to get out of its own
way! Nothing matters these days except what the Cartel wants. Could the
manipulation be any more blatant?
We point out time and time again how the dollar is continually under attack and
its upward moves limited to a few points regardless of how bullish the news, but
nobody listens!
The Dollar Cartel remains in control for now, but it won't last. At some point
this year the Cartel will lose control and the Dollar will go to the moon! To
the moon, we tell you, to the moon, while the Dollar Cartel gets carried out on
a stretcher!"
In all seriousness, the US$ does have a fair amount going for it right now. This
makes it interesting that the Dollar Index was unable to break above minor
resistance at 80.5 during the hours/days following last week's Fed news.
The most important nearby resistance for the Dollar Index lies at 81.5. We think
that the Dollar Index stands a better chance of making a sustained break below
79 than a sustained break above 81.5, although neither are likely to occur in
the next few weeks.
The Yen
The Yen continues to trade as a safe haven. It rallied during January in
parallel with broad-based stock market weakness and has since consolidated in
parallel with stock market strength. It should rally again when the stock market
turns down. In fact, it will probably surprise most people with its strength
during the next multi-month stock market decline.
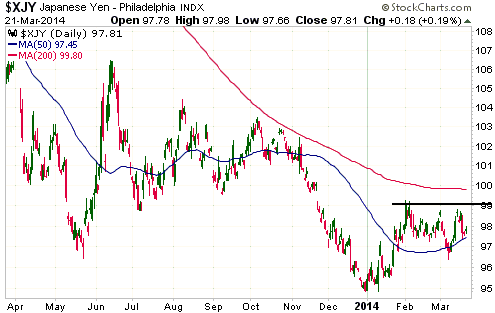
With reference to the following daily chart, the Yen has resistance at 99-100. A
daily close above 99 would be an early warning and a weekly close above 100
would leave little room for doubt that a tradable rally had begun.
Updates
on Stock Selections
Notes: 1) To review the complete list of current TSI stock selections, logon at
http://www.speculative-investor.com/new/market_logon.asp
and then click on "Stock Selections" in the menu. When at the Stock
Selections page, click on a stock's symbol to bring-up an archive of
our comments on the stock in question. 2) The Small Stock Watch List is
located at http://www.speculative-investor.com/new/smallstockwatch.html
 Company
news/developments for the week ended Friday 21st March 2014: Company
news/developments for the week ended Friday 21st March 2014:
[Note: AISC = All-In Sustaining Cost, FS = Feasibility Study, IRR =
Internal Rate of Return, MD&A = Management Discussion and Analysis,
M&I = Measured and Indicated, NAV = Net Asset Value, NPV(X%) = Net
Present Value using a discount rate of X%, P&P = Proven and
Probable, PEA = Preliminary Economic Assessment, PFS =
Pre-Feasibility Study]
*Endeavour Mining (EDV.TO, EVR.AX) issued its mandatory reports
(financial statements and MD&A) for the quarter and year ended 31st
December 2013.
A lot of the salient information in these reports, including 2013
production results and 2014 guidance, had been provided in earlier
press releases. With regard to the new information of note, the
financial statements revealed that the company had net debt of
around $209M at the end of last year. This constitutes an $82M
increase during the final quarter due to accelerated spending on the
construction/commissioning of the new Agbaou gold mine and the
purchase of new mining equipment at the Tabakoto operation as part
of the conversion from contractor mining to owner mining.
Like most gold-mining companies, the lower gold price prompted EDV
to substantially reduce the accounting value of its assets. The
total after-tax impairment was $362M. After this impairment, EDV's
shareholder equity was C$1.94/share.
With the bulk of its growth-related capital expenditure behind it,
EDV should now be adding cash to its balance sheet.
*Lydian International (LYD.TO), in a slightly confusing press
release, announced that it was raising an additional $4.7M by
issuing new shares to two of its current investors at C$1.00/share.
The two investors are International Finance Corp. (IFC), a member of
the World Bank group, and European Bank for Reconstruction and
Development (EBRD).
It wasn't clear from the press release, but this additional share
issuance appears to be related to old agreements that enable IFC and
EBRD to maintain their percentage ownership of the company. If this
is the case, the $1.00/share equity financing completed by LYD last
month gave these two investors the right to purchase enough shares
at the same financing price to prevent their stakes from being
diluted. This would explain why LYD is now emitting more shares at
C$1.00 when the recent price action suggests that there is ample
demand for the shares in the C$1.30s (LYD's price rose from C$1.31
to C$1.38 last week in the face of sizeable declines in the
gold-stock indices).
*Pilot Gold (PLG.TO) issued its mandatory reports (financial
statements and MD&A) for the quarter and year ended 31st December
2013.
The financial statements revealed that the company had about $18M of
working capital at the end of last year. Allowing for spending since
the end of last year and the $23M now being raised via an equity
financing, PLG should end this quarter with about $36M of working
capital. The company therefore appears to be fully funded for at
least the next 18 months.
*UEX Corp. (UEX.TO) issued its mandatory reports (financial
statements and MD&A) for the quarter and year ended 31st December
2013. The financial statements revealed that the company had about
$9M of working capital at the end of last year, which should mean
that it is fully funded for the next 12 months.
 List
of candidates for new buying List
of candidates for new buying
From within the ranks of TSI stock selections, the best candidates for new
buying at this time are:
1) AAU (last Friday's closing price: US$1.40).
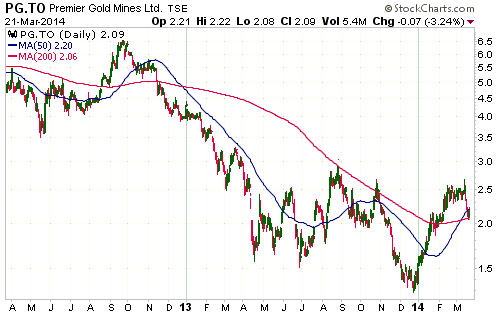
2) PG.TO (last Friday's closing price: C$2.09). As illustrated by the chart
displayed below, PG has dropped back to its 200-day MA. This doesn't guarantee
that the stock has bottomed, but it means that the short-term downside risk has
been substantially reduced.
3) PLG.TO (last Friday's closing price: C$1.53). The C$1.53/share financing
announced during the week before last prevented PLG's share price from
responding appropriately to the exceptional Kinsley Mountain drilling results,
leading to a new buying opportunity.
4) RIOM (last Friday's closing price: US$1.92). At current prices this is
probably the single best candidate for new buying, but, as always, what YOU do
should depend on your own situation.
Chart Sources
Charts appearing in today's commentary
are courtesy of:
http://stockcharts.com/index.html
http://research.stlouisfed.org/
http://www.bloomberg.com/
http://bigcharts.marketwatch.com/

|

