|
-- Weekly Market Update for the Week Commencing 24th May 2010
Big Picture
View
Here is a summary of our big picture
view of the markets. Note that our short-term views may differ from our
big picture view.
In nominal dollar terms, the BULL market in US Treasury Bonds
that began in the early 1980s will end by mid-2010. In real (gold)
terms, bonds commenced a secular BEAR market in 2001 that will continue
until 2014-2020. (Last
update: 09 February 2009)
The stock market, as represented by the S&P500 Index, commenced
a secular BEAR market during the first quarter of 2000, where "secular
bear market" is defined as a long-term downward trend in valuations
(P/E ratios, etc.) and gold-denominated prices. This secular trend will bottom sometime between 2014 and 2020. (Last update: 22 October 2007)
A secular BEAR market in the Dollar
began during the final quarter of 2000 and ended in July of 2008. This
secular bear market will be followed by a multi-year period of range
trading. (Last
update: 09 February 2009)
Gold commenced a
secular bull market relative to all fiat currencies, the CRB Index,
bonds and most stock market indices during 1999-2001. This secular trend will peak sometime between 2014 and 2020. (Last update: 22 October 2007)
Commodities,
as represented by the Continuous Commodity Index (CCI), commenced a
secular BULL market in 2001 in nominal dollar terms. The first major
upward leg in this bull market ended during the first half of 2008, but
a long-term peak won't occur until 2014-2020. In real (gold) terms,
commodities commenced a secular BEAR market in 2001 that will continue
until 2014-2020. (Last
update: 09 February 2009)
Copyright
Reminder
The commentaries that appear at TSI
may not be distributed, in full or in part, without our written permission.
In particular, please note that the posting of extracts from TSI commentaries
at other web sites or providing links to TSI commentaries at other web
sites (for example, at discussion boards) without our written permission
is prohibited.
We reserve the right to immediately
terminate the subscription of any TSI subscriber who distributes the TSI
commentaries without our written permission.
Outlook Summary
Market
|
Short-Term
(0-3 month)
|
Intermediate-Term
(3-12 month)
|
Long-Term
(1-5 Year)
|
Gold
|
Bullish
(12-Apr-10)
|
Bullish
(12-May-08)
|
Bullish
|
US$ (Dollar Index)
|
Bearish
(19-May-10)
| Bullish
(02-Nov-09)
|
Neutral
(19-Sep-07)
|
Bonds (US T-Bond)
|
Neutral
(17-May-10)
|
Bearish
(14-Dec-09)
|
Bearish
|
Stock Market (S&P500)
|
Neutral
(09-May-10)
|
Bearish
(11-May-09)
|
Bearish
|
Gold Stocks (HUI)
|
Neutral
(19-Apr-10)
|
Neutral
(16-Sep-09)
|
Bullish
|
| Oil | Neutral
(28-Oct-09)
| Bearish
(01-Mar-10)
| Bullish
|
Industrial Metals (GYX)
| Bearish
(21-Sep-09)
| Bearish
(25-May-09)
| Neutral
(11-Jan-10)
|
Notes:
1. In those cases where we have been able to identify the commentary in
which the most recent outlook change occurred we've put the date of the
commentary below the current outlook.
2. "Neutral", in the above table, means that we either don't have a
firm opinion or that we think risk and reward are roughly in balance with respect to the timeframe in question.
3. Long-term views are determined almost completely by fundamentals,
intermediate-term views by giving an approximately equal weighting to
fundamental and technical factors, and short-term views almost
completely by technicals.
The post-bubble recriminations ramp up
Apart from the tiny fraction
of the US population that understands economics, everyone was content
while the private-sector credit bubble was inflating. The Fed chairman
was hailed as a "maestro" for keeping interest rates at artificially
low levels and thus ensuring that the prices of most investments --
especially high-risk investments -- remained on upward paths, while
politicians of all stripes were happy that the market for home
mortgages was the greatest 'beneficiary' of the Fed-sponsored inflation
of money and credit. Actually, politicians didn't leave much to chance,
in that regulations were passed to encourage the provision of
mortgage-related credit to anyone with a pulse and government-sponsored
enterprises (Fannie Mae, etc.) worked tenaciously to increase both the
supply of and the demand for mortgages. The banking industry played its
part to the hilt by inventing new ways to expand credit (think:
Residential Mortgage-Backed Securities and Collateralised Debt
Obligations), but it is important to understand that the banks would
not have had an incentive to create these new credit-related products
unless there existed huge demand for such products. The demand came
from large investors -- hedge, bond and pension funds, for example --
that were desperately searching for yield in a world where yields had
been kept artificially low by various central bank and government
manipulations.
The main problem with credit bubbles is that they result in a massive
transfer of resources to activities that would not be economically
viable in the absence of the artificially low interest rates and the
monetary inflation. Consequently, although they temporarily create the
feeling of prosperity, they deplete real savings and lessen the
economy's long-term growth potential. The recession or depression that
inevitably follows the bursting of a credit bubble is caused by the
ill-conceived investments made during the bubble rather than by the
bursting of the bubble itself. Think of it this way: once the bubble
bursts and the supply of new credit is curtailed, a light is suddenly
shone upon the terrible mistakes that were made during the bubble.
During the giant credit bubble that ended in 2007, the banking industry
made more than its fair share of investing errors and was thus
eventually left with enormous holes in its collective balance sheet.
Some of the largest US banks should have gone under, which would have
resulted in the holders of bank equity losing all of their money and
the holders of bank bonds losing most of their money. It would NOT,
however, have resulted in bank depositors losing any of their money or
in the cessation of the traditional banking businesses (the taking of
deposits and the making of loans). Unfortunately, the government deemed
that the banks were "too big to fail", and arranged for hundreds of
billions of dollars to be siphoned from the rest of the economy to
prevent the large banks from collapsing. Note that the banks were not
actually "too big to fail". They should have failed, and the US economy
would be in far better shape today if they had.
Further to the above, the banks certainly played a role in creating the
current mess, but it was a supporting role. The lead roles were played
by the government and the Fed. However, now we have the ridiculous
situation of US policy-makers passing legislation
that grants themselves greater power and crimps the activities of the
banks, with the stated aims of mitigating the risk of another financial
crisis and preventing banks from becoming "too big to fail". If they
are serious about mitigating the risk of another financial crisis then
they should pass legislation that abolishes the Fed and severely crimps
the activities of the government.
The attacks on the banks are nothing if not predictable. Throughout
history the ends of giant credit bubbles have invariably been followed
by periods of recrimination, when politicians looked around for someone
other than themselves to blame. In the current case the banking
industry is the most logical target because it is blatantly obvious
that the large banks have profited handsomely at the expense of
taxpayers over the past 18 months. But isn't it bizarre that the finger
of blame is being self-righteously pointed at the banks by the very
same people who arranged or approved the gargantuan wealth transfer
from taxpayers to banks?
Copper
In the 19th April Weekly Update, we wrote:
"Over the past year we
have grossly under-estimated the upside potential of the industrial
metals markets in general and the copper market in particular. We
correctly anticipated strong post-crash rebounds, but the rebounds have
gone on much longer and reached much higher levels than we thought they
would.
After the fact it is
usually easy for us to figure out why we under-estimated a market's
upside or downside potential, but this isn't the case when it comes to
the performances of copper and the industrial metals over the past 9
months. The reason is that prices have been rising in apparent defiance
of bearish supply/demand fundamentals. In particular, the prices of
these commodities have been rising in parallel with large increases in
inventory levels."
We went on to suggest that the increasing supply of physical copper had
been more than offset by increasing demand for copper futures, which,
in turn, was likely linked to surging optimism about the global
economy's growth prospects. We concluded as follows:
"We think that this
optimism [about global economic growth] is misplaced, and, by
extension, that there is large downside potential in the industrial
metals markets. As things currently stand, however, we are lacking
price-related evidence that this potential energy is about to be
transformed into kinetic energy."
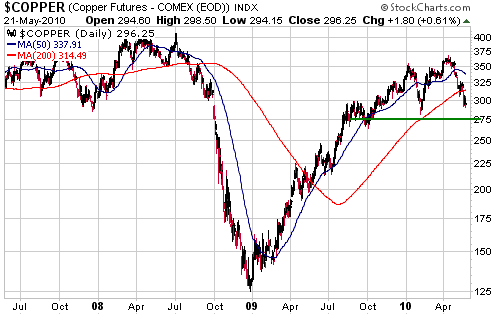
Some price-related evidence in support of our bearish outlook has since
emerged, in that the copper price has quickly moved down from the
$3.70s to the $2.90s. Refer to the following daily chart for details.
This, we think, will prove to be the first leg of a downward trend that
will continue until the final quarter of this year, at which time we
may be presented with a good opportunity to buy copper and the stocks
of copper miners.
The Stock
Market
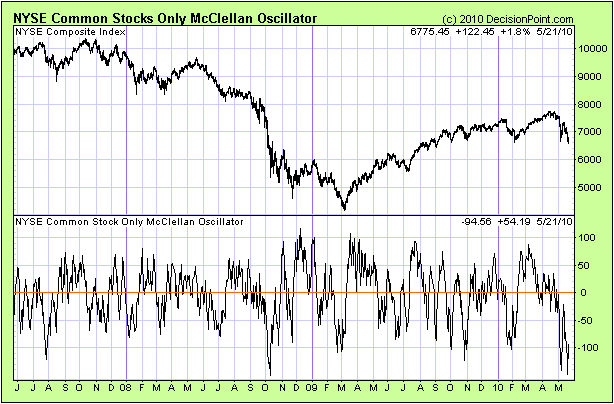
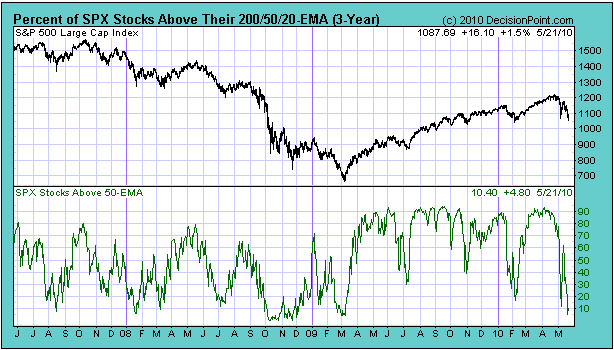
In the email alert sent in response to last Thursday's market action, we said: "With
regard to the broad stock market, some technical indicators have
returned to the extremes of 6th-7th May, which, in turn, were similar
to the extremes reached between October of 2008 and March of 2009. This
means that there should be an upward reversal within the coming three
trading days."
The technical indicators we had in mind were the NYSE McClellan
Oscillator (MO) and the percentage of S&P500 stocks trading above
their respective 50-day moving averages. Charts of these indicators are
displayed below. It is also worth mentioning that the VIX has surged to
the mid-40s. This is well below its October-2008 peak, but prior to
2008 a rise in the VIX to near its current level usually coincided with
a significant price low.
One thing we have
sensed over the past 12 months is declining interest in the stock
market on the part of the average non-professional investor. It seems
that the sudden and dramatic changes of 2007-2008 caused many members
of the investing public to realise that holding stocks "for the long
run" could be a bad idea. Consequently, people who as recently as two
years ago viewed the stock market as one of the surest ways to build
wealth now view it with suspicion. Rather than looking for
opportunities to invest more money in stocks, they are focused on
increasing their cash savings. This, we think, could explain why the
stock market now becomes so 'oversold' so quickly. Long-term
'buy-and-holders' have a diminishing presence, leaving short-term
traders with greater influence.
Our expectation since the beginning of this year has been that 2010
would roughly adhere to the average for the second year of the
Presidential Cycle, meaning an upward bias through to April followed by
a downward trend through to early October and then a rebound into
year-end. Such a pattern appealed to us because it meshed with the idea
that by the second quarter of this year there would be undeniable
evidence that the economic rebound had ended.
Up until now the US stock market has followed the Presidential Cycle
pattern as closely as could reasonably be expected, and we see no good
reason to believe that it won't continue to do so. The fact that the
S&P500 traded below its 6th May intra-day low on Friday supports
this view by confirming that there was more to the spectacular 6th May
plunge than a simple error. Note, though, that even if the market is
destined to make an important low in October, it could get from here to
there via a number of very different routes. One possibility is that
the market will 'stair-step' its way downward via a sequence of lower
highs and lower lows over the coming 4-5 months, while a less
straight-forward possibility is that the next rebound (the one that
follows the current phase of the decline) will take the indices all the
way back to their April highs. The market is certainly 'oversold'
enough to enable a substantial rebound.
This week's
important US economic events
| Date |
Description |
Monday May 24
| Existing Home Sales
| | Tuesday May 25 | Case-Shiller Housing Price Index
Consumer Confidence
| | Wednesday May 26
| Durable Goods Orders
New Home Sales
| | Thursday May 27
| Q1 GDP (revised)
| | Friday May 28
| Personal Income and Spending
Chicago PMI
Consumer Sentiment
|
Gold and
the Dollar
Gold
The June gold futures contract tested support at $1160-$1170 on Friday.
This is as low as it should go IF the short-term upward trend is intact.
In A$ terms, gold
hasn't made a new high this year. However, the following chart suggests
that gold/A$ remains in a long-term bull market. We expect that it will
make a new high before year-end, courtesy, in part, to weakness in the
A$.
Since 1990 (the
period covered by the following chart), the gold/silver ratio has
generally reflected the central-bank-driven boom/bust cycle.
Specifically, the ratio has worked its way downward (gold has
under-performed silver) during the booms and worked its way upward
(gold has outperformed silver) during the busts.
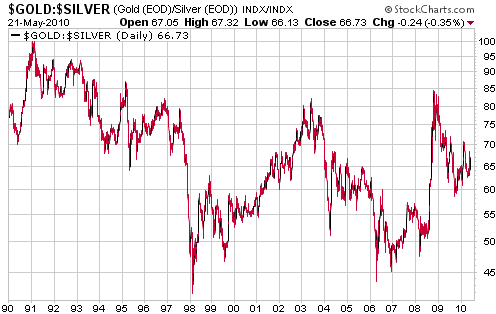
We hope that things
don't get bad enough over the years ahead to push the gold/silver ratio
into triple digits, but they could. A triple-digit gold/silver ratio
isn't probable, but it is possible. This is why we continue to advocate
-- as we have consistently done over the past decade -- that investors
substantially overweight gold relative to silver in their portfolios.
The argument in silver's favour is that it is a much smaller market
than gold and at some point should therefore benefit to an even greater
extent than gold from the general flight away from paper money. Of
particular importance is the fact that the monetary value of silver's
aboveground supply (in readily saleable form) is a tiny fraction of the
monetary value of gold's aboveground supply.
Under certain conditions, however, the relatively small size of its
market could work against silver. By way of further explanation,
consider that if John Smith, a successful plumber, wants to buy $10,000
of precious metal as a store of value then he could opt for either gold
or silver, but if John Paulson, a successful large speculator, wants to
buy $10,000,000,000 ($10B) of precious metal as store of value then he
must opt for gold (because gold is the only precious-metal market of
sufficient size to handle such large changes in demand). Regardless of
what happens there will always be some speculators with massive amounts
of money to invest.
Gold Stocks
In the email sent to subscribers following last Thursday's plunge in the gold sector, we wrote:
"It's amazing what a
difference four trading days can make. In the latest Weekly Update we
noted that the HUI was 'overbought' (it was at the very top of its
moving-average envelope and its daily RSI had just turned down from a
high level), but just four trading days later it is already close to
being 'oversold' on a short-term basis. This is thanks to a quick 12%
decline.
This week's action
confirms that the gold sector made an important peak earlier this month
and is consistent with our expectation that the intermediate-term
correction that got underway on 2nd December of 2009 will continue
until October of this year. Of course, it won't continue in a straight
line, and as noted above the HUI is almost 'oversold' on a short-term
basis."
The following daily chart shows the HUI's rapid decline from the 490s
to support in the 420s. It also shows that the daily RSI, which was
above 70 during the week before last, has dropped to 40.
Friday's downward spike to 420 probably created a low that will hold for at least 1-2 weeks.
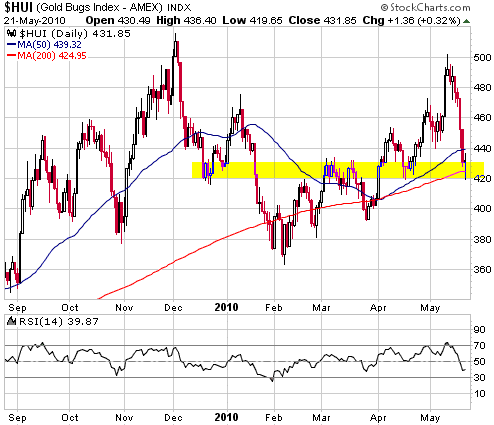
The gold sector's
correction probably won't end until October, but the speed of the
recent downturn opens up the possibility that the correction's price
low will be put in place as soon as next month. Under this scenario,
the October low would be a test of the June-July low, which would,
itself, quite likely be a test of the February low.
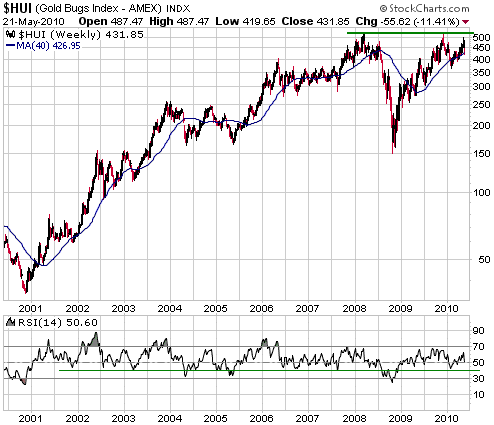
The next chart shows the big picture. Specifically, it shows the HUI's
progress on a weekly basis since the beginning of its long-term bull
market.
Charts tell you what has happened in the past, not what will happen in
the future. Future performance will be determined by fundamental
factors and the extent to which those factors are discounted by current
prices. For example, if we thought that governments and central banks
were going to stop implementing policies that destroyed savings and the
purchasing power of money, or that the likely extent of future
policy-related damage had been fully discounted by the financial
markets, then we would interpret the HUI's long-term chart as a giant
"double top". However, what we actually think is that the policies of
governments and central banks will get worse before they get better,
and that the financial markets haven't yet come close to discounting
the likely policy-related damage. We therefore interpret the HUI's
price action from early-2008 through to the present as a giant base
formation. Our best guess, at this time, is that the HUI will break
upward from its base during the first half of 2011.
Finally, the RSI at the bottom of the following weekly chart suggests
that the HUI is still some distance from being 'oversold' on an
intermediate-term basis. We expect that the weekly RSI will drop to 40
or lower before the end of the correction.
Currency Market Update
The Euro
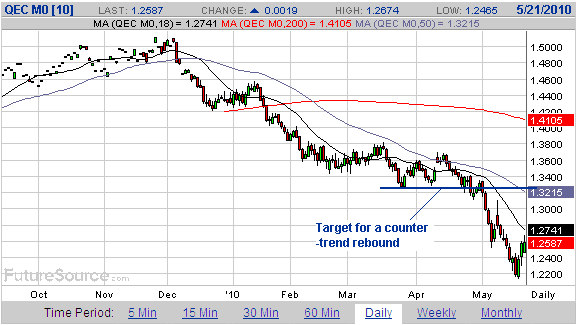
The anti-euro trade became extremely overcrowded, so now the euro is
rebounding as speculators lock-in gains. This rebound could last 1-2
months and take the euro back to resistance in the low-1.30s, but we
doubt that it will do any more than that.
The Australian Dollar
From the 8th March 2010 Weekly Update:
"...we think this
currency [the A$] has almost as much downside risk today as it had two
years ago, for the same reason (it has been pushed up to a dangerously
high level by speculative/investment demand prompted by a rally in
commodity prices). Perhaps it will do what it did during 2008 and
continue to grind upward for a few more months before succumbing to the
weight of its over-valuation, but we wouldn't bet on it.
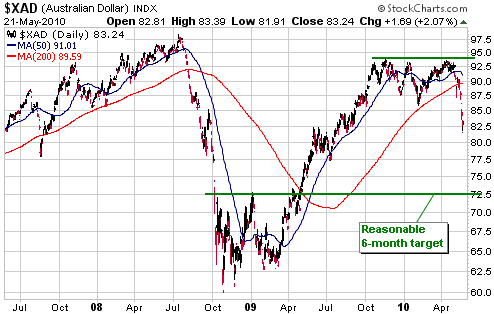
The following chart shows
that the A$ has had a slight downward bias since peaking late last
year. If industrial commodity prices remain firm and the US stock
market moves to a new 52-week high over the next few weeks then the A$
could move up to around 0.95, but there's a good chance that it will be
trading a long way below its current level by the final quarter of this
year."
The A$ ended up peaking at around 0.93 last month and has since dropped
to 0.82 (see chart below). It could rebound over the next few weeks in
parallel with rebounds in the prices of equities and industrial
commodities, but is likely to trade much lower before year-end.
As an aside, gold mining companies with operations in Australia will benefit from a decline in the A$.
Update
on Stock Selections
(Notes: 1) To review the complete list of current TSI stock selections, logon at http://www.speculative-investor.com/new/market_logon.asp
and then click on "Stock Selections" in the menu. When at the Stock
Selections page, click on a stock's symbol to bring-up an archive of
our comments on the stock in question. 2) The Small Stock Watch List is
located at http://www.speculative-investor.com/new/smallstockwatch.html)
 Buying Opportunities Buying Opportunities
A good opportunity to buy gold-stock ETFs such as GDX and GDXJ hasn't
yet arrived, but it is not too early for cash-rich speculators to be
thinking about accumulating individual gold and silver stocks at the
junior end of market. To mitigate risk, the buying should be spread
over the several months.
As a general guideline, buying should be focused on stocks that are
near, or below, their 200-day moving averages. In alphabetical order,
some TSI stocks to consider at this time are: CAH.AX, CFO.V, DOM.AX,
EDV.TO (or the EDV warrants - EDV.WT.A), FVI.TO, MFN, NXG, PEZ.TO, and
RSG.AX.
 Khan Resources (TSX: KRI). Recent price: C$0.23 Khan Resources (TSX: KRI). Recent price: C$0.23
CNNC withdrew its bid for KRI late last week, causing KRI's stock price
to plummet on Friday. Although this wasn't the reason cited, the actual
reason for the withdrawal of CNNC's bid was most likely the uncertainty
regarding KRI's ownership of the Dornod uranium project in Mongolia.
This uncertainty has been caused by the blatant attempts of a Russian
company to gain control of the project by political means.
There has been a surprisingly large reduction in KRI's cash position
over the past 6 months, but the amount of cash on the balance sheet
still amounts to about C$0.24/share. The value of a KRI share is now
equal to this cash plus an option on the efforts of KRI's management to
either re-establish rights to the Dornod project or obtain compensation
for losing these rights. At the current stock price speculators would
essentially be getting the aforementioned option for free.
If this situation had arisen a few weeks ago we would have suggested
buying KRI at or below cash value as a gamble on the likelihood that
there will end up being some monetary compensation for loss of its
Dornod stake, but thanks to recent market action there is now more
speculative merit to be found elsewhere. In particular, it doesn't make
sense to deploy new capital in a high-risk uranium venture when
relatively low-risk gold mining companies are going on sale.
Lastly, KRI's predicament underlines the risk of doing business in
Mongolia. We will take this into account before buying or recommending
any other mining stocks with substantial assets in Mongolia.
Chart Sources
Charts appearing in today's commentary
are courtesy of:
http://stockcharts.com/index.html
http://www.futuresource.com/
http://www.decisionpoint.com/

|

