


--
Weekly Market Update for
24th June 2019
Big Picture
View
Here is a summary of our big picture
view of the markets. Note that our short-term views may differ from our
big picture view.
The BULL market in US Treasury Bonds
that began in the early 1980s ended in mid-2016, but there will be many years
of topping action in bond prices and bottoming action in bond yields before
major new trends get underway. A major decline in government bond prices will
unfold during the 2020s. (Last update: 11 September 2017)
The stock market, as represented by the S&P500 Index,
commenced
a secular BEAR market during the first quarter of 2000, where "secular
bear market" is defined as a long-term downward trend in valuations
(P/E ratios, etc.), gold-denominated prices and inflation-adjusted prices. This secular trend will bottom
in 2020 or later.
(Last update: 11 September 2017)
A cyclical BEAR market in the
US
Dollar
began in 2016-2017.
(Last
update: 11 September 2017)
Gold commenced a
secular bull market relative to all fiat currencies, the CRB Index,
bonds and most stock market indices during 1999-2001.
This secular trend will peak in 2020
or later.
(Last update: 11 September 2017)
Commodities,
as represented by the CRB Index, commenced a
secular BULL market in 2001 in nominal dollar terms. The first major
upward leg in this bull market ended during the first half of 2008, but
a long-term peak won't occur until 2020 or later.
(Last
update: 11 September 2017)
Copyright
Reminder
The commentaries that appear at TSI
may not be distributed, in full or in part, without our written permission.
In particular, please note that the posting of extracts from TSI commentaries
at other web sites or providing links to TSI commentaries at other web
sites (for example, at discussion boards) without our written permission
is prohibited.
We reserve the right to immediately
terminate the subscription of any TSI subscriber who distributes the TSI
commentaries without our written permission.
True
Fundamentals Summary
[Notes:
1) The date shown next to the current True Fundamentals Model (TFM) signal is
when the most recent change occurred. 2) Charts of the Gold and Equity
TFMs are included in the "Charts and Indicators" section of the TSI web
site]
|
Market |
True Fundamentals Model (TFM) |
|
Gold (US$ Price) |
Bullish (04 Jan 2019) |
|
US Equity (SPX) |
Bearish (19 Apr 2019) |
|
Currency (Dollar Index) |
Neutral (15 Mar 2019) |
|
Commodities (GNX) |
Bearish (01 Jun 2018) |
Last week's posts at the TSI Blog
There were no blog posts last week.
Summary of current
thinking/positioning
1) The Dollar Index (DX) has
commenced a downward trend, but it could be a few months before the new
trend becomes consistent. In the meantime the price action could be
choppy, beginning with a counter-trend rebound that kicks off within the
next two weeks.
2) The US$ gold price went straight to a 5-year
high (above $1377) without any intervening correction. Significant
additional gains are likely within the next three months, but a test of
last week's upside breakout probably will occur within the next three
weeks. The US$ silver price stands a good chance of making a catch-up move
over the months immediately ahead.
3) The gold-mining indices/ETFs
have blown through resistance levels and signaled that we are dealing with
intermediate-term upward trends rather than counter-trend reactions.
However, on a short-term basis they are now as 'overbought' as they ever
get, so a correction should begin soon.
4) The SPX made a marginal
new all-time high last week. The new high was not confirmed by other stock
indices and does not affect our view that a significant decline will get
underway by mid-July at the latest.
5) An upside blow-off has set
the stage for a large T-Bond decline. The decline should begin by early
July at the latest.
6) Oil's correction is probably very close to
complete, at least in terms of price, although stock market weakness
during July-August could push the oil price to a new multi-month low.
7) We are holding a cash reserve of 25%-30%.
The coming T-Bond
decline
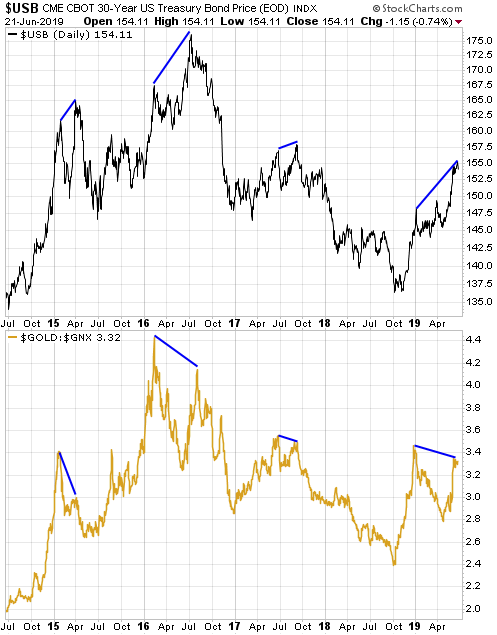
A large divergence between two
fundamentally-correlated market prices is important because such a
divergence usually will be closed via a big move in one or both prices.
However, divergences sometimes build for an inconveniently long time
before they start to matter.
The gold/commodity ratio (the US$ gold
price divided by the GSCI Spot Commodity Index) and the T-Bond are
strongly correlated over the long term. They also tend to be well
correlated over shorter timeframes, but significant short-term divergences
sometimes occur. One such divergence has been developing since the
beginning of this year, with the T-Bond making a sequence of higher highs
while the gold/commodity ratio stays below its late-December high. Note
that even last week's impressive up-move and break to a new 5-year high by
the US$ gold price was not enough to push the gold/GNX ratio above its
late-December high.
The current divergence and previous similar
divergences (higher highs for the T-Bond in parallel with lower highs for
the gold/commodity ratio) are illustrated by the following chart. The
previous similar divergences led to large declines in the T-Bond price and
we can think of no reason to expect that it will be different this time.
Commodities
Oil confirms its double
bottom
A week ago we wrote that the oil price probably had
made a 'double bottom' that would hold for at least a few weeks. That
probability became a virtual certainty last week.
Last week the oil
price gained 9.4% and in doing so broke above resistance at $55. It has
moving-average resistance at $59-$60 that probably will limit the
near-term upside unless there is a further escalation of geopolitical
tension in Middle East.

Due to the strong positive correlation between the oil and stock
markets, there is still a risk that the oil price will breach its June low
before the overall correction is complete. However, market sentiment (as
indicated by the COT data) and fundamentals (as indicated by the oil
futures curve) are both supportive, so if there is a breach of the June
low it probably will be short-lived.
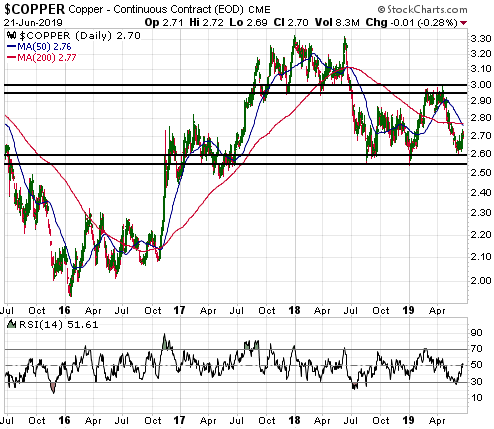
Copper Update
The copper price has spent the past 12 months oscillating between
support at $2.55-$2.60 and resistance at $2.95-$3.00. We won't be
surprised if it continues to 'chop around' aimlessly for up to three more
months, but the next substantial move is more likely to be higher than
lower.
Our intermediate-term bullish outlook for copper is based
more on macroeconomic factors and inter-market relationships than on
copper-specific supply/demand fundamentals. We think that inflation
expectations are bottoming and that the next 12 months will be
characterised by rising bond yields, a weakening US$ and strength in
late-cycle investments/speculations.
The Stock Market
The Fed and the "trade
war"
As we warned could happen a couple of weeks ago, the
S&P500 Index (SPX) has made a new all-time high. The buying pressure that
led to this new high was generated, at least in part, by optimism
regarding easier monetary policy and a cease-fire in the US-China "trade
war". Hope that the Fed will soon start cutting its targeted interest
rates was bolstered last week by strong hints from the Fed, while hope for
a US-China trade deal was rekindled by news that presidents Trump and Xi
will meet on the sidelines of the G20 meeting to be held in Osaka on June
28-30.
The best that can be reasonably expected from a trade deal
at this time is the removal of the tariffs put in place over the past
year, although if a deal is done it certainly will have other aspects. For
example, the Chinese government probably will agree to the purchase of
more US-produced agricultural and energy commodities, because they already
agreed to that a year ago, and commit to doing more to protect
"intellectual property rights", because it wouldn't cost them anything to
make such a commitment. They also could promise to maintain a stable
Yuan/US$ exchange rate, because they most likely see it as in their
interest to do so in order to minimise capital flight and reduce the costs
of imported goods. What they won't do (regardless of any promises to the
contrary) is slow the pace of the "Made in China 2025" program or the pace
at which China's sphere of influence is broadened via strategies such as
the "Belt and Road Initiative".
Ironically, if the stock market
gets what it wants on the international trade front then the chance of it
getting what it wants (and currently expects) from the Fed will be greatly
reduced. The reason is that the removal or scaling-back of the government
actions that are crimping international trade and depressing economic
growth will make a series of pre-emptive rate cuts seem less appropriate.
Therefore, we suspect that if a trade deal is done within the next few
weeks then the Fed either won't cut its targeted rate at the next FOMC
meeting (scheduled for end-July) or will make a 0.25% cut in July and use
words that imply a wait-and-see approach regarding further cuts. Putting
it another way, getting what the market currently expects from the Fed
over the next six months probably requires the continuation of the "trade
war".
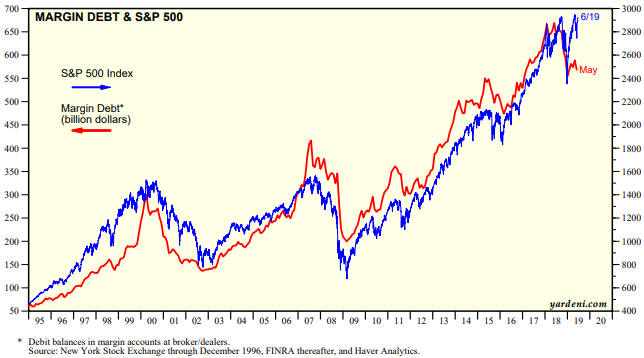
Is there any evidence of a bear market?
Late last year there were signs that US equities had commenced a
cyclical bear market, but most of these signs disappeared in January. One
long-term bearish sign that didn't disappear early this year and remains
in place today is the downward reversal in Margin Debt. The following
chart shows that last year's downward reversal in NYSE Margin Debt is
similar to the reversals that occurred around major price tops in 2000 and
2007. It also shows that Margin Debt did not recover with the SPX during
the first half of this year.
The measure of margin debt displayed above could be providing a
misleading signal, however, because it isn't adjusted for the size of the
market. In the same way that government-debt/GDP is a more meaningful
figure than government debt in nominal currency terms, to get a feel for
the extent of debt-based leverage in the stock market it probably makes
more sense to look at margin debt as a percentage of total stock market
capitalisation than to look at the dollar value of margin debt.
When margin debt is calculated relative to the overall market, a very
different picture emerges. The picture is shown below, using the
Wilshire5000 to represent the entire US stock market.
The following
chart shows that unlike 2007-2008 and 1999-2000, there was no surge in the
adjusted Margin Debt in the lead-up to last year's price top. Instead,
this measure of debt-based leverage was essentially flat during 2009-2017
and turned down without first rocketing upward. It is now at its lowest
level since 2005.
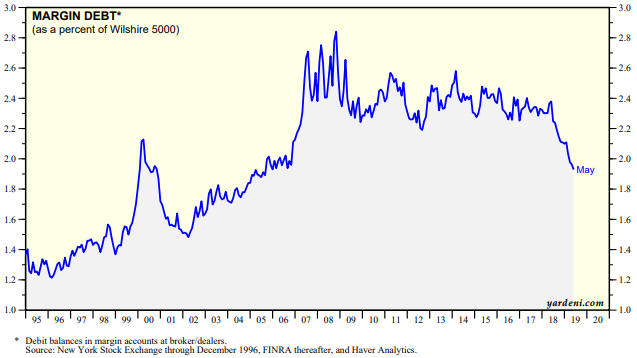
Note that the above charts were taken from
https://www.yardeni.com/pub/stmkteqmardebt.pdf.
Perhaps it is
different this time and a major price top has been put in place without a
preceding surge in the adjusted Margin Debt figure, but when we consider
all the evidence (more to the point: the absence of bear-market evidence)
we arrive at the conclusion that the cyclical bull market probably will
extend into 2020.
Current Market Situation
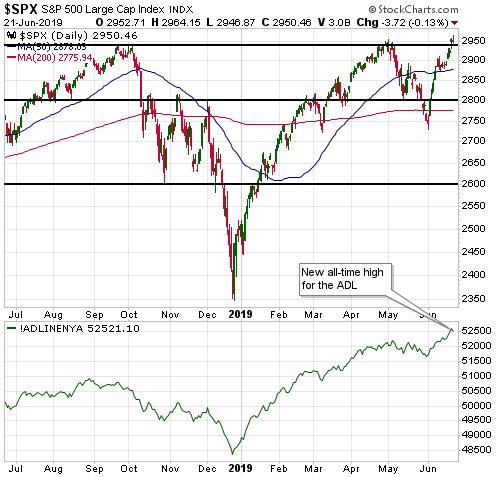
The following daily chart shows the new all-time high made late last week.
If this marginal new high had been accompanied by a bearish divergence in
the NYSE Advance-Decline Line (ADL) then, given that a put/call sell
signal is in effect, we now would be very enthusiastic about bearish stock
market speculations. However, the chart also shows that the ADL remains
very strong and actually led the SPX into new high territory. This tempers
our enthusiasm for bearish stock market bets, although we bought some SPY
September $270 put options late last week as much for hedging purposes (to
hedge exposure to non-gold commodity stocks) as for speculating purposes.
Aside from the put/call sell signal, the main reason to be concerned
at the moment about short-term downside risk is that most US stock indices
are not showing as much strength as the SPX. For example, the following
chart shows that the June rebound in the Dow Transportation Average (TRAN)
has, to date, only retraced about half of the May decline and that TRAN
ended last week below its 50-day and 200-day MAs.
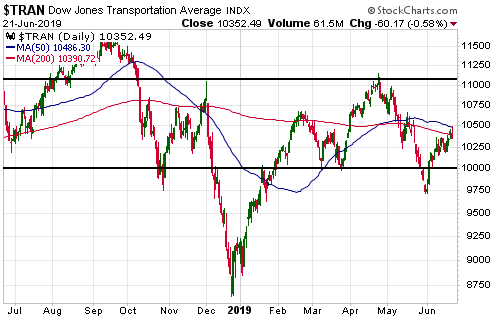
We continue to expect that another multi-week stock market decline
will begin by mid-July at the latest.
This week's
significant US economic events
[Notes:
1) The most important events
(to the markets) are shown
in bold. 2) A list of global economic events can be found
HERE]
| Date |
Description |
|
Monday Jun-24 |
No important events scheduled |
|
Tuesday Jun-25 |
Case-Siller Home Price Index
Consumer Confidence
New Home Sales |
|
Wednesday Jun-26 |
Durable Goods Orders |
|
Thursday Jun-27 |
Q1 GDP (revised)
Pending
Home Sales |
|
Friday Jun-28 |
Personal Income and Spending
Chicago PMI |
Gold and the Dollar
Gold
While we were putting together last week's Interim Update the US$ gold price was
breaking out to the upside. This prompted us to write:
"Gold's
correction from its early-June high turned out to be very brief and shallow. The
gold price has now broken above multiple important resistance levels on an
intra-day basis, but the key will be how it finishes the week. A weekly close by
the August contract above $1362 would be a confirmed breakout that would point
to additional gains prior to the next multi-month peak."
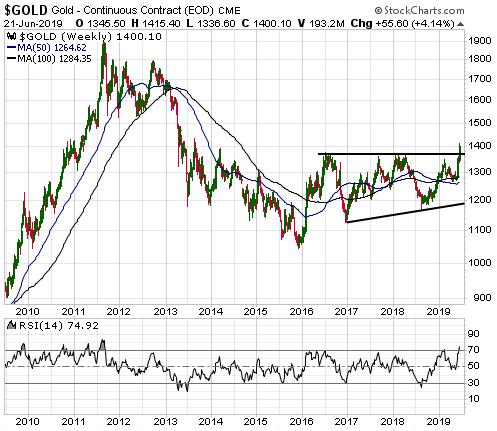
As shown by
the following weekly chart, gold not only managed to end the week above $1362,
it also managed to end the week above long-term resistance in the $1370s. The
following chart also shows that gold's weekly RSI, an intermediate-term momentum
indicator, ended last week at its highest level since 2011. Although this
implies that the market is stretched to the upside and in need of a correction,
it is a sign of strength.
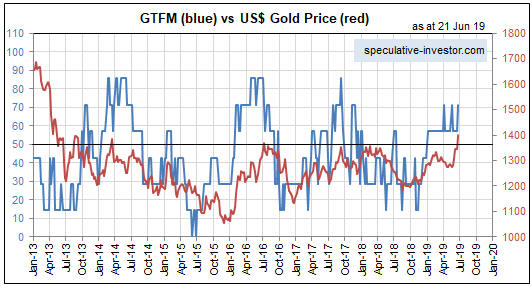
The price action is in line with the fundamentals as indicated by our Gold
True Fundamentals Model (GTFM). Refer to the following chart comparison of the
GTFM and the US$ gold price for more detail. Note that the GTFM moved a little
further into bullish territory last week due to the US dollar's downside
breakout.
Speculators have been getting more optimistic and adding to their collective
long positions in gold futures as the price has risen, but as at 18th June (the
date of the latest COT report) speculative optimism was not close to a dangerous
extreme.
With the fundamental backdrop still gold-bullish and speculative
optimism not yet at a level that warns of large downside price risk, we have no
reason to expect anything more bearish over the weeks ahead than a routine
correction that tests last week's breakout.
The one concern we have is
that part of the sharp upward move in the gold price during the second half of
last week was due to rising fear of military conflict in the Middle East. As
we've mentioned many times in the past, the idea that gold is a hedge against
military conflict is a widely-held superstition that leads to a price rise
whenever the risk of war appears to increase, but the market has NEVER sustained
such price gains and there is no good reason that it should. Therefore, whatever
proportion of last week's price gain was war-risk related will be given back
within the next few weeks.
We would be more concerned about the effect on
the gold price of war-related fear if not for the fact that the true
fundamentals (the things that really matter) have been gold-bullish all year and
became a little more so last week.
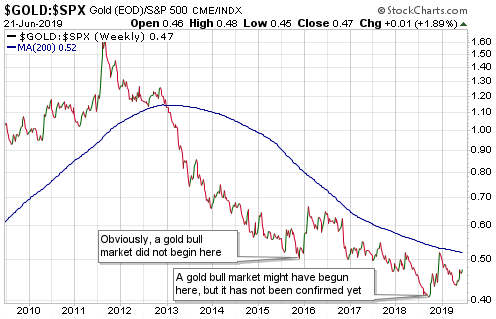
Another point is that last week's
upside breakout in the US$ gold price does not imply or confirm that gold is in
a bull market. As illustrated by the following weekly chart, the gold/SPX ratio
barely moved over the past two weeks and remains well below both its 200-week MA
and its late-December top.
It's possible that a new cyclical gold bull
market began last August, but it hasn't been confirmed yet.
Finally, this week is the final week of the month and the quarter, so the
closing prices on Friday 28th June could be critical. If gold manages to end
this week above US$1378 (the July-2016 high) it would be a breakout on the
monthly chart.
Silver
Last week the US$ gold
price broke above its July-2016 high. If silver had done the same it would now
be trading north of US$21.00/oz. Instead, although it was strong enough last
week to break above some notable resistance around $15.00, the following weekly
chart shows that the US$ silver price remains mired in a multi-year
downward-sloping 'wedge'.
The extent to which silver is lagging gold
suggests that the silver market has a lot of catching-up to do.
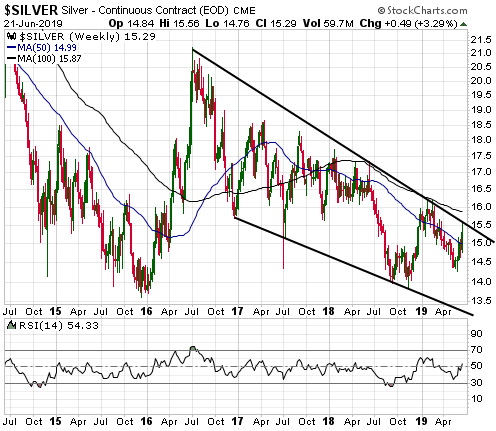
Silver has considerable resistance at $15.50-$16.20. Getting above this
resistance on a weekly closing basis would project a rather quick move up to
$21-$22.
Gold Stocks
GDX's daily RSI(14), a
short-term momentum indicator, hit its second-lowest level ever last August.
What this meant was outlined as follows in the 15th August 2018 Interim Update:
"Based on what tends to happen when a sell-off generates the sort of
momentum extreme achieved by the gold-mining indices and ETFs on Wednesday 15th
August, here's a likely short-term scenario for GDX:
1) A multi-week
price low within the next two weeks, probably not far below the 15th August low.
2) A sharp rebound to the 50-day MA or lateral resistance (former support)
at $21.00, whichever is the lower.
3) A decline that tests and possibly
breaches the August price low, with a positive RSI divergence.
4) A
stronger and longer rebound."
Apart from the initial rebound from
the momentum low (step 2) not reaching the 50-day MA, the pattern unfolded
exactly as described above.
When we wrote last week's Interim Update the
gold mining indices and ETFs were already short-term 'overbought'. This
suggested: "...a top that holds for at least a few weeks is close in terms
of time, but not necessarily in terms of price. If gold can hold the bulk of its
after-hours gains during Thursday's US trading session then the gold-mining
sector could make significant additional headway over the next few trading days."
In response to the upside breakout in the gold price, the gold-mining sector
moved sharply higher over the final two days of the week. As a result, GDX's
daily RSI, which hit its second-lowest level ever last August, is now at its
highest level ever. What does this tell us about the future?
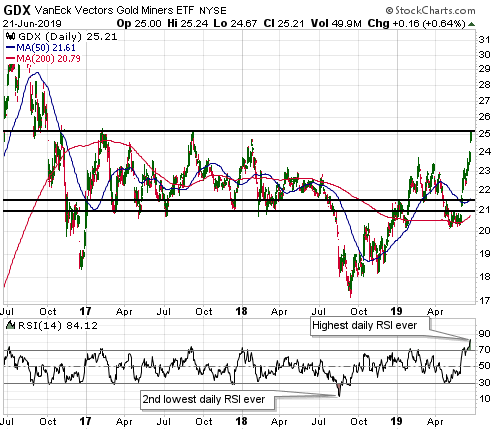
Unfortunately, the price pattern following an upward momentum extreme is not as
predictable as the price pattern following a downward momentum extreme. What we
can say is that when an upward momentum extreme occurs within a few weeks of an
important bottom it usually will be followed by some consolidation, but it tends
to have BULLISH implications with regard to the ensuing 2-4 months. Also,
following a momentum extreme such as the one just achieved by GDX, a new
short-term buying opportunity is created by a correction of sufficient magnitude
or duration to test the 50-day MA or push the daily RSI(14) down to 50.
Here are some other implications of last week's moon-shot in the gold-mining
sector:
1) GDX ended last week at long-term resistance. Perhaps there
will be a spike above this resistance early in the new trading week, but this
increases the probability that a correction/consolidation will begin very soon.
2) The more short-term bullish of the two 1980s models discussed a week ago
is now the more relevant.
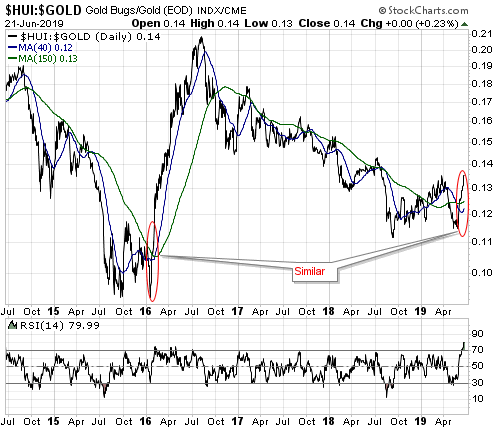
3) The HUI/gold ratio has blasted above its
40-day and 150-day MAs (see chart below). This is what should happen during the
first few weeks of a strong intermediate-term advance and is in stark contrast
to what happened during all other gold-mining rallies since early 2017.
As advised in last week's Interim Update, for new buying it makes more sense
to pick away at the stocks that have not moved by much from their lows --
provided that they are fundamentally sound -- than to jump into stocks that have
rallied hard already. In general, this means that new buying should be focused
on high-potential juniors that are still trading at depressed levels.
The Currency Market
The following daily chart shows that
the DX broke out to the downside from its 'rising wedge' last week. This is more
evidence that an intermediate-term downward trend is in progress. If so, the DX
will make a series of lower highs and lower lows over the coming 6-12 months.
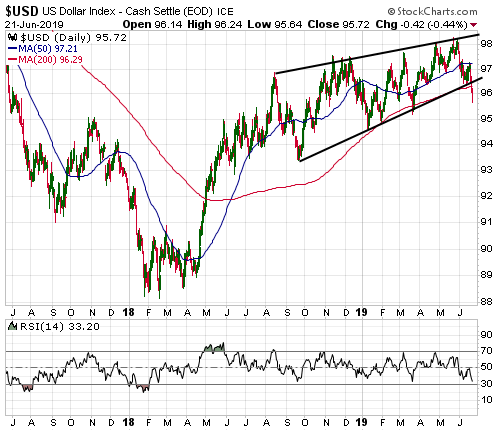
We doubt that the DX will extend its short-term decline by more than one
point before it commences a multi-week rebound. The reason is that the currency
market is becoming a little stretched on a short-term basis. In particular, the
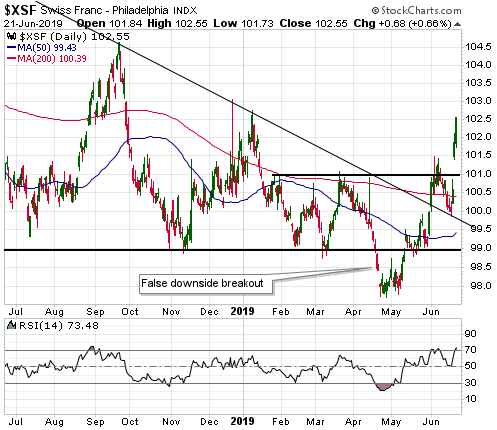
DX is almost 'oversold' and the currencies that have led the anti-dollar move
are now short-term 'overbought'. An example is the Swiss Franc (SF). The SF has
made a solid break above a confluence of resistance at 100-101, but a 'pause for
breath' involving a pullback to 101-101.5 to test its recent upside breakout
would be normal.
The
Australian dollar (A$) has been one of the worst-performing major currencies
over the past 12-18 months and has just tested its 10-year low. Here's the
relevant chart:
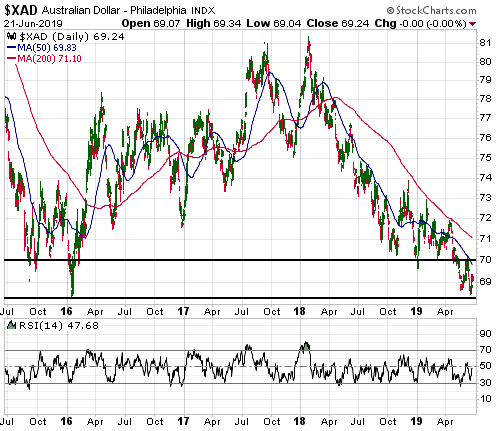
However, there is a good reason to expect that the A$ will be one of the
best-performing major currencies over the coming two years. The reason has to do
with the very strong performance over the past two years of the A$-denominated
gold price (gold/A$).
Here's a chart showing that gold/A$ has been
trending upward since mid-2017 and is now immersed in an upside blow-off (quite
possibly a trend-ending move).
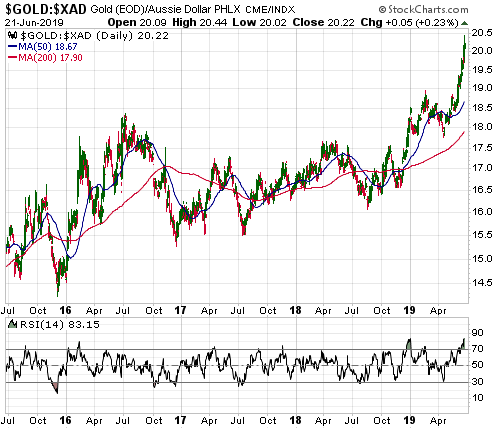
Gold/A$ tends to lead A$/US$ by 2 years plus/minus 6 months. (Note: There is
a fundamental reason for the lead-lag relationship, but we won't get into that
right now.) Most recently, for example, the late-2015 bottom in gold/A$ led to
the late-2017 bottom in the A$, the mid-2016 top in gold/A$ led to the
early-2018 top in the A$, and the gold/A$ correction from mid-2016 to mid-2017
led to weakness in the A$ over the past 12 months.
The large rise in
gold/A$ since mid-2017 suggests that A$/US$ will trade a long way above its
current level in 2021, but it doesn't provide any information about the likely
short-term twists and turns.
We would take a weekly close above 71 as an
early warning signal that a multi-year A$ upward trend had begun.
Updates
on Stock Selections
Notes: 1) To review the complete list of current TSI stock selections, logon at
http://www.speculative-investor.com/new/market_logon.asp
and then click on "Stock Selections" in the menu. When at the Stock
Selections page, click on a stock's symbol to bring-up an archive of
our comments on the stock in question. 2) The Small Stock Watch List is
located at http://www.speculative-investor.com/new/smallstockwatch.html
 Company
news/developments for the week ending Friday 21st June 2019:
Company
news/developments for the week ending Friday 21st June 2019:
[Note: AISC = All-In Sustaining Cost, EBITDA = Earnings Before Interest, Tax,
Depreciation and Amortisation (a measure of cash flow), EV = Enterprise Value or
Electric Vehicle, FS = Feasibility Study, FY = Financial Year, IRR = Internal
Rate of Return, ISR = In-Situ Recovery, JV = Joint Venture, MD&A = Management
Discussion and Analysis, M&I = Measured and Indicated, NAV = Net Asset Value,
NPV(X%) = Net Present Value using a discount rate of X%, NSR = Net Smelter
Return or Net Smelter Royalty, P&P = Proven and Probable, PEA = Preliminary
Economic Assessment, PFS = Pre-Feasibility Study]
*When
Golden Arrow Resources (GRG.V) published its latest quarterly report
3-4 weeks ago it was clear that the company would have to do another equity
financing very soon. A small financing (6M shares at C$0.20/share to raise
C$1.2M) was completed last week.
This financing will keep the lights on
for another month or two, but unless the company's minority-owned
Pirquitas-Chinchillas project is now cash-flow positive there will be yet
another equity financing within the coming three months.
GRG can be
likened to a long-dated out-of-the-money call option on the silver price. In the
absence of a significant silver rally, a long-dated silver call option will lose
value steadily due to a shrinking time premium and GRG shares will lose value
steadily due to a growing supply of shares. The difference is that GRG shares
don't have a fixed expiry date.
If the silver price gains a few dollars
at some point over the next several months, which is quite likely in our
opinion, then the prices of both GRG shares and long-dated silver call options
should rocket upward.
*US Gold Corp. (USAU) has
raised US$2.5M by indirectly issuing new shares at US$1.14/share (the financing
involves "Preferred Stock" exercisable into common stock). The financing also
includes share purchase warrants exercisable at US$1.14 that should bring in
another US$1.25M before year-end.
The main purpose of this financing is
to fund this year's drilling at the highly prospective, but very early stage,
Keystone gold project in Nevada.
List
of candidates for new buying
From within the ranks of TSI stock
selections the best candidates for new buying at this time, listed in
alphabetical order, are:
1) A40.AX (last Friday's closing price: A$0.15)
2) CGT.TO (last Friday's closing price: C$0.18)
3) KBLT.V at C$4.00
or lower (last Friday's closing price: C$4.13)
4) PPLT (last Friday's
closing price: US$76.46)
5) TK.V (last Friday's closing price: C$0.27)
The above list is limited to five stocks. It sometimes will contain less
than five, but it never will contain more than five regardless of how many
stocks are attractively priced for new buying.
Some
speculating ideas
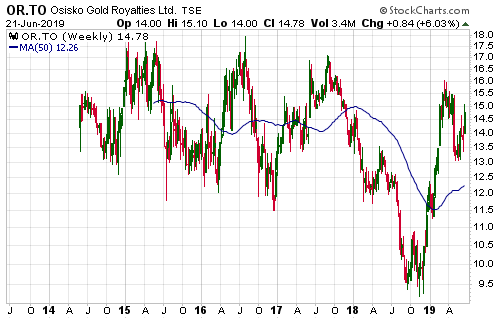
1) Osisko Gold Royalties Warrants
(TSX: OR.WT). Recent price: C$0.57
Our most recent mention of
these warrants was in the 27th February 2019 Interim Update, when they were
trading at C$0.44. The price subsequently rose to the C$0.90s and then dropped
all the way back to the C$0.40s before rebounding to the mid-C$0.50s.
The
warrants have an exercise price of C$36.50, meaning that they are a very long
way out of the money (OR ended last week at C$14.78). However, they don't expire
until 18th February 2022, so there is still a lot of time for the sort of
increase in the stock price that would inject substantial value into the
warrants.
We doubt that OR will ever trade above the C$36.50 exercise
price of these warrants, but we estimate that it would take only a 30%-40% gain
in the stock price within the next 6 months -- to around C$20-$21/share -- to
generate a gain of around 200% in the warrant price.
Here's a weekly
chart of OR.TO.
2) Taseko Mines (TGB, TKO.TO). Recent price: US$0.53
TGB has 246M shares outstanding, current copper production of around 100M
pounds/year at a mine in British Columbia, an interesting development-stage
copper project in Arizona that could be put into production over the coming 12
months, and a couple of potentially-valuable exploration-stage projects. It has
been in and out of the TSI Stocks List multiple times in the past, most recently
entering the List in July-2016 at US$0.54 and exiting in January-2017 at
US$1.47.
The company has mediocre management and its balance sheet is far
from healthy (there is long-term debt of C$340M), but it does not appear to be
at risk of going broke. Importantly, the stock can be relied on to provide
substantial upside leverage during copper-price rallies and offers reasonable
liquidity.
We think that copper will perform well in US$ terms and also
outperform gold over the coming 6-12 months. If so, TGB could do extremely well
over this period -- potentially returning to the US$1.50-$2.00 area.
TGB
appears to be building a base in the US$0.45-US$0.75 range and we won't be
surprised if the base-building process continues for a few more months.
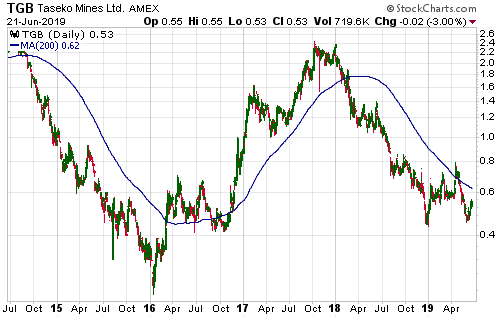
Chart Sources
Charts appearing in today's commentary
are courtesy of:
https://stockcharts.com/
