![]()
![]()
![]()
![]()
-- Weekly Market Update for the Week Commencing 24th July 2017
Big Picture
View
Here is a summary of our big picture
view of the markets. Note that our short-term views may differ from our
big picture view.
The BULL market in US Treasury Bonds that began in the early 1980s ended in early-2015, but there will be many years of topping action in bond prices and bottoming action in bond yields before major new trends get underway. (Last update: 29 June 2015)
The stock market, as represented by the S&P500 Index, commenced a secular BEAR market during the first quarter of 2000, where "secular bear market" is defined as a long-term downward trend in valuations (P/E ratios, etc.) and gold-denominated prices. This secular trend will bottom sometime between 2018 and 2020. (Last update: 29 June 2015)
A secular BEAR market in the US Dollar began during the final quarter of 2000 and ended in July of 2008. This secular bear market will be followed by a multi-year period of range trading. (Last update: 09 February 2009)
Gold commenced a secular bull market relative to all fiat currencies, the CRB Index, bonds and most stock market indices during 1999-2001. This secular trend will peak sometime between 2018 and 2020. (Last update: 29 June 2015)
Commodities,
as represented by the CRB Index, commenced a
secular BULL market in 2001 in nominal dollar terms. The first major
upward leg in this bull market ended during the first half of 2008, but
a long-term peak won't occur until 2018-2020.
(Last
update: 29 June 2015)
Copyright
Reminder
The commentaries that appear at TSI
may not be distributed, in full or in part, without our written permission.
In particular, please note that the posting of extracts from TSI commentaries
at other web sites or providing links to TSI commentaries at other web
sites (for example, at discussion boards) without our written permission
is prohibited.
We reserve the right to immediately
terminate the subscription of any TSI subscriber who distributes the TSI
commentaries without our written permission.
Outlook Summary
|
Market |
Short-Term (1-3 month) |
Intermediate-Term (6-18 month) |
Long-Term (2-5 Year) |
| Gold | N/A |
Neutral (21-Nov-16) |
Bullish |
| US$ (Dollar Index) | N/A |
Bullish (27-Feb-17) |
Neutral |
| US Treasury Bonds (TLT) | N/A |
Bearish (10-Jul-17) |
Bearish |
| Stock Market (DJW) | N/A |
Bearish (15-Feb-17) |
Bearish |
| Gold Stocks (HUI) | N/A |
Neutral (21-Nov-16) |
Bullish |
| Oil | N/A |
Neutral (10-Jul-17) |
Bullish |
| Industrial Metals (GYX) | N/A |
Neutral (29-May-17) |
Bullish |
4. Long-term views are determined almost completely by fundamentals and intermediate-term views
are determined by a combination of fundamentals, sentiment and technicals.
Last week's posts at the TSI Blog
Inflation as far as the eye can see
Don't
think like a lawyer
Summary of current
thinking/positioning
1) Thinking that tradable
rallies in gold, silver and the associated mining indices will begin in
August or September (probably the latter) and that weakness in the interim
should be viewed as an opportunity to scale into high-potential
gold/silver mining stocks or silver bullion.
2) Thinking that most
industrial commodities (excluding oil) and the associated equities have
bottomed. Looking for opportunities to establish trading positions in
stocks that offer significant leverage while remaining hedged against
short-term downside via XME (metals and mining) puts.
3) Expecting
the US stock market to suffer a 10%-20% decline within the next few months
and thinking that a bearish stock-market speculation (most stock markets,
not just the US) is currently the short-term macro trade with the best
risk/reward. Participating in this trade via various put options in our
own account and via EEM and AMZN put options in the TSI Stocks List.
4) Speculating on reversals in the Dollar Index (up) and the euro
(down), but now expecting the reversals to have only short-term
significance. Thinking that the commodity currencies are close to
short-term tops and getting more optimistic about the Yen's
intermediate-term prospects.
5) Thinking that the T-Bond has almost
completed a short-term rebound and will soon commence a tradable
multi-month decline.
6) Maintaining a large cash reserve to hedge
downside risk in equities (current cash percentage is about 40%).
Anticipating good opportunities to deploy some of this cash in gold and
industrial-commodity stocks (mainly the latter) during August-September.
Central Bank
Watch
A bull market in irony
Central bankers are talking more and more these days about aligning
their targeted interest rates with the economy's "neutral" or "natural"
interest rate. Ironically, the neutral/natural interest rate can only
exist in its true form in the absence of a central bank.
It should
be pointed out that what central bankers such as Janet Yellen call the
neutral or natural rate is not what it actually is. Central bankers define
the neutral rate as the rate that would neither stimulate nor cool the
economy, but this presumes that the central bank is capable of steering
the economy, which it definitely isn't*. The fact is that when central
banks distort interest rates the distortion will lead to economic problems
regardless of whether it involves forcing interest rates to be higher or
lower than they otherwise would be. For example, when central banks cause
interest rates to be artificially low they bring about a wealth transfer
from savers to spenders and entice leveraged investments that will prove
to be wasteful in the long run.
The true neutral, or natural, rate
is the rate that balances the time preferences of people throughout the
economy. In particular, during periods when the savings rate is relatively
high the natural rate will be relatively low and during periods when the
savings rate is relatively low the natural rate will be relatively high.
In other words, it is a reflection of what's happening, on average, with
saving and consumption-spending throughout the economy.
According
to Janet Yellen the neutral/natural rate is much lower today than it has
been in the past, and as a consequence the Fed will have to do much less
on the rate-hiking front this time around than it has in the past to
'normalise' its monetary policy. However, this line of thinking is so far
removed from correct economic theory it is not even wrong. It is complete
nonsense and therefore can't be invalidated using logic. The best we can
do at this time is summarise the process that has led to Yellen's absurd
conclusion that the neutral/natural rate has permanently fallen to a much
lower level than existed in the past.
The Fed has created economic
booms that inevitably have imploded, with each implosion prompting a new
and more aggressive bout of monetary intervention. For the bulk of each
boom the Fed forces most interest rates to be lower than they otherwise
would be, thus preventing interest rates from bringing about the trade-off
between consumption-spending and saving/investing that otherwise would
occur. In particular, when consumer spending ramps up there will, in the
absence of intervention, be a rise in interest rates that induces a
greater amount of saving and a concomitant reduced level of current
spending**, but thanks to the central bank's manipulation there are now
periods when the natural trade-off doesn't occur and we get parallel
increases in current consumption and long-term investing. These are the
boom periods. In effect, the booms are periods when the central bank's
manipulation of price signals sets in motion an economy-wide party during
which the 'seed corn' is consumed.
To put it another way, because a
large chunk of the investing that takes place during the
central-bank-sponsored boom is not funded by reduced consumption, the
future consumption upon which many of the long-term investments are
predicated cannot possibly happen.
As mentioned, the implosion of
each boom prompts a new and more aggressive bout of monetary intervention.
This has the effect of preventing the mistakes of the preceding boom from
being liquidated and results in new mal-investments being added to the
existing pile. Moreover, as the economy becomes increasingly distorted and
structurally weakened by this process it takes a lesser amount of 'policy
normalisation' by the central bank to set in motion the next
implosion/bust.
So, what Yellen thinks is a lower neutral rate is
actually a lower boom-bust threshold stemming from the Fed's earlier
manipulations.
If central bankers understood economics and what the
neutral/natural rate actually is, they would abolish their own jobs.
Without a central bank, interest rates would naturally balance saving,
investing and consumption. That's why the increasing lip service being
paid by central bankers to the idea of bringing policy rates into
alignment with the neutral rate constitutes a bull market in irony.
*The central bank can more accurately be viewed
as a force that wreaks havoc upon the economy than as a force that steers
the economy, with the amount of havoc being proportional to the extent of
the central bank's intervention.
**A simple
truth that Keynesians seem incapable of grasping is that increased saving
does not mean reduced spending; it means reduced spending in the present
in exchange for MORE spending in the future. By the same token, more
spending and less saving in the present means LESS spending in the future.
The ECB and Fed Meetings
The ECB met to
consider its monetary stance last Thursday and tried to downplay the
potential for a shift over the months ahead towards a less 'accommodative'
monetary policy. However, currency speculators have the proverbial bit
between their teeth and enthusiastically added to their euro 'longs' when
Draghi, at a press conference following the ECB meeting, didn't
specifically express worry over the euro's strength.
We suspect
that a tapering of ECB bond purchases will be announced in September at
roughly the same time as the Fed announces the start of quantitative
tightening (QT). The September meetings of the world's senior central
banks could therefore be interesting and significant.
The Fed also
has a meeting scheduled for this week, with the post-meeting announcement
coming on Wednesday 26th July. This meeting is effectively dead, as the
Fed is unlikely to do or say anything new and 'nobody' expects the Fed to
do or say anything new.
The Stock Market
The NASDAQ100 (NDX) ends
the week at a new high
With its tiny gain on Friday the
NDX extended its sequence of up-days to 11 and moved a little further into
new-high territory.
There's a greater-than-normal risk that last week's upside breakout
will prove to be false (the type of break through resistance/support that
occurs shortly before a reversal), but this is not the right time to
initiate a new NDX-focused bearish speculation. The reason is that there
is no evidence of a top and no well-defined place to set a protective
stop.
For those so inclined, a new opportunity to bet against this
extremely over-valued index would require a decline of at least a few
percent from the high and then a partial retracement of the decline.
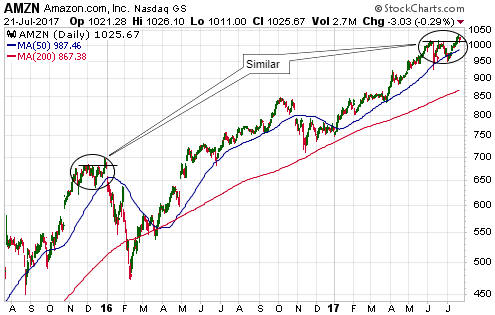
Amazon Update
Last week we gave six reasons
that the time was ripe for a bet against the stock price of Amazon.com
(AMZN). Reason no. 5 was:
"As AMZN's tentacles spread quickly
through the economy the company will draw increasing attention from
meddling politicians and regulators. It shouldn't draw such attention,
because the average person is a beneficiary of AMZN's expansion, but it
will, because competitors will lobby and politicians who have no
understanding of how a market works will cite improved competition as the
justification for placing limits on Amazon."
Increasing
scrutiny of Amazon by meddling politicians and regulators appears to have
begun. For example, here's the opening paragraph from a
21st July Reuters article:
"As part of its review of
Amazon's agreement to buy Whole Foods, the Federal Trade Commission is
looking into allegations that Amazon misleads customers about its pricing
discounts, according to a source close to the probe."
The FTC
is a counter-productive government agency that shouldn't exist, but once
such an agency is created then the people who are employed by it must
justify the agency's existence. The best way to do that is to go after the
highest-profile and most successful companies.
The market is yet to
become concerned about the various threats facing AMZN, as evidenced by
the fact that the stock made a new all-time high last Thursday before
pulling back a little. However, we point out that a similar break to a new
high happened in late-2015 -- shortly before the start of a large decline.
Note that the similarities with the late-2015 topping pattern will
mostly disappear if the stock makes a net gain over the course of this
week.
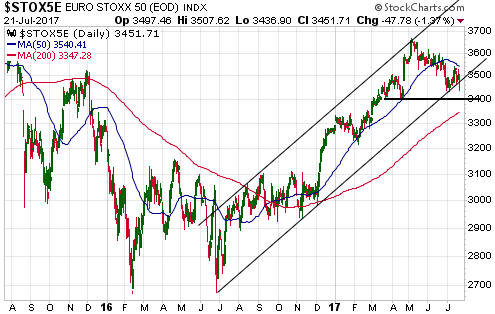
More evidence of an intermediate-term downward reversal in
Europe
The EURO STOXX 50 Index (STOX5E), the European
equivalent of the Dow Industrials Index, closed below the bottom of its
intermediate-term price channel last week. Additional downside over the
weeks immediately ahead will probably be limited by lateral support at
3400 or the 200-day MA near 3350, but we could be witnessing the first leg
of a major decline.
This week's
significant US economic events
[Notes:
1) The most important events
(to the markets) are shown
in bold. 2) A list of global economic events can be found
HERE]
| Date | Description |
| Monday Jul-24 | Existing Home Sales |
| Tuesday Jul-25 |
Consumer Confidence Case-Shiller Home Price Index |
| Wednesday Jul-26 |
New Home Sales FOMC Announcement |
| Thursday Jul-27 | Durable Goods Orders |
| Friday Jul-28 |
Q2 GDP (first estimate) Employment Cost Index Consumer Sentiment |
Gold and the Dollar
Gold Stocks
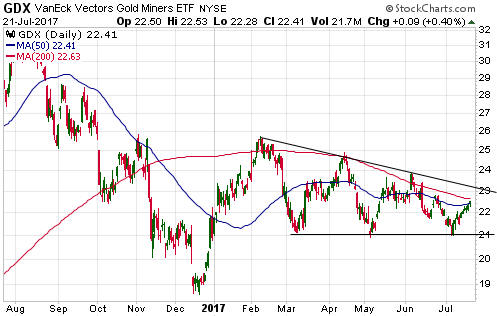
We have recently been fixating on
GDX because it is the gold-mining index/ETF with the most clear-cut chart
pattern.
As previously advised, GDX has two potential paths to a
buy signal. The first involves a break above the downward-sloping
trend-line that dates back to the early-February peak, that is, a break
above $23.20. The second involves a break below the March-May-July
triple-bottom at $21.00 followed by either a steep 2-4 week decline to an
'oversold' extreme or a quick reversal that paints the breakdown as false.
Last week's price action didn't get us significantly closer to a
buy signal, as all we got was a small extension to the modest rebound that
began about three weeks ago. GDX ended the week exactly at its 50-day MA
and slightly below its 200-day MA.
One way or the other we are
likely to get a sector-wide buying opportunity by the first half of
September.
The Currency Market
Currency COTs
Right now the most interesting Commitments of
Traders (COT) situations are in the currency futures market. With the help
of charts from
www.goldchartsrus.com, here they are:
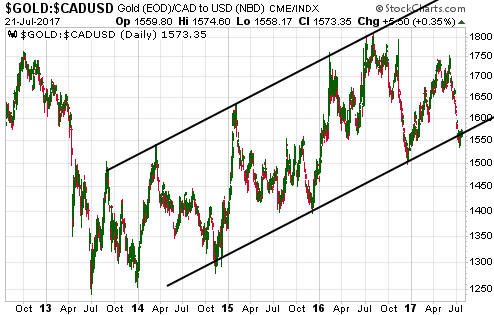
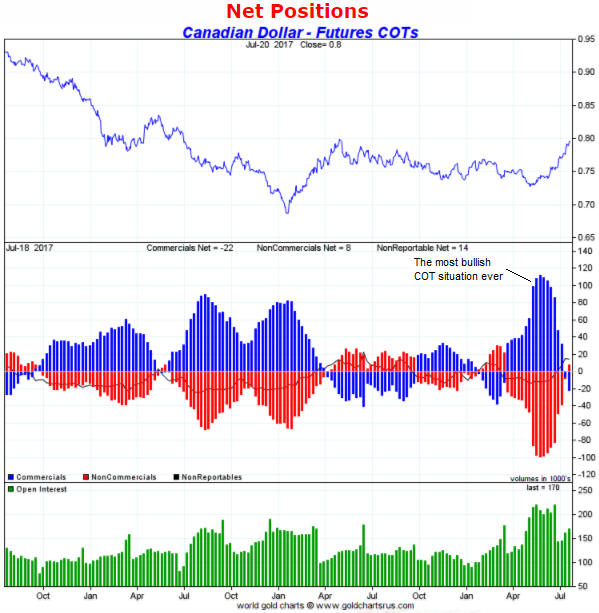
1) In early-May the
Canadian dollar (C$) had its most bullish COT situation ever, meaning that
the total speculative net-short position in C$ futures (the inverse of the
blue bars shown on the following chart) was higher than it had ever been.
This massive speculative net-short position has since been eliminated and
speculators, as a group, now have a small net-long position in C$ futures.
The elimination of the speculative net-short position in C$ futures
was both an effect and a cause of the C$'s strong rebound from its
early-May low. What happened was that after the C$ began to trend upward
for reasons unrelated to the COT, some speculators were prompted to cover
their 'shorts'. This short-covering pushed the price upward, which
prompted more speculators to cover, and so on.
The C$ is likely to
consolidate over the coming 1-3 months, but there is no good reason to
expect that the overall rally is complete.
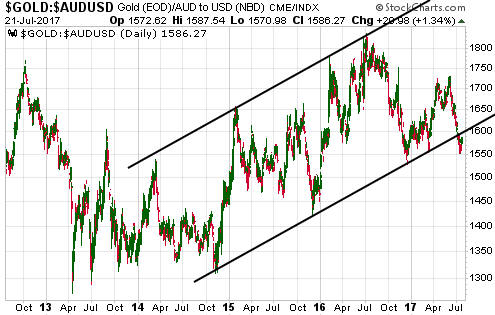
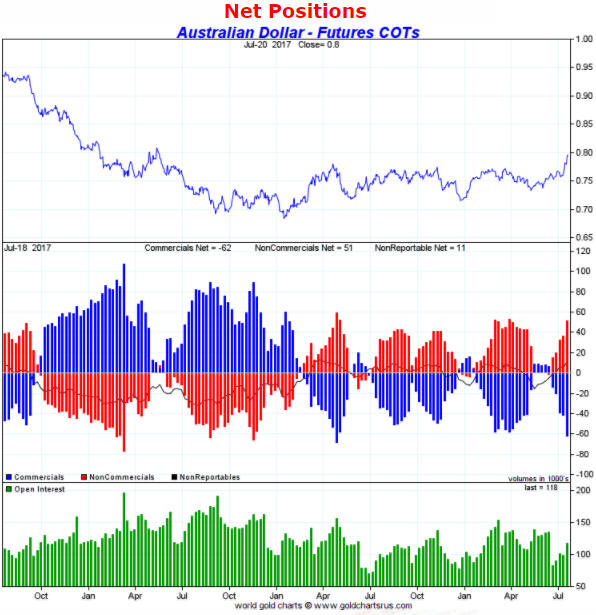
2) Like the C$, the Australian dollar (A$) has been propelled upward
by speculative buying since early-May. The difference is that the A$'s
rally began with only a small speculative net-short position and has been
fueled primarily by the initiation of new speculative 'longs' rather than
the covering of speculative 'shorts'. A consequence is that the
speculative net-long position in A$ futures is now close to a 3-year high.
This suggests that there is more short-term downside risk in the A$ than
the C$.
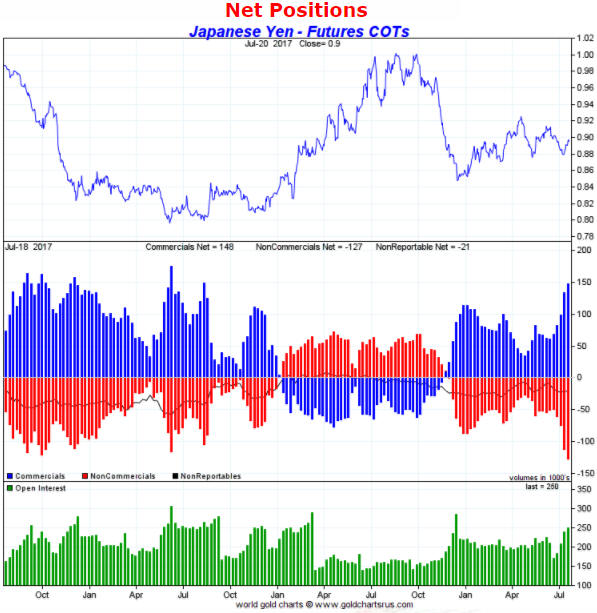
3) Of all the markets for which we track the relevant data, the Yen
now has the most bullish COT situation (the speculative net-short position
in Yen futures is near a 3-year high). This suggests that a tradable Yen
rally is brewing, although it doesn't preclude a decline to a new
multi-month low prior to the start of such a rally. In other words, the
Yen is in a similar position to gold.
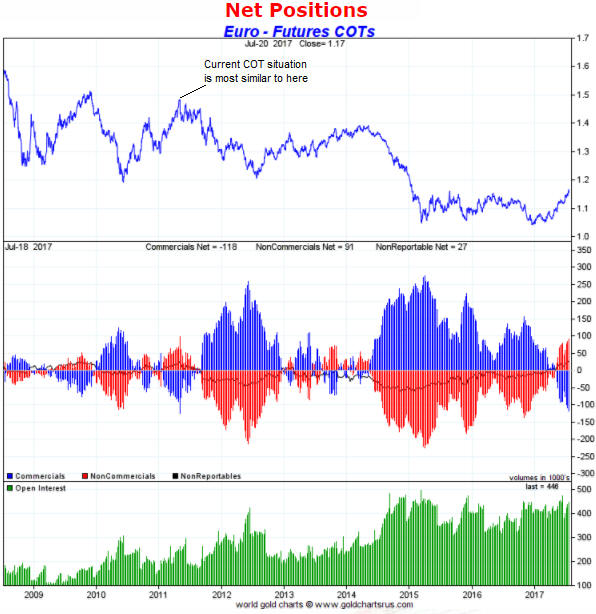
4) The above charts cover the past three years, but the following
chart of the euro COT situation covers the past nine years. A longer-term
chart is required for the euro to show that the speculative net-long
position in euro futures is at its highest level since 2011 and is close
to a 9-year high. In other words, the euro's COT situation is the most
bearish it has been since 2011.
That being said, a lot more
speculative longs would have to be added for the speculative positioning
in euro futures to become as skewed to the long side as it was skewed to
the short side in early-2015.
The euro has broken out
The
euro broke above its 2016 high last week and achieved its highest weekly
close since the first week of 2015. This indicates that we are dealing
with something more significant than a 3-6 month counter-trend rally such
as the rebounds that began in March-2015 and December-2015. At the same
time, it would be an understatement to say that the euro is now
'overbought'. As mentioned above, the total speculative net-long position
in euro futures is now at its highest level since 2011. Furthermore, the
bottom section of the following weekly chart shows that the euro's weekly
RSI is now at its highest level since 2008.
The implications of the recent price action and the current sentiment
and momentum extremes are that the euro could trade significantly higher
within the coming 12 months and that a substantial downward correction
lasting at least 2-3 months may soon begin.
Based on what happened
in the past a 2-3 month correction may not begin until there is a spike
above the 200-week MA (the red line on the above chart), but once a
correction does get underway the most plausible downside target will be
the 50-week MA (the blue line on the above chart).
Updates
on Stock Selections
Notes: 1) To review the complete list of current TSI stock selections, logon at
http://www.speculative-investor.com/new/market_logon.asp
and then click on "Stock Selections" in the menu. When at the Stock
Selections page, click on a stock's symbol to bring-up an archive of
our comments on the stock in question. 2) The Small Stock Watch List is
located at http://www.speculative-investor.com/new/smallstockwatch.html
![]() Company
news/developments for the week ending Friday 21st July 2017:
Company
news/developments for the week ending Friday 21st July 2017:
[Note: AISC = All-In Sustaining Cost, FS = Feasibility Study, FY =
Financial Year, IRR = Internal Rate of Return, ISR = In-Situ Recovery,
MD&A = Management Discussion and Analysis, M&I = Measured and Indicated,
NAV = Net Asset Value, NPV(X%) = Net Present Value using a discount rate
of X%, P&P = Proven and Probable, PEA = Preliminary Economic Assessment,
PFS = Pre-Feasibility Study]
*Almaden Minerals (AAU)
updated the market on the progress of its Tuligtic gold-silver project in
Mexico.
The company reported results from holes drilled inside and
slightly outside the PFS pit. These results add to the confidence level in
the resource estimate and could slightly increase the estimated resource.
Also, the company confirmed that the project FS is well underway and
that its environmental impact assessment is on track to be submitted to
the relevant Mexican authorities this quarter. Granting of the required
mine permits will, we think, be the catalyst for a takeover bid for AAU
next year.
*Alkane Resources (ALK.AX)
advised that its gold production during the June quarter was well above
plan at 28K ounces. This exceptionally good performance completely offset
the rain-related poor performance during the first two quarters of the
2017 Financial Year (FY), allowing the company to achieve its original
FY2017 production guidance of 65K-72K ounces. To be more specific, ALK's
Tomingley Gold Operation (TGO) produced 68.8K ounces during the year to
30th June 2017.
ALK stated that the excellent quarterly production
result enabled the addition of about A$16M of cash to its balance sheet
during the quarter. Given that the company was also cash-flow positive
during the March quarter we expect the annual report, which probably won't
be published until October, to show a much-improved working-capital
position. Our guess is that the working capital amount is now about A$35M,
up from A$16M at 31st December.
Lastly, the following excerpt from
what we wrote about ALK three weeks ago remains applicable:
"The
recent above-plan production performance at the TGO is very important, but
the main reason for our interest in ALK has always been the Dubbo Project
(DP) -- a potential future producer of zirconium, hafnium, niobium,
yttrium, and rare earth elements. The DP remains construction-ready with
all permits in place, but the commencement of construction depends on
financing, which, in turn, depends on the results of a study into the
economics of using a modularised build approach. Completion of this study
is expected within the next three months and is a potential catalyst for a
substantial up-move in ALK's share price."
*Blackham
Resources (BLK.AX) reported gold production for the June quarter.
The company had seemingly set the bar very low at the start of the quarter
by substantially reducing its guidance, but it still managed to achieve a
below-guidance result. Specifically, following a dismal operational
performance during the March quarter the company downgraded its FY2017
gold production forecast to 40K-45K ounces. The actual production for the
financial year was 39.4K ounces, or 0.6K ounces below the bottom and about
3K ounces below the mid-point of the downwardly-revised forecast range.
The lousy production performance during the March quarter was blamed
on unusually-heavy rainfall, but the June-quarter result indicates that
there are more serious problems with Stage 1 of the Wiluna-Matilda mining
operation. The main problem, in a nutshell, is that to date there has been
less gold in the mined ore than originally estimated. That is, the average
gold grade has been lower than planned.
Management expects better
production results over the next two quarters, but right now BLK's
management has no credibility.
Because BLK's production problems
are well known, its valuation is extremely low. This creates the potential
for a large upward re-rating of the shares in response to improved
operational performance. However, the risk is high, because if the
operational performance doesn't quickly improve then the company could run
short of cash and may be forced to do an equity financing that greatly
dilutes the stakes of current shareholders. In this regard, extending and
up-sizing the existing A$38M of debt, A$15M of which is due to be repaid
at the end of this year, would be very helpful.
Due to the high
risk the stock is not a top candidate for new buying despite its extremely
low valuation.
*Evolution Mining (EVN.AX)
reported a good set of quarterly production results. Gold production
during the June quarter across EVN's seven mining operations was 218K
ounces at an AISC of only A$825/oz (US$619/oz), allowing the company to
achieve the top half of its FY2017 800K-860K guidance range. Also, strong
cash generation of A$137M during the June quarter enabled the company to
pay A$125M off its debt.
EVN doesn't have the huge reward potential
of most of our other gold-mining stock selections, but on the other hand
it has lower operational risk than any other gold-mining company we know
of.
*Golden Arrow Resources (GRG.V) issued
a lengthy press release with two significant pieces of new information.
First, the company expects to receive the exploitation permit for the
Chinchillas silver project by the end of August. Recall that Chinchillas
is now part of a JV with Silver Standard Resources (SSRI) that combines
Chinchillas with the nearby in-production Pirquitas project. GRG's 25%
share of the JV is expected to result in the company having at least 2M
oz/year of silver production beginning in the second half of next year.
Second, GRG's exploration-stage projects in Argentina will be placed
into a separate company called BA Exploration that, with the exception of
an initial C$1M cash injection from GRG, will be self-funded via private
placements of equity. The new company will soon be listed on the stock
market, with GRG maintaining a controlling stake.
We view the
creation of BA Exploration as a positive development, for two reasons.
First, it will mean that the cash flow from the Pirquitas-Chinchillas JV
will not be consumed by exploration. Second, it will force the stock
market to assign a value to early-stage projects that would receive almost
no market recognition if they remained part of the parent company.
*Premier
Gold (PG.TO) had three noteworthy pieces of news last week.
First and foremost, the company reported that it produced 37.6K ounces
of gold in the June quarter, resulting in a first-half combined total of
88.6K ounces of gold from its Mercedes and South Arturo gold projects.
This was an above-plan performance that has prompted a small increase in
the full-year guidance -- from 125K-135K ounces to 130K-140K ounces. Also,
it means that when the quarterly financial results are published on 9th
August they should show another significant addition to the company's net
cash, which was C$81M at the end of the March quarter.
As an aside,
the current open-pit phase of the South Arturo project (40% PG, 60%
Barrick Gold) will soon be depleted and by late this year all of PG's
production will be from the 100%-owned Mercedes mine. That's why H2-2017
gold production is expected to be no more than 50K ounces, or at least 39K
ounces less than production during the first half. PG hasn't provided a
forecast for post-2017 production from this project, but there is scope
for two new open pits and an underground mining operation.
We
expect that South Arturo will again become a strong cash generator for PG
in 2019 or 2020, but until Barrick (the operator and senior partner) firms
up a mine plan it will be difficult to figure out what the project is
worth.
Second, the company reported that Greenstone Gold Mines, the
name of the 50/50 JV between PG and Centerra Gold that owns the
Feasibility-stage Hardrock gold project in Ontario, has submitted the
project's environmental impact statement/environmental assessment (EIS/EA)
to the Canadian government to initiate the formal environmental review
process. This project's economic potential has been downplayed over the
past year, but with an environmental permit and a gold price of US$1350/oz
it would be very valuable.
Third, the company reported that it has
received approval from the TSX to purchase up to 19.6M of its own shares
(about 10% of the total share count) on the stock market over the coming
12 months. This news is neutral.
Share buy-backs rarely make sense.
Moreover, they never make sense for companies that either do not have
extremely under-valued shares or will possibly need to raise cash in the
foreseeable future. PG has a lot of cash on its balance sheet at the
moment, but all of this cash will be needed within the next 2 years to
fund the projects in its development pipeline. It would therefore make no
sense for the company to use part of its current cash reserve to purchase
its own shares.
That being said, there's a good chance that PG's
management has no intention of spending significant cash on the purchase
of the company's own shares and that the share buyback approval has been
arranged primarily as a way of publicising management's belief that the
shares are under-valued.
![]() List
of candidates for new buying
List
of candidates for new buying
From within the ranks of TSI
stock selections the best candidates for new buying at this time, listed
in alphabetical order, are:
1) AKG (last Friday's closing price:
US$1.50)
2) EGD.V (last Friday's closing price: C$0.41)
3)
EVN.AX near A$2.00 (last Friday's closing price: A$2.18)
4) SFR.AX
(last Friday's closing price: A$5.70)
5) UUUU (last Friday's
closing price: US$1.69)
The above list is limited to five stocks.
It will sometimes contain less than five, but it will never contain more
than five regardless of how many stocks are attractively priced for new
buying.
![]() Updates
to the
TSI Small Stocks Watch List (SSWL)
Updates
to the
TSI Small Stocks Watch List (SSWL)
The SSWL is
a list of stocks that are too risky and/or illiquid to be considered for
the TSI Stocks List. We don't track these stocks closely in the TSI
commentaries, but they have favourable risk/reward ratios (high risk
versus much higher potential reward) and could be of interest to
speculators who are able to do their own due diligence.
Today we
are updating our thoughts on three of the existing SSWL members, starting
with Emmerson Resources (ERM.AX). ERM has a market
capitalisation of A$44M at last week's closing price of A$0.115.
ERM will soon start receiving a small production royalty due to the
mining, by a third party, of its Edna Beryl gold mine. Anticipation of
this royalty is probably responsible for the bounce in its stock price
over the past month, but the main reason for our interest in ERM is now
and has always been the likelihood that Evolution Mining (EVN.AX) would
make a takeover bid for the company. EVN is ERM's JV partner in the
Tennant Creek Mineral Field (TCMF), a highly prospective gold district
that contains the Edna Beryl mine.
At the end of this year EVN will
have earned a 65% stake in the TCMF by funding A$15M of work. It will then
have the option of increasing its stake to 75% (leaving ERM with 25%) by
funding an additional A$10M of work over the ensuing 2 years.
It's
possible -- and this is our speculation -- that rather than ponying-up an
additional $10M to obtain an additional 10% of the project, EVN will take
ownership of the entire project by purchasing ERM.
We view ERM as a
hold at this time, but new buying could make sense if there's a pullback
to around A$0.10 within the next few weeks.
The second SSWL member to warrant a mention at this time is
Cassini Resources (CZI.AX). CZI has a market capitalisation of
only A$14M at last week's closing price of A$0.05.
CZI's flagship
asset is the West Musgrave nickel-copper project in Western Australia, a
project with a global resource containing about 3.8B pounds of copper and
1.8B pounds of nickel. The project also offers some exposure to cobalt.
CZI currently owns 100% of West Musgrave, but Oz Minerals (OZL.AX), a
financially-strong mid-tier mining company, can earn 70% over the coming
few years by spending A$36M and completing a feasibility study.
It's the partnership with OZL that attracts us to CZI. Without this
partnership CZI would just be one of the numerous microcaps with large,
low-grade mineral deposits.
A critical time for the CZI-OZL
partnership will arrive in three months, in that October-2017 will be the
12-month anniversary of OZL's earn-in deal. This is critical because under
the terms of the deal OZL was obligated to spend A$3M during the first 12
months, at which point it would have to either commit to spending a lot
more (an additional A$33M over the ensuing 2.5 years to earn a 70% stake)
or walk away. October is also when the West Musgrave Project's Further
Scoping Study (FSS) is due to be complete.
It will be very good
news for CZI if OZL continues with the project. We think it will, but
there is obviously a risk that it won't. Furthermore, if OZL pulls out
then we will no longer be interested in CZI.
CZI is a high-risk,
but reasonable, speculation near its current price of A$0.05.
The third update is for Focus Ventures (FCV.V), a
tiny company with a current market cap of only C$9M that owns the large
Bayovar phosphate (fertiliser) project in northern Peru. Based on the
updated PFS completed in Q2-2016, this project is estimated to have an
after-tax NPV(7.5%) of US$458M (more than 60-times FCV's current market
cap).
FCV advised on Friday 21st July that it has signed a
memorandum of understanding (MOU) with Keytrade AG, a fertiliser trading
company, for the offtake of phosphate rock from the Bayovar project. Under
the MOU, Keytrade will purchase up to one million tonnes per year of rock
phosphate from future Bayovar production. Product will be delivered by
Keytrade for use by plantation markets and downstream phosphate fertiliser
producers.
This is positive news, but the big question and the
reason the shares continue to languish is: How will tiny FCV with its weak
balance sheet fund the on-going development of Bayovar?
The answer
is that the company will have to attract a well-financed JV partner or
there will have to be a sufficient rise in the speculative enthusiasm for
fertiliser-related equities to enable the company to finance itself
without massively diluting its per-share value. Either or both of these
could happen within the next 6 months, but FCV should be viewed as a
longshot.
Chart Sources
Charts appearing in today's commentary
are courtesy of:
http://stockcharts.com/index.html
http://bigcharts.marketwatch.com/